Abstract
This paper asks, when M002's all-cause finding that "adult death rates double about every 7 years with age" is split by cause, which causes double fast and which slowly, and how the all-cause speed is built from them. Using Table 5.15 of Vital Statistics, the logarithm of each cause's death rate at ages 40–84 in 2024 was fitted with a straight line against age (the same method as M002). No new mathematical theorem or new law is claimed.
First, the all-cause fit reproduces M002 exactly (men: slope 0.0992, doubling time 6.99 years; women: 0.0911, 7.60 years). Causes with any age group below 10 deaths (tuberculosis, asthma, old age and others) are not fitted (Section 3).
Second, doubling times differ widely by cause. For men, pneumonia (4.80 years) and renal failure (4.86) are fastest and liver disease is slow (14.52). For women, pneumonia is also fastest (5.24) and liver disease is 12.20. Suicide does not rise with age (slope −0.0048 for men, −0.0027 for women) (Section 4).
Third, cancer differs by sex. Men's cancer doubles in 5.99 years, faster than all causes (6.99), while women's cancer doubles in 8.64 years, slower than all causes (7.60) (Section 4).
Fourth, this is the core of the paper. The ratio of all-cause death rates between neighbouring age groups equals exactly the average of each cause's ratio weighted by its share of deaths in the lower group. With age, the share of fast-rising causes (old age, pneumonia, heart disease) grows, and the all-cause doubling time over each step shrinks from 7.99 years (40–44 to 45–49) to 5.72 (80–84 to 85–89) for men, and from 7.32 to 4.65 for women (Section 5).
Fifth, for women it slows in the 50s. Women's step doubling time is longest from 50–54 to 55–59 (9.90 years), and cancer's share of deaths is largest at 55–59 (0.544). Where the slowly rising cancer takes a large share, all causes rise slowly too (Section 5).
Sixth, the separator is each cause's speed and its share of deaths at each age. The all-cause "about 7 years" is not one speed but a mixture of causes with different speeds in shares that change with age. From 1980 to 2024 the all-cause speed barely moved (men 7.19 to 6.99 years), but inside it cancer got faster (7.90 to 5.99) and cerebrovascular disease slower (6.04 to 7.99) (Section 6).
Scope note: No new mathematical theorem or new law is claimed — that death rates rise exponentially with age (the Gompertz form) is known; this paper fits it cause by cause to a published table and splits the all-cause speed into a mixture of causes. This paper is a structural interpretation describing the shape of numbers in public aggregate data; it is not medical advice, diagnosis, or a treatment recommendation. The author is not a physician. For decisions about individual health, consult a physician or medical institution. It is a preprint that has not been peer reviewed. It is not one person's outlook — every figure lines up one year's age-specific death rates. It does not go into why speeds differ by cause. Causes are the underlying causes on death certificates, and the numbers move with how causes are classified. Causes with fewer than 10 deaths in any cell used for fitting are not fitted and not shown. About the data: the e-Stat Vital Statistics are used under the Public Data License (Version 2.0); this paper's fits and decompositions were produced by processing them. Source: Ministry of Health, Labour and Welfare, Vital Statistics. What this paper adds is lining up cause-specific doubling times with the same method; splitting the rise in all-cause death rates, as an identity, into a share-weighted average of causes, and showing that the all-cause step speed changes as the mix moves toward fast-rising causes with age; and showing that from 1980 to 2024, while the all-cause speed barely moved, cause-specific speeds moved in opposite directions.
1. Notation and question
- Fit: over the nine five-year groups at ages 40–84, fit ln(death rate) = level + slope × (age − 62.5) (the same as M002).
- Doubling time = ln2 ÷ slope: how many years of age double the death rate.
- Step doubling time: from the ratio G of death rates in neighbouring five-year groups, 5 × ln2 ÷ ln G.
- Mixture of causes: the all-cause ratio G between neighbouring groups equals exactly Σ w × g, the average of each cause's ratio g weighted by its share w of deaths in the lower group. A cause's contribution = (the increase in its rate) ÷ (the increase in the all-cause rate); contributions sum to 1.
Question: How much do doubling speeds differ by cause, and how is the all-cause speed built from them?
Observation 1.1: The all-cause death rate is the sum of cause-specific rates. If fast-rising and slow-rising causes are mixed, the all-cause speed is set by the shares each cause takes, and those shares change with age.
2. Survey and design
To be candid: the design was decided after looking at the tables.
| Content | |
|---|---|
| Table | Table 5.15: deaths and death rates by cause-trend classification × sex × five-year age group × year (the same file as M002) |
| All causes | Published death rates on the "all causes" sheet (the same as M002) |
| Cause-specific rates | Deaths ÷ population × 100,000; population = deaths ÷ death rate × 100,000 from the "all causes" sheet |
| Causes | 15 (traffic accidents excluded as a subset of accidents) and "other" (all causes minus the 15) |
| Years | 2024, with 1980 for comparison |
3. Data and checks
Calculation 3.1 The retrieved file was fixed by SHA-256, and the following were checked.
| Check | Result |
|---|---|
| All-cause fit, 2024 (men) | Slope 0.0992, doubling time 6.99 years, R² 0.9994, rate at 62.5 805.0 (matches M002) |
| All-cause fit, 2024 (women) | Slope 0.0911, doubling time 7.60 years, R² 0.9915, rate at 62.5 394.4 (matches M002) |
| Mixture identity | In every group, all-cause ratio = share-weighted average of cause ratios; contributions sum to 1 |
| Causes not fitted (men) | Tuberculosis, chronic bronchitis and emphysema, asthma, gastric and duodenal ulcer, old age (some group below 10 deaths) |
| Causes not fitted (women) | Tuberculosis, hypertensive disease, chronic bronchitis and emphysema, asthma, gastric and duodenal ulcer, renal failure, old age |
Observation 3.2: Old age has many deaths at 40–84 (12824 men, 13165 women), but 4 age groups for each sex have fewer than 10 deaths, so it is not used in the straight-line fit. In the mixture of Section 5, old age is included as a cause (only cells with 10 or more deaths are shown in the text).
4. Doubling speed by cause
Calculation 4.1 Fits at ages 40–84 in 2024 (men, shortest doubling time first)
| Cause | Slope | Doubling time | R² | Rate at 62.5 (per 100,000) | Deaths at 40–84 |
|---|---|---|---|---|---|
| Pneumonia | 0.1445 | 4.80 | 0.9985 | 18.7 | 20938 |
| Renal failure | 0.1426 | 4.86 | 0.9897 | 8.2 | 8059 |
| Cancer | 0.1157 | 5.99 | 0.9892 | 232.4 | 161600 |
| Hypertensive disease | 0.1080 | 6.42 | 0.9619 | 4.9 | 3051 |
| Other | 0.1071 | 6.47 | 0.9987 | 205.7 | 137456 |
| Heart disease | 0.0963 | 7.20 | 0.9959 | 111.3 | 63701 |
| Diabetes | 0.0957 | 7.25 | 0.9829 | 10.9 | 6049 |
| Cerebrovascular | 0.0867 | 7.99 | 0.9959 | 60.6 | 32300 |
| Accidents | 0.0796 | 8.71 | 0.9855 | 30.6 | 15402 |
| Liver disease | 0.0478 | 14.52 | 0.8786 | 27.2 | 10495 |
| Suicide | −0.0048 | — (does not rise) | 0.3479 | 26.2 | 9095 |
Calculation 4.2 The same for women
| Cause | Slope | Doubling time | R² | Rate at 62.5 (per 100,000) | Deaths at 40–84 |
|---|---|---|---|---|---|
| Pneumonia | 0.1322 | 5.24 | 0.9914 | 6.4 | 8180 |
| Heart disease | 0.1107 | 6.26 | 0.9875 | 34.6 | 31921 |
| Other | 0.1056 | 6.56 | 0.9860 | 85.9 | 73623 |
| Diabetes | 0.1015 | 6.83 | 0.9924 | 3.6 | 2774 |
| Accidents | 0.0926 | 7.49 | 0.9763 | 11.3 | 8243 |
| Cerebrovascular | 0.0901 | 7.69 | 0.9728 | 26.0 | 18325 |
| Cancer | 0.0802 | 8.64 | 0.9925 | 175.1 | 99191 |
| Liver disease | 0.0568 | 12.20 | 0.9885 | 9.2 | 4311 |
| Suicide | −0.0027 | — (does not rise) | 0.1423 | 10.6 | 3865 |
Observation 4.3: For both sexes, the fastest-doubling fitted cause is pneumonia (men 4.80 years, women 5.24). Liver disease is slow (men 14.52, women 12.20), and suicide has a negative slope and a small R² (men 0.3479, women 0.1423), so it does not take a rising form with age.
Observation 4.4: Cancer's doubling time is 5.99 years for men and 8.64 for women, a difference of 2.65 years. Men's cancer is faster than all causes (6.99), and women's slower than all causes (7.60). The same "cancer" rises with age at different speeds by sex.
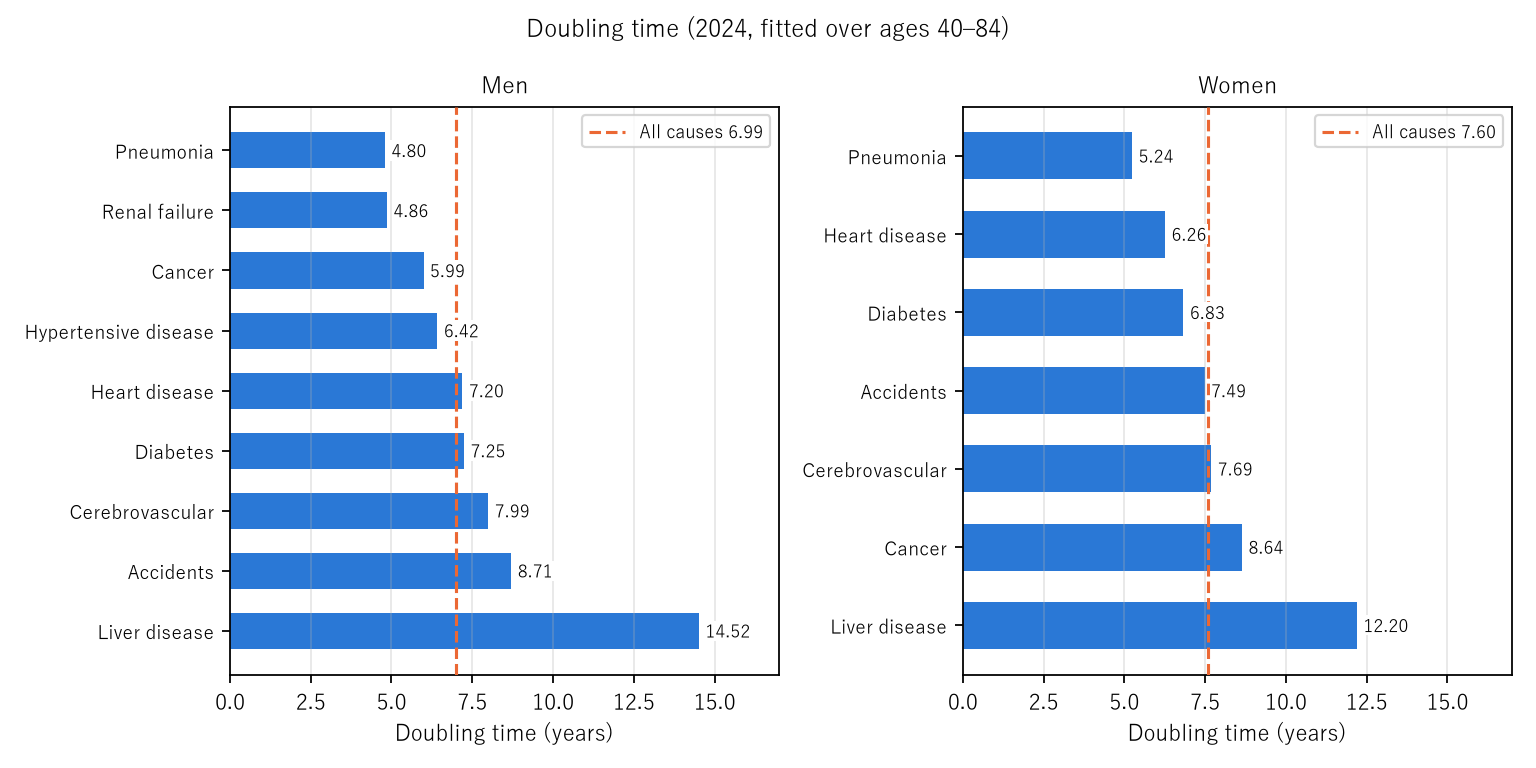
Figure 1: Doubling time by cause; men on the left, women on the right. The red dashed line is all causes. Shorter bars mean faster doubling with age. Suicide, which does not rise, is not drawn.
5. Core — the all-cause speed is a mixture of causes
Calculation 5.1 All-cause step doubling time (2024, neighbouring five-year groups)
| Step | Men | Women |
|---|---|---|
| 40–44 → 45–49 | 7.99 | 7.32 |
| 45–49 → 50–54 | 7.26 | 7.94 |
| 50–54 → 55–59 | 6.95 | 9.90 |
| 55–59 → 60–64 | 7.14 | 9.26 |
| 60–64 → 65–69 | 6.74 | 7.93 |
| 65–69 → 70–74 | 6.39 | 6.44 |
| 70–74 → 75–79 | 7.99 | 6.93 |
| 75–79 → 80–84 | 6.08 | 4.98 |
| 80–84 → 85–89 | 5.72 | 4.65 |
Calculation 5.2 Contributions to the all-cause rise (2024; five largest; in brackets, share of deaths in the lower group and the cause's ratio)
| Sex and step | All-cause ratio | Largest contributions |
|---|---|---|
| Men 40–44→45–49 | 1.543 | cancer 0.296 (0.164, 1.98), other 0.237 (0.223, 1.58), heart disease 0.199 (0.119, 1.90), cerebrovascular 0.090 (0.098, 1.50), liver disease 0.083 (0.060, 1.75) |
| Men 80–84→85–89 | 1.832 | other 0.331 (0.312, 1.88), heart disease 0.150 (0.128, 1.98), old age 0.142 (0.054, 3.18), cancer 0.137 (0.289, 1.39), pneumonia 0.091 (0.062, 2.23) |
| Women 40–44→45–49 | 1.605 | cancer 0.609 (0.429, 1.86), other 0.145 (0.193, 1.45), cerebrovascular 0.089 (0.065, 1.82), heart disease 0.050 (0.068, 1.44), liver disease 0.036 (0.042, 1.52) |
| Women 80–84→85–89 | 2.107 | other 0.295 (0.306, 2.07), old age 0.226 (0.091, 3.76), heart disease 0.172 (0.139, 2.37), cancer 0.110 (0.264, 1.46), cerebrovascular 0.072 (0.071, 2.12) |
Observation 5.3: The all-cause step doubling time shrinks from 7.99 to 5.72 years for men and from 7.32 to 4.65 for women. From the early to the late 80s, old age, with large ratios of 3.18 (men) and 3.76 (women), carries contributions of 0.142 and 0.226 despite shares of only 0.054 and 0.091. Cancer, with shares of 0.289 and 0.264 but small ratios of 1.39 and 1.46, contributes only 0.137 and 0.110.
Observation 5.4: For women it slows in the 50s. The step doubling time is longest from 50–54 to 55–59 (9.90 years), and cancer's share of deaths is largest at 55–59 (0.544). For women cancer is a slowly rising cause, so all causes rise slowly at the ages where cancer's share is large. For men, cancer's share grows from 0.164 at 40–44 to 0.386 at 70–74 and is 0.289 at 80–84.
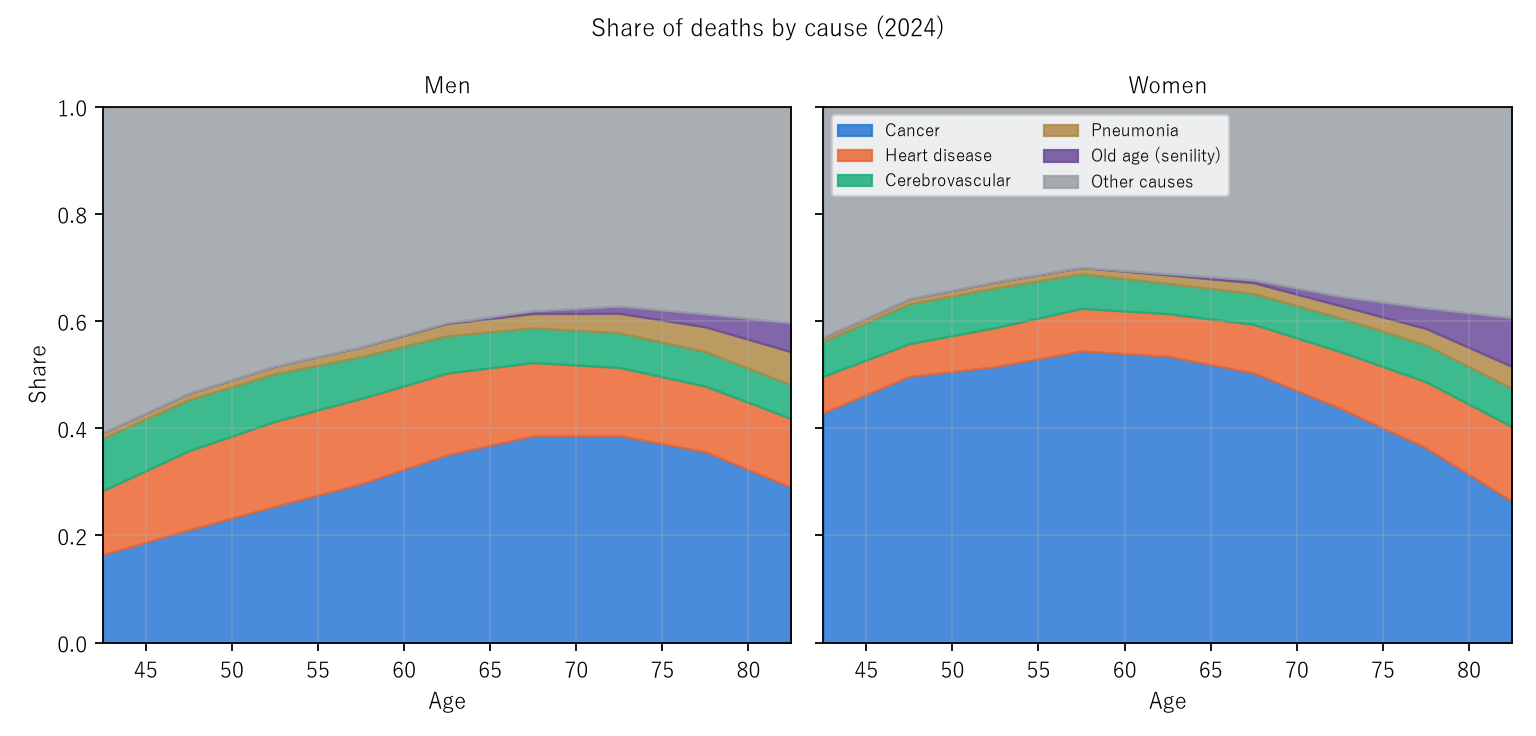
Figure 2: The share of deaths taken by main causes in each age group; men on the left, women on the right. Blue cancer, red heart disease, green cerebrovascular, brown pneumonia, purple old age, grey other causes. Women's blue (cancer) peaks in the 50s, and at old ages purple (old age) and brown (pneumonia) widen.
6. 1980 and 2024
Calculation 6.1 Doubling times of main causes (fitted over ages 40–84; R² in brackets)
| Cause | Men 1980 | Men 2024 | Women 1980 | Women 2024 |
|---|---|---|---|---|
| Cancer | 7.90 (0.9690) | 5.99 (0.9892) | 9.65 (0.9902) | 8.64 (0.9925) |
| Heart disease | 6.53 (0.9963) | 7.20 (0.9959) | 5.57 (0.9941) | 6.26 (0.9875) |
| Cerebrovascular | 6.04 (0.9942) | 7.99 (0.9959) | 5.42 (0.9949) | 7.69 (0.9728) |
| Pneumonia | 4.70 (0.9921) | 4.80 (0.9985) | 4.77 (0.9845) | 5.24 (0.9914) |
| Accidents | 15.74 (0.9717) | 8.71 (0.9855) | 9.39 (0.9601) | 7.49 (0.9763) |
| All causes | 7.19 (0.9965) | 6.99 (0.9994) | 6.68 (0.9919) | 7.60 (0.9915) |
Observation 6.2: Men's all-cause doubling time barely moved (7.19 years in 1980, 6.99 in 2024), but inside it cancer got faster (7.90 to 5.99), while cerebrovascular disease (6.04 to 7.99) and heart disease (6.53 to 7.20) got slower. Accidents got much faster (15.74 to 8.71). M002's "the doubling speed barely moved" is about all causes; cause-specific speeds moved in opposite directions.
7. Limitations
- These line up one year's age-specific rates; they are not the speed at which one person ages.
- Causes are underlying causes on death certificates and move with classification. "Other" is a collection of different causes and accounts for many deaths at 40–84 for men (137456).
- The straight-line fit covers ages 40–84 only. Causes with few deaths at young ages, such as old age, are not fitted.
- Why speeds differ by cause is not examined.
- Cause classification (ICD revision) differs between 1980 and 2024. The cause-trend classification is meant for following trends, but a cause with the same name may not have the same content.
- It is not one person's outlook.
Conclusion
Men's 6.99-year all-cause doubling time is the result of mixing causes from pneumonia, doubling in 4.80 years, to liver disease at 14.52. The mixing shares move toward fast-rising causes with age, and the all-cause step doubling time shrank from 7.99 years in the early 40s to 5.72 in the early 80s. Cancer differs by sex, 5.99 years for men and 8.64 for women, and for women all causes rose slowly in the 50s, where cancer's share is large. And from 1980 to 2024, inside an all-cause speed that barely moved, cancer got faster and cerebrovascular disease slower.
Two things separate them — each cause's speed and its share of deaths at each age.
When you hear "death rates double about every 7 years", remember that it is an average mixing causes of different speeds in shares that change with age.
Data and reproduction
| Data | Ministry of Health, Labour and Welfare, Vital Statistics 2024 (final data), Volume 1, Table 5.15 (e-Stat, accessed 25 September 2026) |
| Terms of use | e-Stat follows the Public Data License (Version 2.0). This paper's fits and decompositions were produced by processing it and are not figures produced by the government |
| Scope | Japan, by sex, ages 40–89, 2024 (with 1980 for comparison) |
| Verification | 検算/M019.py (--zu also writes the figures). Every number in the text is taken from 検算/M019_output.txt |
| Raw data | The 1 retrieved file and SOURCES.md (URL, retrieval date, SHA-256, terms of use, how the calculation is set up) in data/ |
| Figures | 図/M019_zu1, 図/M019_zu2 (png, svg, English versions) |
References
- Ministry of Health, Labour and Welfare. Vital Statistics 2024 (final data), Volume 1, Table 5.15 (in Japanese). e-Stat (accessed 25 September 2026). https://www.e-stat.go.jp/
- Yamagishi, Y. (2026). The Speed at Which Adult Death Rates Double with Age Hardly Moved; What Fell Was the Level [M002]. Zenodo. https://doi.org/10.5281/zenodo.22963210
Reference
Yamagishi, Y. (2026). Men's 6.99-Year Doubling Time of the Death Rate Is a Mixture Ranging from Pneumonia at 4.80 Years to Liver Disease at 14.52 [M019]. Zenodo.
DOI: 10.5281/zenodo.22967853
YOI: https://www.yamagishiyuuki.com/yoi/M019
ORCID: 0009-0006-8587-3450
PDF (English) · PDF (Japanese) · Date proof of the English PDF (OpenTimestamps .ots) · SHA256SUMS
The record page for this paper (in Japanese, with the PDFs in each language and the date proof): YOI M019. This paper is a preprint and has not been peer reviewed.