Abstract
This paper asks what lies inside "age-specific death rates fall, yet the number of deaths rises", and where the future peak in deaths comes from. It uses the National Institute of Population and Social Security Research's Population Projections for Japan (2023): three projections that keep medium fertility and vary only the mortality assumption (medium, high, low), with their deaths and populations, plus actual deaths and 2024 age-specific death rates from Vital Statistics. No new mathematical theorem or new law is claimed.
First, the projected deaths in four age groups sum to the projected total, and the five-year populations sum to the total. The peak in deaths is in 2040 at 1,665,021 under medium mortality, in 2038 under high and in 2042 under low mortality, with a height difference (high minus low) of 61,960 (Sections 3 and 4).
Second, this is the core of the paper. Applying 2024's sex- and five-year-age-specific death rates unchanged to the projected population, deaths pass 2,083,662 in 2040 and keep rising to 2,284,947 in 2065 (on five-yearly points). The projected (medium) deaths in 2070 are 0.695 times that. The peak comes in 2040 because age-specific rates are assumed to keep falling (Section 5).
Third, the death rate per 1,000 keeps rising after the peak. Under medium mortality it rises from 12.4 in 2025 to 17.5 in 2070, and all three projections are highest in 2069. The number falls while the proportion of the population rises (Section 4).
Fourth, the combined death rate for ages 75 and over rises even with rates held fixed. With 2024 rates, the 75+ rate rises from 62.51 in 2025 to 79.06 in 2040 and 89.66 in 2070, because within 75+ the population shifts toward older ages (Section 6).
Fifth, actual deaths exceeded the projection (medium) in every year from 2021 to 2024, with the gap widening from +1,747 to +106,175. In 2023 and 2024 the high-mortality projection was closest (Section 7).
Sixth, the separator is the population's age composition and the assumption that rates will fall. The "peak in deaths" is not set by the population's shape alone; it rests on an assumption about future rates.
Scope note: No new mathematical theorem or new law is claimed — the population projections are published; this paper lines them up with actual numbers and with rates held at 2024 levels and measures what lies inside the peak. This paper is a structural interpretation describing the shape of numbers in public aggregate data; it is not medical advice, diagnosis, or a treatment recommendation. The author is not a physician. For decisions about individual health, consult a physician or medical institution. It is a preprint that has not been peer reviewed. It is not one person's outlook — all figures are national aggregates. It says nothing about whether the projections are good or which will come true — only which projection the actual number was closest to in each year. It does not go into why actual deaths exceed the projection (such as the COVID-19 pandemic). "2024 rates held fixed" is this paper's comparison calculation, not a projection (the projected population includes foreign residents, while 2024 rates are for Japanese nationals). About the data: processed from "Population Projections for Japan (2023)" (National Institute of Population and Social Security Research) (https://www.ipss.go.jp/pp-zenkoku/j/zenkoku2023/pp_zenkoku2023.asp ). The Institute's content is used under the Public Data License (Version 1.0), and the e-Stat Vital Statistics under the Public Data License (Version 2.0). The figures in this paper were not produced by the government or the Institute. What this paper adds is setting the projected peak beside deaths with 2024 rates held fixed and showing that the peak comes from the assumed decline in rates, showing that the combined 75+ rate rises from age composition alone, and matching actual deaths in 2021–2024 against the three projections.
1. Notation and question
- Projections: the three projections in "Population Projections for Japan (2023)" that keep medium fertility and vary mortality (medium, high, low). Deaths are for calendar years (1 January to 31 December).
- Death rate (per 1,000): deaths ÷ population × 1,000 (values in the projection tables).
- 2024 rates held fixed: the projected (medium) population (by sex and five-year age, 90+ combined) multiplied by 2024's sex- and five-year-age-specific death rates, summed.
Question: Why do deaths rise while age-specific rates fall? Does the future peak come from the population's shape or from the assumption about rates?
Observation 1.1: Deaths are the age-by-age sum of "population × rate". If the population at old ages grows, deaths can rise even as rates fall. Conversely, whether there is a peak depends not only on the population's shape but also on how much rates fall (the two movements that M001 separated in past crude death rates, seen here in future numbers).
2. Survey and design
To be candid: the design was decided after looking at the tables.
| Content | |
|---|---|
| Projected deaths | Tables 1-8, 4-8 and 7-8 (total population) and 1-8(J), 4-8(J) and 7-8(J) (Japanese population), 2021–2070 |
| Projected deaths by age | Tables 1-12, 4-12 and 7-12: sex × four age groups (0–14, 15–64, 65–74, 75+) |
| Projected population | Tables 1-9A, 4-9A and 7-9A: sex × five-year age, every five years from 2020 to 2070 (1 October) |
| Actual deaths | Vital Statistics, Table 5.4 (2021–2024) |
| 2024 rates | Vital Statistics, Table 5.15 (all-causes sheet; sex × five-year age, 90+ combined) |
| Change from the first design | Splitting the change in deaths with four-age-group rates showed the 75+ rate rising within the projection (men 67.04 to 73.73), so "rate effects" mixed in age composition; the design switched to comparing with 2024 five-year rates |
3. Data and checks
Calculation 3.1 The retrieved files were fixed by SHA-256, and the following were checked.
| Check | Result |
|---|---|
| Projection years | 50 years, 2021–2070; five-year populations every five years 2020–2070 |
| Four age groups sum to projected deaths | Match in every year and projection (largest difference 2 people, from rounding to thousands) |
| Five-year populations sum to the total | Match (largest difference 4 people) |
| Period of projection years | The total-population table notes "for the period 1 January to 31 December" |
4. The projected peak in deaths
Calculation 4.1 Deaths (total population) and death rates in the three projections
| Projection | Peak year | Peak deaths | 2025 | 2070 | Death rate per 1,000, 2025→2070 | Year of highest rate |
|---|---|---|---|---|---|---|
| Medium mortality | 2040 | 1,665,021 | 1,524,571 | 1,521,416 | 12.4 → 17.5 | 2069 |
| High mortality | 2038 | 1,697,656 | 1,626,327 | 1,517,456 | 13.3 → 17.8 | 2069 |
| Low mortality | 2042 | 1,635,696 | 1,425,737 | 1,522,409 | 11.5 → 17.1 | 2069 |
Observation 4.2: The peak falls in 2038–2042, earlier and higher the higher the assumed mortality. The height difference (high minus low) is 61,960. In 2070 all three give almost the same deaths, 1,517,456–1,522,409.
Observation 4.3: The death rate per 1,000 keeps rising after the peak and is highest in 2069 in all three. Even while deaths fall, the population falls faster, so the proportion rises. "Deaths fall" and "the death rate falls" are not the same.
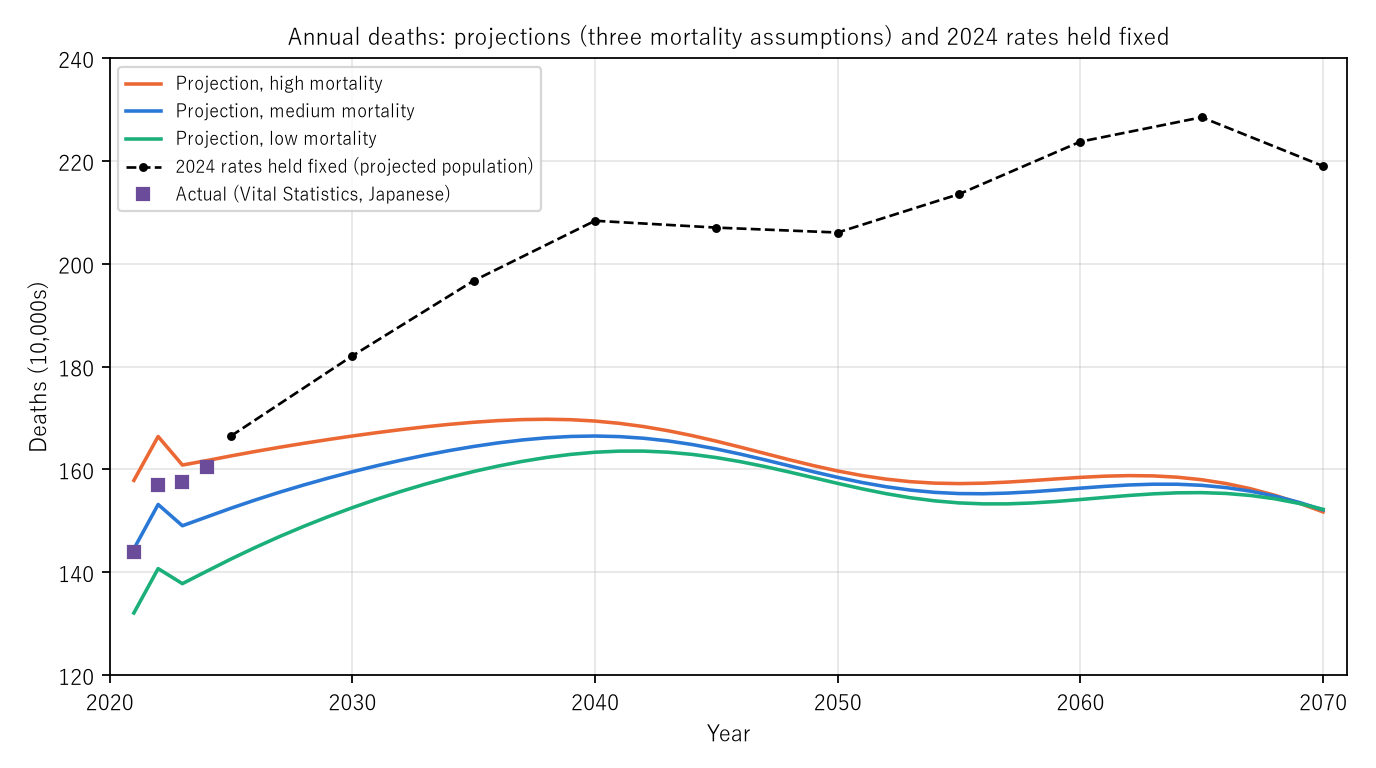
Figure 1: Annual deaths in the three projections (red high, blue medium, green low mortality), with 2024 rates held fixed (black dashed, five-yearly) and actual deaths (purple squares, 2021–2024). The projection lines peak around 2040, but the black dashed line rises until 2065. The purple squares lie close to the red line (high mortality) in 2023 and 2024.
5. Core — with rates held fixed, no peak comes
Calculation 5.1 Deaths from applying 2024 rates to the projected (medium) population, and projected deaths
| Year | 2024 rates held fixed | Projection (medium) | Difference (projection − fixed) | Projection ÷ fixed |
|---|---|---|---|---|
| 2025 | 1,665,040 | 1,524,571 | −140,469 | 0.916 |
| 2030 | 1,820,823 | 1,595,501 | −225,322 | 0.876 |
| 2035 | 1,966,980 | 1,644,713 | −322,267 | 0.836 |
| 2040 | 2,083,662 | 1,665,021 | −418,641 | 0.799 |
| 2045 | 2,070,381 | 1,639,826 | −430,555 | 0.792 |
| 2050 | 2,060,831 | 1,584,578 | −476,253 | 0.769 |
| 2055 | 2,135,452 | 1,553,101 | −582,351 | 0.727 |
| 2060 | 2,237,490 | 1,563,591 | −673,899 | 0.699 |
| 2065 | 2,284,947 | 1,569,153 | −715,794 | 0.687 |
| 2070 | 2,190,034 | 1,521,416 | −668,618 | 0.695 |
Observation 5.2: With 2024 rates held fixed, deaths in the projected population keep rising after 2040, and among the five-yearly points 2065 has the most, 2,284,947. The projection (medium) peaks in 2040 and in 2070 is 0.695 times the fixed-rate number. The projected "2040 peak" is a peak under the assumption that age-specific rates keep falling; it does not arise from the population's shape alone.
Observation 5.3: Even in 2025 the projection (medium) is 0.916 times the fixed-rate number. Since both apply to the same population, the projection can be read as assuming, already in 2025, lower rates than the actual 2024 rates.
6. Ages within 75 and over
Calculation 6.1 Projected (medium) deaths by four age groups
| Year | 0–14 | 15–64 | 65–74 | 75+ | Share 75+ |
|---|---|---|---|---|---|
| 2025 | 2,123 | 121,453 | 166,433 | 1,234,560 | 0.810 |
| 2040 | 1,411 | 91,624 | 153,549 | 1,418,438 | 0.852 |
| 2070 | 638 | 52,491 | 86,194 | 1,382,094 | 0.908 |
Calculation 6.2 Combined death rate at ages 75+ (per 1,000)
| 2025 | 2040 | 2070 | |
|---|---|---|---|
| Projection (medium), men | 67.04 | 73.73 | 71.63 |
| Projection (medium), women | 50.76 | 56.91 | 57.60 |
| 2024 rates held fixed (both sexes) | 62.51 | 79.06 | 89.66 |
Observation 6.3: The combined 75+ death rate rises from 62.51 to 89.66 even with 2024 rates held fixed. No five-year rate changes, so this rise comes only from changes in the age and sex composition within 75+ (2024 rates for men are 34.58 at 75–79, 111.98 at 85–89 and 220.97 at 90+, differing greatly by age). The rise of the projected 75+ rate (men 67.04 to 73.73) also contains this change in the shape within the age group. A rate for a broad band such as "75 and over" moves with the shape within the band.
Observation 6.4: The share of deaths at 75+ rises from 0.810 in 2025 to 0.908 in 2070. Deaths at 75+ peak in 2064 at 1,422,393, later than the overall peak (2040).
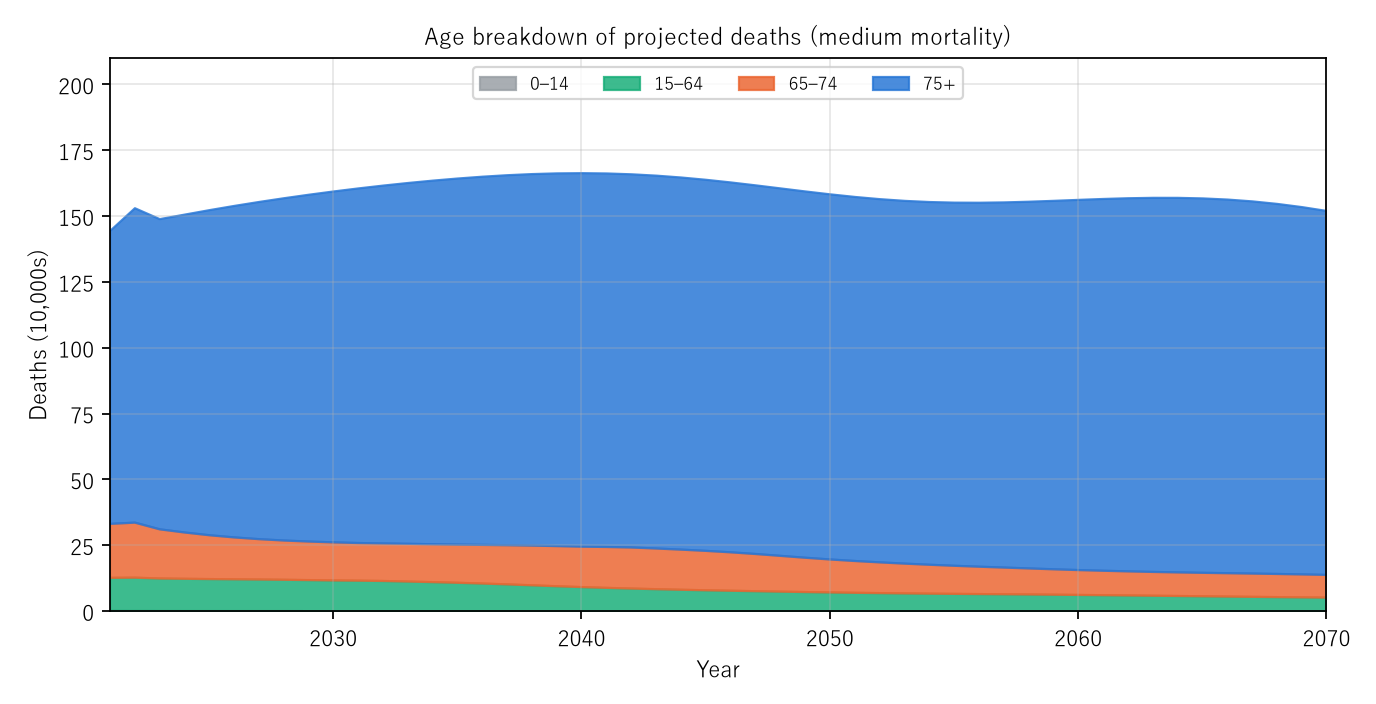
Figure 2: Annual projected (medium) deaths stacked by four age groups. Blue (75+) takes most, and the lower layers (65–74, 15–64) thin out over time.
7. Actual deaths and the projections
Calculation 7.1 Actual deaths (Vital Statistics, Japanese) and projections (Japanese population)
| Year | Actual | Medium | Actual − medium | High | Low | Closest projection |
|---|---|---|---|---|---|---|
| 2021 | 1,439,856 | 1,438,109 | +1,747 | 1,570,631 | 1,314,125 | Medium |
| 2022 | 1,569,050 | 1,523,924 | +45,126 | 1,655,400 | 1,399,878 | Medium |
| 2023 | 1,576,016 | 1,482,497 | +93,519 | 1,599,871 | 1,370,564 | High |
| 2024 | 1,605,378 | 1,499,203 | +106,175 | 1,608,113 | 1,394,325 | High |
Observation 7.2: Actual deaths exceeded the medium projection in every year from 2021 to 2024, with the gap widening from +1,747 to +106,175. In 2023 and 2024 the high-mortality projection was closest. In Section 5, too, the 2025 projection (medium) is 0.916 times the fixed-rate number, so actual rates can be read as lying on the high side of the projection's assumption. This paper says nothing about what happens next.
8. Limitations
- Projections are numbers built on assumptions. This paper does not judge them.
- "2024 rates held fixed" is a comparison calculation: the projected population includes foreign residents, while 2024 rates are for Japanese nationals.
- The Japanese-population projection tables carry no note on the period; the calendar-year note of the total-population table was followed.
- Deaths with 2024 rates held fixed were computed on five-yearly points, so the peak year can be stated only to five years.
- Why actual deaths exceed the projection is not examined.
- It is not one person's outlook.
Conclusion
In the Population Projections for Japan (2023), the peak in deaths under medium mortality was 1,665,021 in 2040. But applying 2024 rates unchanged to the projected population, deaths kept rising to 2,284,947 in 2065. The projected peak rests on the assumption that age-specific rates keep falling. The combined 75+ rate rose from age composition within the band alone, with rates held fixed. And actual deaths widened their gap from the medium projection in 2021–2024 and were closest to the high-mortality projection in 2023 and 2024.
Two things separate them — the population's age composition and the assumption that rates will fall.
When you hear "the number of deaths will peak in 2040", remember that the peak presumes age-specific rates will keep falling from now on.
Data and reproduction
| Data | National Institute of Population and Social Security Research, "Population Projections for Japan (2023)", Tables 1-8, 1-8(J), 1-12 and 1-9A and the same tables for high (Tables 4-) and low mortality (Tables 7-) (https://www.ipss.go.jp/pp-zenkoku/j/zenkoku2023/pp_zenkoku2023.asp ); Ministry of Health, Labour and Welfare, Vital Statistics 2024 (final data), Volume 1, Tables 5.4 and 5.15 (e-Stat) (both accessed 26 September 2026) |
| Terms of use | The Institute's content follows the Public Data License (Version 1.0) and e-Stat the Public Data License (Version 2.0). This paper's figures were produced by processing these and are not figures produced by the government or the Institute |
| Scope | Japan, 2021–2070 (projections), 2021–2024 (actual) |
| Verification | 検算/M021.py (--zu also writes the figures). Every number in the text is taken from 検算/M021_output.txt |
| Raw data | The 14 retrieved files and SOURCES.md (URLs, retrieval dates, SHA-256, terms of use, how the calculation is set up) in data/ |
| Figures | 図/M021_zu1, 図/M021_zu2 (png, svg, English versions) |
References
- Ministry of Health, Labour and Welfare. Vital Statistics 2024 (final data), Volume 1, Tables 5.4 and 5.15 (in Japanese). e-Stat (accessed 26 September 2026). https://www.e-stat.go.jp/
- National Institute of Population and Social Security Research. Population Projections for Japan (2023) (in Japanese; accessed 26 September 2026). https://www.ipss.go.jp/pp-zenkoku/j/zenkoku2023/pp_zenkoku2023.asp
- Yamagishi, Y. (2026). "The Death Rate Rose" Names Two Movements at Once, the Age Composition and the Age-Specific Rates [M001]. Zenodo. https://doi.org/10.5281/zenodo.22963112
Reference
Yamagishi, Y. (2026). The Peak in the Number of Deaths Comes in 2040 Only If Age-Specific Rates Are Assumed to Keep Falling [M021]. Zenodo.
DOI: 10.5281/zenodo.22968122
YOI: https://www.yamagishiyuuki.com/yoi/M021
ORCID: 0009-0006-8587-3450
PDF (English) · PDF (Japanese) · Date proof of the English PDF (OpenTimestamps .ots) · SHA256SUMS
The record page for this paper (in Japanese, with the PDFs in each language and the date proof): YOI M021. This paper is a preprint and has not been peer reviewed.