Abstract
This paper asks what the "mortality-to-incidence ratio" (MI ratio) published by the National Cancer Registry — the number of people who died of cancer in a year ÷ the number diagnosed with cancer in that year — does and does not show. It sets the 2023 MI ratios beside 5-year relative survival for the same sites (diagnosed 2018), period-analysis 5- and 10-year survival, and registration-quality indicators. It claims no new mathematical theorem and no new law.
First, the MI ratios in Table 8-A of the National Cancer Registry can be rebuilt as Vital Statistics deaths in 2023 ÷ National Cancer Registry incidence in 2023 within 0.00039 for all 54 site-by-sex groups of the 19 sites other than brain/central nervous system and malignant lymphoma. The MI ratio divides numbers from the same year taken from two different statistics (Section 3).
Second, the 2023 MI ratio (both sexes) runs from 0.068 for skin to 0.845 for pancreas; for all sites it is 0.385 (Section 4).
Third, this is the core of the paper. Dividing the MI ratio by "1 − 5-year relative survival" (diagnosed 2018), 10 of the 19 sites fall within 0.9–1.1 (pancreas 0.97, lung 1.01, oral cavity/pharynx 1.00, and others). The largest departures are prostate at 3.07 and breast at 1.48; the lowest is esophagus at 0.81. Because the MI ratio is not a share of the same people, it matches 1 − 5-year survival at some sites and not at others (Section 5).
Fourth, measuring with period-analysis survival how much death grows between 5 and 10 years, the two groups with the largest growth (prostate 1.746 times, breast 1.669 times) are also the two whose MI ratio exceeds 1 − 5-year survival the most. Across all 31 groups, however, the rank correlation is weak at 0.254, and some sites, such as leukemia, exceed it despite small growth (Section 6).
Fifth, the higher a site's MI ratio, the higher its share of cases registered from death information only (DCO) (rank correlation 0.794 across 35 site-by-sex groups). The share with pathological verification (MV) is 38.1% for liver, the only site below half (Section 7).
Sixth, what separates them is whether it is two numbers from the same year or a share of the same people. The MI ratio is not "the share of diagnosed people who die."
Scope note: This paper claims no new mathematical theorem and no new law — the MI ratio is published by the National Cancer Registry as one of its quality indicators, and its definition is known. The paper only lays out the published figures and measures their ratio to 1 − 5-year survival, the growth of death after five years, and how they line up with registration-quality indicators. This paper is a structural interpretation of the shape of numbers in published aggregate data, and is not medical advice, diagnosis, or a treatment recommendation. The author is not a physician. For decisions about individual health, consult a physician or medical institution. It is a preprint that has not been peer reviewed. It is not a forecast for one person — every figure is a population summary; in particular, the pancreas figures are not the outlook of any one person diagnosed. The survival of people who have lived some years since diagnosis is rewritten as the years pass (M006), and "5-year survival" has more than one number (M007). It does not settle a single reason for the gap between the MI ratio and 1 − 5-year survival — deaths after five years, year-to-year changes in the number of new cases, and the way cases are registered overlap, and the paper does not separate them. It does not compare regions or facilities. About the data: the National Cancer Registry and Vital Statistics on e-Stat are used under the Public Data License (Version 2.0); this paper's ratios and rank correlations were produced by processing them. Survival figures are used with the source stated as "National Cancer Center Japan, Cancer Information Service"; the values in the tables are shown unaltered and kept apart from this paper's calculations. What the paper adds: rebuilding the published MI ratio from two other statistics and confirming the match, laying out the ratio of the MI ratio to 1 − 5-year survival for 19 sites and showing where it matches and where it departs, showing both that the two largest departures coincide with the two largest period-analysis growths in death from 5 to 10 years, and that the relation is weak overall, and measuring how the MI ratio lines up with registration-quality indicators.
1. Notation and question
- MI ratio: deaths in the year ÷ new cases in the year (the "mortality/incidence ratio" of Table 8-A of the National Cancer Registry).
- 1 − 5-year survival: 1 − 5-year relative survival ÷ 100 (National Cancer Registry; people diagnosed in 2018).
- Growth from 5 to 10 years: (1 − 10-year relative survival) ÷ (1 − 5-year relative survival), built from period-analysis values (followed 2002–2006, 6 prefectures, ages 15–99). A guide to how much the share lost to cancer grows between 5 and 10 years.
- DCO: share (%) of cases registered from death information only. MV: share (%) of cases with pathological verification. Both are values of Table 8-A.
Question: what does the MI ratio show, and what does it not show?
Observation 1.1: Most of the numerator of the MI ratio (people who died in the year) were diagnosed before that year. The denominator (people diagnosed in the year) is those newly registered in that year. The two are not the same people. Still, if the number of new cases did not move from year to year and everyone who dies did so within five years of diagnosis, the MI ratio would approach 1 − 5-year survival. This paper measures, site by site, how close it actually is.
2. Survey and design
Stated honestly: the design was set after seeing the tables.
| Content | |
|---|---|
| MI ratio, DCO, MV | National Cancer Registry 2023, Table 8-A (quality indicators by site and sex) |
| Rebuilding | Vital Statistics 2024 volume 1, Table 5.24, deaths in 2023 ÷ National Cancer Registry 2023, Table 1-A, incidence |
| 5-year survival | National Cancer Registry 5-year relative survival (cases diagnosed in 2018; Cancer Information Service table) |
| Growth from 5 to 10 years | Population-based cancer registries: 10-year relative survival and conditional 5-year relative survival (followed 2002–2006, period analysis, ages 15–99) |
| Expectation and what was measured | Before the survey the expectation was "sites that depart from 1 − 5-year survival are those where many people die after five years." The two largest departures matched this, but the overall ordering was weak, and that is reported as is (Section 6) |
3. Data and checks
Calculation 3.1 The 5 retrieved files were fixed by SHA-256, and the following was checked.
- Table 1-A: the total equals male + female, or exceeds it only by people counted in the total alone (0–4 people: all sites 4, oral cavity/pharynx 1, colorectum 1, colon 1, lung 1, leukemia 1).
- Within Table 8-A: the sum of deaths recovered from the male and female MI ratios ÷ total incidence = the total MI ratio (difference below 1e-9).
- The two Cancer Information Service tables cite, as sources, the Survival 2009-2011 Report (Center for Cancer Control and Information Services, 2020) for 5-year survival and Ito et al. (2014) for the period-analysis values.
Calculation 3.2 Rebuilding the MI ratio of Table 8-A as Table 5.24 deaths in 2023 ÷ Table 1-A incidence (both sexes)
| Site | Deaths | New cases | Rebuilt ratio | Table 8-A | Difference |
|---|---|---|---|---|---|
| All sites | 382,504 | 993,469 | 0.3850 | 0.3849 | +0.00009 |
| Oral cavity/pharynx | 8,587 | 23,771 | 0.3612 | 0.3612 | +0.00004 |
| Esophagus | 10,750 | 25,889 | 0.4152 | 0.4151 | +0.00015 |
| Stomach | 38,771 | 104,864 | 0.3697 | 0.3697 | +0.00006 |
| Colorectum | 53,131 | 154,039 | 0.3449 | 0.3448 | +0.00008 |
| Colon | 37,394 | 102,436 | 0.3650 | 0.3650 | +0.00007 |
| Rectum | 15,737 | 51,603 | 0.3050 | 0.3048 | +0.00012 |
| Liver | 22,908 | 32,673 | 0.7011 | 0.7009 | +0.00024 |
| Gallbladder/bile ducts | 17,239 | 20,926 | 0.8238 | 0.8238 | +0.00005 |
| Pancreas | 40,175 | 47,540 | 0.8451 | 0.8450 | +0.00006 |
| Larynx | 791 | 4,648 | 0.1702 | 0.1700 | +0.00022 |
| Lung | 75,762 | 123,989 | 0.6110 | 0.6109 | +0.00011 |
| Skin | 1,861 | 27,353 | 0.0680 | 0.0680 | +0.00004 |
| Breast | 15,763 | 103,424 | 0.1524 | 0.1524 | +0.00004 |
| Uterus | 7,137 | 30,738 | 0.2322 | 0.2321 | +0.00007 |
| Ovary | 5,154 | 12,926 | 0.3987 | 0.3987 | +0.00008 |
| Prostate | 13,429 | 102,094 | 0.1315 | 0.1315 | +0.00006 |
| Bladder | 9,591 | 23,970 | 0.4001 | 0.4000 | +0.00008 |
| Brain/CNS | 3,178 | 5,777 | 0.5501 | 0.5449 | +0.00519 |
| Malignant lymphoma | 14,434 | 37,601 | 0.3839 | 0.3775 | +0.00636 |
| Leukemia | 9,869 | 15,165 | 0.6508 | 0.6507 | +0.00007 |
Observation 3.3: For the 54 groups of the 19 sites × sex other than brain/central nervous system and malignant lymphoma, the difference is within 0.00039. The MI ratio of Table 8-A is the ratio of same-year numbers from two different statistics: Vital Statistics deaths and National Cancer Registry incidence. For the two sites the difference is larger (largest: malignant lymphoma, male, +0.00857). Since their site ranges may not match, the paper leaves these two out of the comparison and uses the MI ratio of Table 8-A from here on.
4. The MI ratio by site
Observation 4.1: The 2023 MI ratio (both sexes) runs, across 19 sites, from 0.068 for skin to 0.845 for pancreas. For all sites it is 0.385 (male 0.398, female 0.368). The values by site are in the table of Calculation 5.1.
5. Core — the MI ratio and 1 − 5-year survival
Calculation 5.1 MI ratio by site (2023), 5-year relative survival (diagnosed 2018), MI ratio ÷ (1 − 5-year survival), DCO and MV (both sexes). Sorted by the ratio, smallest first.
| Site | MI ratio | 5-year relative survival (%) | 1 − 5-year | MI ratio ÷ (1 − 5-year) | DCO (%) | MV (%) |
|---|---|---|---|---|---|---|
| Esophagus | 0.415 | 48.8 | 0.512 | 0.81 | 0.95 | 96.2 |
| Brain/CNS | 0.545 | 37.8 | 0.622 | 0.88 | 1.78 | 71.9 |
| Larynx | 0.170 | 81.6 | 0.184 | 0.93 | 0.73 | 95.8 |
| Pancreas | 0.845 | 13.2 | 0.868 | 0.97 | 3.78 | 64.7 |
| Ovary | 0.399 | 59.9 | 0.401 | 0.99 | 1.92 | 91.4 |
| Oral cavity/pharynx | 0.361 | 63.9 | 0.361 | 1.00 | 1.28 | 95.1 |
| Lung | 0.611 | 39.3 | 0.607 | 1.01 | 3.42 | 77.1 |
| Uterus | 0.232 | 77.4 | 0.226 | 1.03 | 0.95 | 96.6 |
| Rectum | 0.305 | 70.6 | 0.294 | 1.04 | 1.15 | 95.4 |
| Liver | 0.701 | 35.2 | 0.648 | 1.08 | 4.64 | 38.1 |
| Stomach | 0.370 | 66.1 | 0.339 | 1.09 | 1.76 | 94.9 |
| Gallbladder/bile ducts | 0.824 | 24.8 | 0.752 | 1.10 | 4.36 | 69.6 |
| Skin | 0.068 | 94.0 | 0.060 | 1.14 | 0.37 | 98.3 |
| Malignant lymphoma | 0.378 | 67.5 | 0.325 | 1.16 | 1.91 | 93.4 |
| Colon | 0.365 | 69.5 | 0.305 | 1.20 | 2.13 | 91.1 |
| Bladder | 0.400 | 66.6 | 0.334 | 1.20 | 2.55 | 88.8 |
| Leukemia | 0.651 | 50.5 | 0.495 | 1.31 | 2.06 | 96.4 |
| Breast | 0.152 | 89.7 | 0.103 | 1.48 | 1.06 | 96.8 |
| Prostate | 0.131 | 95.7 | 0.043 | 3.07 | 1.03 | 90.4 |
Observation 5.2: For 10 of the 19 sites, the MI ratio ÷ (1 − 5-year survival) falls within 0.9–1.1: pancreas 0.97 (MI ratio 0.845, 1 − 5-year 0.868), lung 1.01, oral cavity/pharynx 1.00, ovary 0.99, and others. For all sites it is 1.09.
Observation 5.3: The largest departure is prostate at 3.07: its MI ratio of 0.131 is more than three times its 1 − 5-year survival of 0.043. Breast at 1.48 and leukemia at 1.31 follow. Departing below are esophagus at 0.81 and brain/central nervous system at 0.88. The MI ratio is not "the share of diagnosed people who die," so even where it is close to 1 − 5-year survival, it is not close because the two are the same quantity.
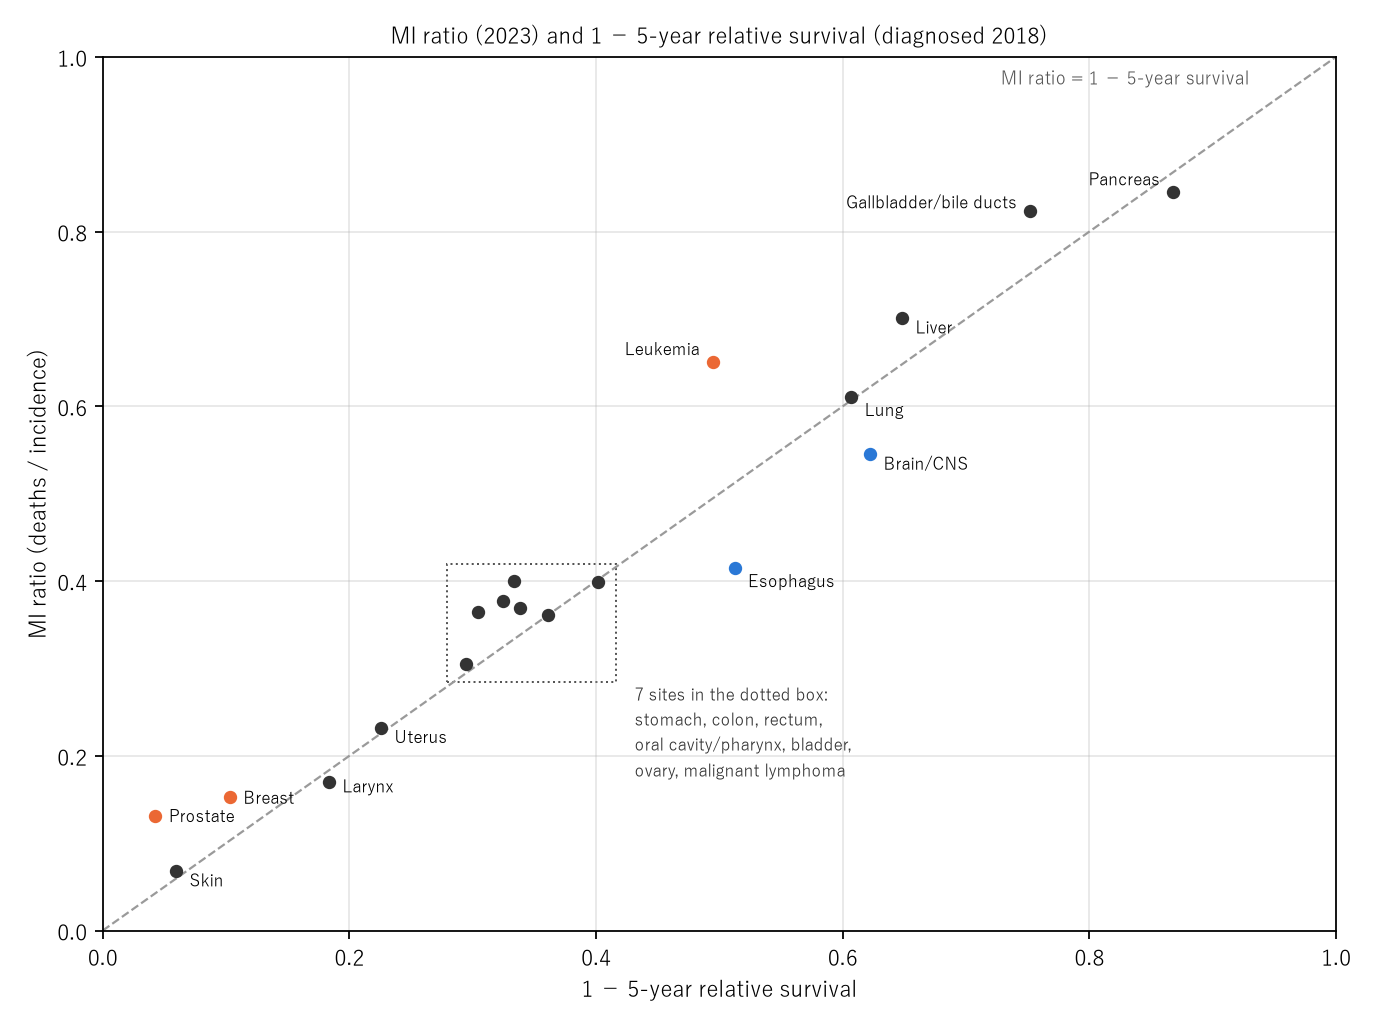
Figure 1: Horizontal: 1 − 5-year relative survival (diagnosed 2018); vertical: MI ratio (2023); the dashed line is where the two are equal. Orange: sites whose MI ratio ÷ (1 − 5-year) exceeds 1.2. Blue: sites below 0.9. The values of the 7 sites in the dotted box (stomach, colon, rectum, oral cavity/pharynx, bladder, ovary, malignant lymphoma) are in the table of Calculation 5.1.
6. Deaths after five years
Calculation 6.1 Period-analysis 5- and 10-year relative survival (followed 2002–2006, ages 15–99), growth from 5 to 10 years, and MI ratio ÷ (1 − 5-year). Sorted by growth, largest first.
| Site, sex | Period 5-year (%) | 10-year (%) | Growth from 5 to 10 years | MI ratio ÷ (1 − 5-year) |
|---|---|---|---|---|
| Prostate, M | 87.4 | 78.0 | 1.746 | 3.072 |
| Breast, F | 87.6 | 79.3 | 1.669 | 1.475 |
| Skin, M | 89.7 | 86.6 | 1.301 | 0.945 |
| Skin, F | 92.6 | 90.4 | 1.297 | 1.417 |
| Bladder, M | 79.1 | 74.6 | 1.215 | 1.228 |
| Liver, M | 25.3 | 9.6 | 1.210 | 1.074 |
| Liver, F | 23.6 | 9.1 | 1.190 | 1.098 |
| Malignant lymphoma, F | 58.1 | 50.6 | 1.179 | 1.135 |
| Oral cavity/pharynx, M | 49.7 | 41.4 | 1.165 | 0.969 |
| Oral cavity/pharynx, F | 60.0 | 53.6 | 1.160 | 1.072 |
| Ovary, F | 51.3 | 43.9 | 1.152 | 0.994 |
| Rectum, M | 65.5 | 60.8 | 1.136 | 1.023 |
| Malignant lymphoma, M | 49.6 | 43.1 | 1.129 | 1.184 |
| Esophagus, M | 32.2 | 24.0 | 1.121 | 0.797 |
| Rectum, F | 66.9 | 63.2 | 1.112 | 1.059 |
| Brain/CNS, M | 28.7 | 21.5 | 1.101 | 0.889 |
| Lung, F | 37.0 | 31.2 | 1.092 | 1.047 |
| Bladder, F | 65.9 | 62.8 | 1.091 | 1.141 |
| Esophagus, F | 37.6 | 32.4 | 1.083 | 0.870 |
| Leukemia, F | 26.5 | 20.5 | 1.082 | 1.252 |
| Colon, F | 65.3 | 62.8 | 1.072 | 1.196 |
| Colon, M | 70.9 | 68.9 | 1.069 | 1.199 |
| Leukemia, M | 25.5 | 20.5 | 1.067 | 1.357 |
| Brain/CNS, F | 29.0 | 24.4 | 1.065 | 0.856 |
| Lung, M | 22.8 | 18.1 | 1.061 | 0.990 |
| Stomach, M | 63.3 | 61.3 | 1.054 | 1.097 |
| Stomach, F | 60.3 | 58.2 | 1.053 | 1.083 |
| Gallbladder/bile ducts, M | 21.5 | 18.5 | 1.038 | 1.111 |
| Gallbladder/bile ducts, F | 17.8 | 15.5 | 1.028 | 1.081 |
| Pancreas, M | 5.9 | 4.6 | 1.014 | 0.967 |
| Pancreas, F | 5.9 | 4.8 | 1.012 | 0.980 |
Observation 6.2: The two groups with the largest growth from 5 to 10 years (prostate, male, 1.746; breast, female, 1.669) are also the two with the largest MI ratio ÷ (1 − 5-year) (3.072 and 1.475). Where many people die after five years have passed, a year's deaths include deaths of people diagnosed more than five years earlier.
Observation 6.3: Across all 31 groups, however, the rank correlation between growth and MI ratio ÷ (1 − 5-year) is weak at 0.254. Leukemia has small growth (male 1.067, female 1.082) but a large MI ratio ÷ (1 − 5-year) (1.357 and 1.252). The period-analysis values come from 6 prefectures in 2002–2006, differing in both years and areas from the MI ratio and the 5-year survival. Deaths after five years alone do not explain how the ratios depart.
7. Registration quality
Observation 7.1: The higher a site's MI ratio, the higher its share of cases registered from death information only (DCO). Across 35 site-by-sex groups, the rank correlation between MI ratio and DCO is 0.794, and between MI ratio and MV −0.710.
Observation 7.2: The share with pathological verification (MV) is lowest for liver at 38.1%, followed by pancreas 64.7%, gallbladder/bile ducts 69.6%, and brain/central nervous system 71.9%. Liver alone is below half. The paper does not go into the differences in how cases are diagnosed and registered.
8. Limitations
- It does not settle a single reason for the gap between the MI ratio and 1 − 5-year survival. Deaths after five years, year-to-year changes in new cases, and registration overlap.
- The compared figures differ in year and area. The MI ratio is 2023, the 5-year survival is for diagnoses in 2018, and the period-analysis values are for 6 prefectures in 2002–2006.
- Brain/central nervous system and malignant lymphoma were left out of the rebuilding comparison (their site ranges may not match).
- It is not a forecast for one person. It does not compare regions or facilities.
Conclusion
The 2023 MI ratio ran from 0.068 for skin to 0.845 for pancreas. It is a ratio of two numbers from the same year, not a share of the same people. Against 1 − 5-year survival, 10 of 19 sites matched, while prostate (3.07) and breast (1.48) departed widely. Those two were also the two where death keeps growing most after five years.
One thing separates them — whether it is two numbers from the same year or a share of the same people.
When reading an MI ratio, recall together that its numerator and denominator are different people diagnosed in different years, and how many people at that site die after five years have passed.
Data and reproduction
| Data | National Cancer Registry 2023, Tables 1-A and 8-A (e-Stat); Ministry of Health, Labour and Welfare, Vital Statistics 2024 (final data), Volume 1, Table 5.24 (e-Stat); two Cancer Information Service survival tables (accessed 26 September 2026) |
| Terms of use | e-Stat follows the Public Data License (Version 2.0). Survival figures are used with the source stated as "National Cancer Center Japan, Cancer Information Service," and the values in the tables are shown unaltered. This paper's ratios and rank correlations are processed figures, not figures produced by the government or the institutions that compiled them |
| Scope | Japan, 2023 (MI ratio), diagnosed 2018 (5-year survival), followed 2002–2006 (period analysis) |
| Verification | 検算/M025.py (--zu also writes the figure). Every number in the text is taken from 検算/M025_output.txt |
| Raw data | The 5 retrieved files and SOURCES.md (URLs, retrieval dates, SHA-256, terms of use, definitions and calculation) in data/ |
| Figures | 図/M025_zu1 (png, svg, English version) |
References
- Center for Cancer Control and Information Services, National Cancer Center (2020). Monitoring of Cancer Incidence in Japan - Survival 2009-2011 Report.
- Ito, Y., Miyashiro, I., Ito, H., Hosono, S., Chihara, D., Nakata-Yamada, K., et al. (2014). Long-term Survival and Conditional Survival of Cancer Patients in Japan Using Population-based Cancer Registry Data. Cancer Science. 10.1111/cas.12525
- Ministry of Health, Labour and Welfare. National Cancer Registry: Cancer Incidence 2023, Table 1-A and Table 8-A (in Japanese). e-Stat (accessed 26 September 2026). https://www.e-stat.go.jp/
- Ministry of Health, Labour and Welfare. Vital Statistics 2024 (final data), Volume 1, Table 5.24 (in Japanese). e-Stat (accessed 26 September 2026). https://www.e-stat.go.jp/
- National Cancer Center Japan, Cancer Information Service. Cancer survival data from the National Cancer Registry (cases diagnosed in 2016-2018), 5-year relative survival, cancer_survivalNCR(2016-2018).xlsx (in Japanese; accessed 26 September 2026). https://ganjoho.jp/reg_stat/statistics/data/dl/excel/cancer_survivalNCR%282016-2018%29.xlsx
- National Cancer Center Japan, Cancer Information Service. 10-year relative survival and conditional 5-year relative survival based on population-based cancer registries (followed 2002-2006, period analysis), cancer_survival_period(2002-2006).xls (in Japanese; accessed 26 September 2026). https://ganjoho.jp/reg_stat/statistics/data/dl/excel/cancer_survival_period%282002-2006%29.xls
- Yamagishi, Y. (2026). The "5-Year Survival" You Once Heard Is Rewritten by the Years You Have Lived [M006]. Zenodo. https://doi.org/10.5281/zenodo.22964113
- Yamagishi, Y. (2026). "5-Year Survival" Is One Phrase for Three Different Numbers [M007]. Zenodo. https://doi.org/10.5281/zenodo.22964570
Reference
Yamagishi, Y. (2026). The Year's Deaths Divided by Its New Cases (the MI Ratio) Is Not a Share of the Same People [M025]. Zenodo.
DOI: 10.5281/zenodo.22968532
YOI: https://www.yamagishiyuuki.com/yoi/M025
ORCID: 0009-0006-8587-3450
PDF (English) · PDF (Japanese) · Date proof of the English PDF (OpenTimestamps .ots) · SHA256SUMS
The record page for this paper (in Japanese, with the PDFs in each language and the date proof): YOI M025. This paper is a preprint and has not been peer reviewed.