Abstract
This paper asks how differences in 5-year survival between cancer sites split into "at which stage more people are found" (the stage mix) and "differences in survival within the same stage" (stage-specific survival). Using the National Cancer Registry's 5-year relative survival for cases diagnosed in 2018 (by clinical stage, both sexes), it splits the differences for people with known stage into these two effects. It claims no new mathematical theorem and no new law.
First, the average of survival at the three stages (localized, regional, distant) weighted by the three shares (this paper's calculation, "survival of people with known stage") runs from 96.1 for thyroid to 13.6 for pancreas; all sites is 68.2. Survival of people with unknown stage is not in the table; back-calculated from the overall figure it runs from 8.67 for pancreas to 113.89 for prostate. Since whether that back-calculation is right cannot be checked, the paper compares without the unknown-stage group (Sections 3 and 4).
Second, this is the core of the paper. Bladder survival is localized 81.0 (lung 81.1), regional 38.9 (lung 39.3), and distant 11.0 (lung 11.7) — nearly the same as lung at every one of the three stages (all three differences within two standard errors) — yet combined it is 69.6 versus 41.9. Of the +27.7-point difference, +28.0 points is the stage-mix effect and the stage-specific effect is −0.3 points. 66.8% of bladder cases are found localized against 31.3% for lung, and 5.3% versus 38.8% distant (Section 5).
Third, in 10 of the 171 pairs of 19 sites, the site with lower survival at every one of the three stages is higher when combined (bladder and lung, larynx and colon, skin and breast, and others). This is a cancer-survival example of the pattern (Simpson's reversal) that Paper 183 of the mathematical-physics series showed as "One Table, Two Correct Answers" (Section 5).
Fourth, splitting the difference from all sites (68.2), the stage-mix effect is the larger one for 8 of the 19 sites (bladder, larynx, skin, corpus uteri, and others), and the stage-specific effect is larger for the rest. For pancreas, of a −54.5-point difference, the stage-specific effect is −36.6 points and the stage-mix effect −17.9 points; even localized it is 42.4% (all sites localized: 91.2%) (Section 6).
Fifth, the spread of the differences over 19 sites (variance 515.5) splits into the variance of the stage-mix effect 94.7, the variance of the stage-specific effect 275.7, and twice their covariance 145.1. The two effects point the same way at 12 sites and opposite ways at 7 (Section 6).
Sixth, what separates them is the stage mix and the survival within each stage. A site's 5-year survival carries not only the nature of that cancer (how fast it progresses, how treatable it is) but also at which stage more people are found.
Scope note: This paper claims no new mathematical theorem and no new law — splitting an overall rate into composition and within-stratum rates, and the possibility that the within-stratum and overall directions reverse (Simpson's reversal), are known. The paper only lays out the figures of a published table, splits the differences in two, and counts the reversed pairs. This paper is a structural interpretation of the shape of numbers in published aggregate data, and is not medical advice, diagnosis, or a treatment recommendation. The author is not a physician. For decisions about individual health, consult a physician or medical institution. It is a preprint that has not been peer reviewed. It is not a forecast for one person — every figure aggregates people diagnosed in 2018. It does not go into why the stage mix differs by site (how cases are found, symptoms, screening, and so on) and does not discuss the effectiveness of screening. It does not read the differences as differences in the nature of the cancers (how fast they progress, how treatable they are) — stage-specific survival differences contain the spread within a stage, age, treatment, and much else, which the paper does not separate. It does not compare regions or facilities. About the data: used with the source stated as "National Cancer Center Japan, Cancer Information Service"; the values in the table are shown unaltered and kept apart from this paper's calculations (weighted averages, splitting of differences and of variance). All sites with known stage are included in the table. What the paper adds: splitting the differences between sites into stage mix and stage-specific survival and laying them out for 19 sites, counting from 171 pairs those where the site lower at every stage is higher combined, and showing beside the standard errors that nearly all of the bladder–lung difference comes from the stage mix, and comparing without the unknown-stage group because the back-calculated survival of that group exceeds 100 at one site.
1. Notation and question
- Stage: clinical stage, localized (confined to the primary organ), regional (regional lymph-node metastasis or invasion of adjacent organs), distant (distant metastasis), as in the table's notes. The share with unknown stage is 100% minus the sum of the three (table note).
- Survival of people with known stage (this paper's calculation): the average of the three stages' 5-year relative survival weighted by the three shares (divided by the sum of the shares).
- Splitting a difference: difference between two sites = stage-mix effect Σ (difference in share × average survival) + stage-specific effect Σ (average share × difference in survival) (Kitagawa's decomposition; the two add up exactly to the difference). Shares are converted to shares within the three stages before use.
- Reversal: site A has higher survival of people with known stage than B, yet A's survival is lower than B's at every one of the three stages.
Question: how do differences in 5-year survival between sites split into stage mix and stage-specific survival?
Observation 1.1: M007 showed that "5-year survival" refers to three different numbers. This paper opens one of them (the National Cancer Registry's relative survival) by stage. An overall rate names two things at once: the composition of strata and the rate within each stratum — the survival version of the pattern M001 found for death rates.
2. Survey and design
Stated honestly: the design was set after seeing the table.
| Content | |
|---|---|
| By stage | Sheet "最新データ(進行度別)" of the Cancer Information Service table: numbers of people, shares, 5-year relative survival, and standard errors for localized, regional, and distant, and the share of unknown stage, for cases diagnosed in 2018 (both sexes). 22 rows (including all sites and combined rows) |
| By site | Sheet "最新データ(性別)" of the same table: 5-year relative survival and number of people by site for cases diagnosed in 2018 (both sexes) |
| Sites counted | 19 sites, excluding the combined rows (all sites, colorectum, uterus). All sites is used as the comparison |
| Expectation and what was measured | Before the survey the expectation was "reversed pairs are few and none stand out." Counting found 10, and for bladder and lung the stage-by-stage differences were all under 1 point |
3. Data and checks
Calculation 3.1 The retrieved file was fixed by SHA-256, and the following was checked.
- Three shares + share of unknown stage = 100 (all 22 rows). The note says "*4 限局、領域、および遠隔の合計を100%から引いて算出" (calculated by subtracting the sum of localized, regional, and distant from 100%).
- Sum of the three stages' numbers ÷ the site's number × 100 = sum of the three shares (within 1.4e-14 for the 21 rows other than breast).
- Only breast disagrees (90.203 against 90.801). The site's number, 89,682, is both sexes and includes 590 men; the sum of the three stages ÷ (89,682 − 590) × 100 matches the sum of the three shares.
- The table cites, as its source, the Survival 2009-2011 Report (Center for Cancer Control and Information Services, 2020).
Observation 3.2: Survival of people with unknown stage is not in the table. Back-calculating by subtracting the three stages' part from the overall 5-year relative survival gives values from pancreas 8.67 and gallbladder/bile ducts 12.41 to skin 88.47 and prostate 113.89. Only prostate exceeds 100. Relative survival is a comparison with the general population and can exceed 100 (M007), but whether this back-calculation is right cannot be checked. The paper compares sites without the unknown-stage group, using the weighted average of people with known stage.
4. Stage mix and stage-specific survival by site
Calculation 4.1 Numbers of people, shares (%), and 5-year relative survival (%) by stage, share of unknown stage, and survival of people with known stage (this paper's calculation), for cases diagnosed in 2018 (both sexes). Sorted by survival of people with known stage, highest first.
| Site | Localized n | Localized share | Localized survival | Regional n | Regional share | Regional survival | Distant n | Distant share | Distant survival | Unknown share | Known-stage survival |
|---|---|---|---|---|---|---|---|---|---|---|---|
| Thyroid | 6,508 | 39.1 | 99.8 | 7,178 | 43.1 | 97.4 | 867 | 5.2 | 56.7 | 12.6 | 96.1 |
| Skin | 17,841 | 84.3 | 98.2 | 1,847 | 8.7 | 68.3 | 266 | 1.3 | 19.8 | 5.7 | 94.4 |
| Prostate | 49,690 | 59.9 | 100.0 | 14,028 | 16.9 | 98.7 | 10,423 | 12.6 | 55.9 | 10.6 | 93.6 |
| Breast | 52,296 | 58.7 | 99.1 | 22,778 | 25.6 | 90.0 | 5,822 | 6.5 | 42.5 | 9.2 | 92.5 |
| Larynx | 3,103 | 70.7 | 94.5 | 936 | 21.3 | 54.3 | 94 | 2.1 | 13.6 | 5.8 | 83.6 |
| Corpus uteri | 10,603 | 67.0 | 94.9 | 2,857 | 18.0 | 70.4 | 1,519 | 9.6 | 21.3 | 5.4 | 82.8 |
| Uterus | 14,838 | 55.9 | 94.9 | 7,169 | 27.0 | 68.1 | 2,660 | 10.0 | 20.7 | 7.1 | 79.1 |
| Cervix | 4,206 | 40.4 | 95.4 | 4,288 | 41.1 | 66.8 | 1,111 | 10.7 | 20.4 | 7.8 | 73.9 |
| Kidney/urinary tract | 14,350 | 55.7 | 93.5 | 4,986 | 19.4 | 60.2 | 3,714 | 14.4 | 15.3 | 10.5 | 73.7 |
| Rectum | 20,675 | 45.3 | 93.2 | 13,431 | 29.4 | 74.5 | 8,354 | 18.3 | 21.2 | 7.0 | 73.1 |
| Colorectum | 62,371 | 45.6 | 94.3 | 38,814 | 28.4 | 74.5 | 26,087 | 19.1 | 17.6 | 6.9 | 72.5 |
| Colon | 41,696 | 45.8 | 94.9 | 25,383 | 27.9 | 74.5 | 17,733 | 19.5 | 16.0 | 6.9 | 72.3 |
| Bladder | 13,609 | 66.8 | 81.0 | 2,942 | 14.4 | 38.9 | 1,089 | 5.3 | 11.0 | 13.4 | 69.6 |
| Stomach | 63,906 | 57.3 | 94.0 | 20,298 | 18.2 | 50.4 | 20,233 | 18.1 | 7.0 | 6.4 | 68.7 |
| All sites | 401,639 | 46.0 | 91.2 | 200,900 | 23.0 | 62.2 | 165,025 | 18.9 | 19.4 | 12.1 | 68.2 |
| Oral cavity/pharynx | 6,548 | 35.2 | 86.9 | 9,808 | 52.7 | 56.3 | 854 | 4.6 | 13.5 | 7.6 | 65.8 |
| Ovary | 2,051 | 21.4 | 92.6 | 4,720 | 49.2 | 63.6 | 1,701 | 17.7 | 26.5 | 11.8 | 63.1 |
| Esophagus | 8,027 | 38.3 | 83.3 | 7,694 | 36.7 | 35.5 | 3,906 | 18.6 | 10.9 | 6.4 | 50.2 |
| Lung | 33,188 | 31.3 | 81.1 | 20,544 | 19.4 | 39.3 | 41,134 | 38.8 | 11.7 | 10.4 | 41.9 |
| Liver | 19,673 | 59.2 | 52.5 | 3,801 | 11.4 | 11.0 | 4,265 | 12.8 | 2.9 | 16.5 | 39.2 |
| Gallbladder/bile ducts | 3,201 | 16.3 | 49.7 | 8,470 | 43.2 | 32.4 | 4,957 | 25.3 | 3.0 | 15.1 | 27.0 |
| Pancreas | 6,011 | 15.9 | 42.4 | 10,976 | 29.1 | 15.9 | 17,458 | 46.3 | 2.2 | 8.7 | 13.6 |
Observation 4.2: Survival of people with known stage runs from thyroid 96.1 to pancreas 13.6. The distant share is high for pancreas (46.3%) and lung (38.8%) and low for skin (1.3%), oral cavity/pharynx (4.6%), and bladder (5.3%). Localized survival also runs from thyroid 99.8 and prostate 100.0 down to pancreas 42.4 and gallbladder/bile ducts 49.7.
5. Core — lower at every stage, higher combined
Calculation 5.1 The 10 of the 171 pairs of 19 sites where the site with lower survival at every one of the three stages is higher in survival of people with known stage. Sorted by the difference, largest first.
| Pair (higher > lower) | Higher | Lower | Localized | Regional | Distant | Difference | Stage-mix effect | Stage-specific effect |
|---|---|---|---|---|---|---|---|---|
| Bladder > Lung | 69.6 | 41.9 | 81.0 / 81.1 | 38.9 / 39.3 | 11.0 / 11.7 | +27.7 | +28.0 | −0.3 |
| Larynx > Colon | 83.6 | 72.3 | 94.5 / 94.9 | 54.3 / 74.5 | 13.6 / 16.0 | +11.3 | +17.1 | −5.8 |
| Larynx > Cervix | 83.6 | 73.9 | 94.5 / 95.4 | 54.3 / 66.8 | 13.6 / 20.4 | +9.7 | +14.8 | −5.2 |
| Bladder > Ovary | 69.6 | 63.1 | 81.0 / 92.6 | 38.9 / 63.6 | 11.0 / 26.5 | +6.5 | +23.3 | −16.8 |
| Bladder > Oral cavity/pharynx | 69.6 | 65.8 | 81.0 / 86.9 | 38.9 / 56.3 | 11.0 / 13.5 | +3.8 | +13.8 | −10.0 |
| Oral cavity/pharynx > Ovary | 65.8 | 63.1 | 86.9 / 92.6 | 56.3 / 63.6 | 13.5 / 26.5 | +2.7 | +10.2 | −7.5 |
| Skin > Breast | 94.4 | 92.5 | 98.2 / 99.1 | 68.3 / 90.0 | 19.8 / 42.5 | +1.9 | +7.7 | −5.8 |
| Kidney/urinary tract > Colon | 73.7 | 72.3 | 93.5 / 94.9 | 60.2 / 74.5 | 15.3 / 16.0 | +1.4 | +6.0 | −4.6 |
| Skin > Prostate | 94.4 | 93.6 | 98.2 / 100.0 | 68.3 / 98.7 | 19.8 / 55.9 | +0.8 | +9.3 | −8.5 |
| Larynx > Corpus uteri | 83.6 | 82.8 | 94.5 / 94.9 | 54.3 / 70.4 | 13.6 / 21.3 | +0.8 | +4.9 | −4.1 |
Observation 5.2: For bladder and lung, the stage-specific differences are −0.08 localized, −0.40 regional, and −0.70 distant points, all under 1 point. Divided by the square root of the sum of the two squared standard errors they are −0.13, −0.36, and −0.65, all within two — within the same stage, no difference can be said to exist. Yet survival of people with known stage is 69.6 against 41.9, and of the +27.7-point difference, +28.0 points is the stage-mix effect. 66.8% of bladder cases are found localized against 31.3% for lung; distant, 5.3% against 38.8%.
Observation 5.3: In the other 9 pairs, too, the stage-mix effect is positive and the stage-specific effect negative (larynx and colon: +17.1 and −5.8, and so on). A site's higher overall survival does not mean higher survival within the same stage. Paper 183 of the mathematical-physics series showed, as "One Table, Two Correct Answers," the pattern in which the within-stratum answer and the overall answer are reversed. Bladder and lung are a cancer-survival example of that pattern. Which answer is "right" depends on what is being asked.
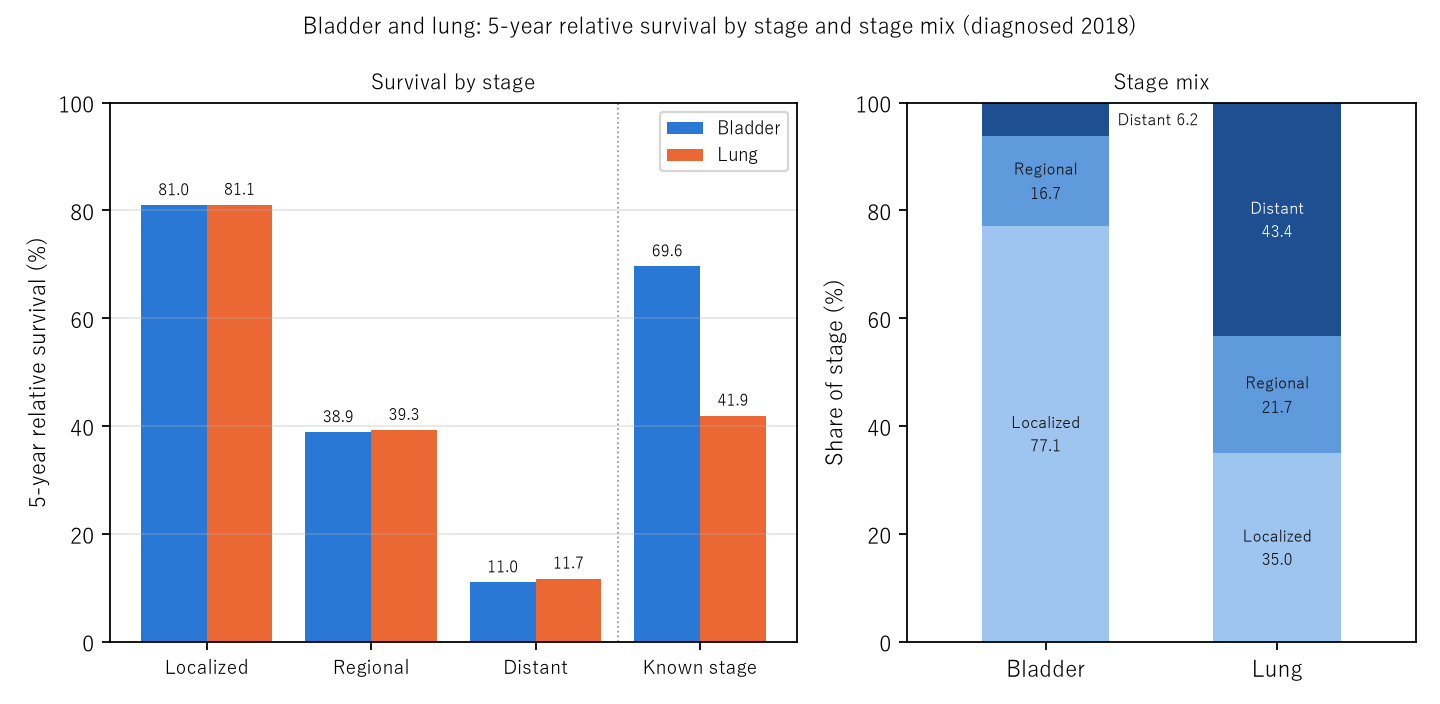
Figure 1: Left: 5-year relative survival by stage for bladder (blue) and lung (orange), and survival of people with known stage (this paper's calculation). Right: shares of localized, regional, and distant among people with known stage.
6. Compared with all sites
Calculation 6.1 The difference between each site's survival of people with known stage and all sites (68.2), split into stage-mix and stage-specific effects (points). Sorted by the difference, smallest first.
| Site | Known-stage survival | Difference from all sites | Stage-mix effect | Stage-specific effect |
|---|---|---|---|---|
| Pancreas | 13.6 | −54.5 | −17.9 | −36.6 |
| Gallbladder/bile ducts | 27.0 | −41.2 | −10.7 | −30.5 |
| Liver | 39.2 | −29.0 | +8.1 | −37.1 |
| Lung | 41.9 | −26.2 | −13.8 | −12.4 |
| Esophagus | 50.2 | −18.0 | −3.8 | −14.2 |
| Ovary | 63.1 | −5.0 | −7.6 | +2.6 |
| Oral cavity/pharynx | 65.8 | −2.3 | +2.8 | −5.2 |
| Stomach | 68.7 | +0.5 | +4.1 | −3.6 |
| Bladder | 69.6 | +1.5 | +14.2 | −12.8 |
| Colon | 72.3 | +4.1 | −0.5 | +4.6 |
| Rectum | 73.1 | +4.9 | +0.0 | +4.9 |
| Kidney/urinary tract | 73.7 | +5.5 | +5.5 | +0.1 |
| Cervix | 73.9 | +5.8 | +2.0 | +3.8 |
| Corpus uteri | 82.8 | +14.6 | +10.1 | +4.5 |
| Larynx | 83.6 | +15.4 | +15.9 | −0.5 |
| Breast | 92.5 | +24.4 | +8.8 | +15.5 |
| Prostate | 93.6 | +25.4 | +5.4 | +20.0 |
| Skin | 94.4 | +26.2 | +20.1 | +6.1 |
| Thyroid | 96.1 | +27.9 | +5.3 | +22.6 |
Observation 6.2: The stage-mix effect is the larger one for 8 of the 19 sites (stomach, larynx, lung, skin, corpus uteri, ovary, bladder, kidney/urinary tract); for the other 11 the stage-specific effect is larger. The two effects point the same way at 12 sites and opposite ways at 7. The variance of the differences over 19 sites, 515.5, splits into the variance of the stage-mix effect 94.7, the variance of the stage-specific effect 275.7, and twice the covariance 145.1.
Observation 6.3: For pancreas, of a −54.5-point difference from all sites, the stage-specific effect is −36.6 points and the stage-mix effect −17.9 points. That many cases are found distant (46.3%; all sites 18.9%) matters, but larger still is the stage-specific difference: 42.4% even when localized (all sites localized 91.2%). Liver has a positive stage-mix effect of +8.1 points (localized share 59.2%) yet a stage-specific effect of −37.1 points.
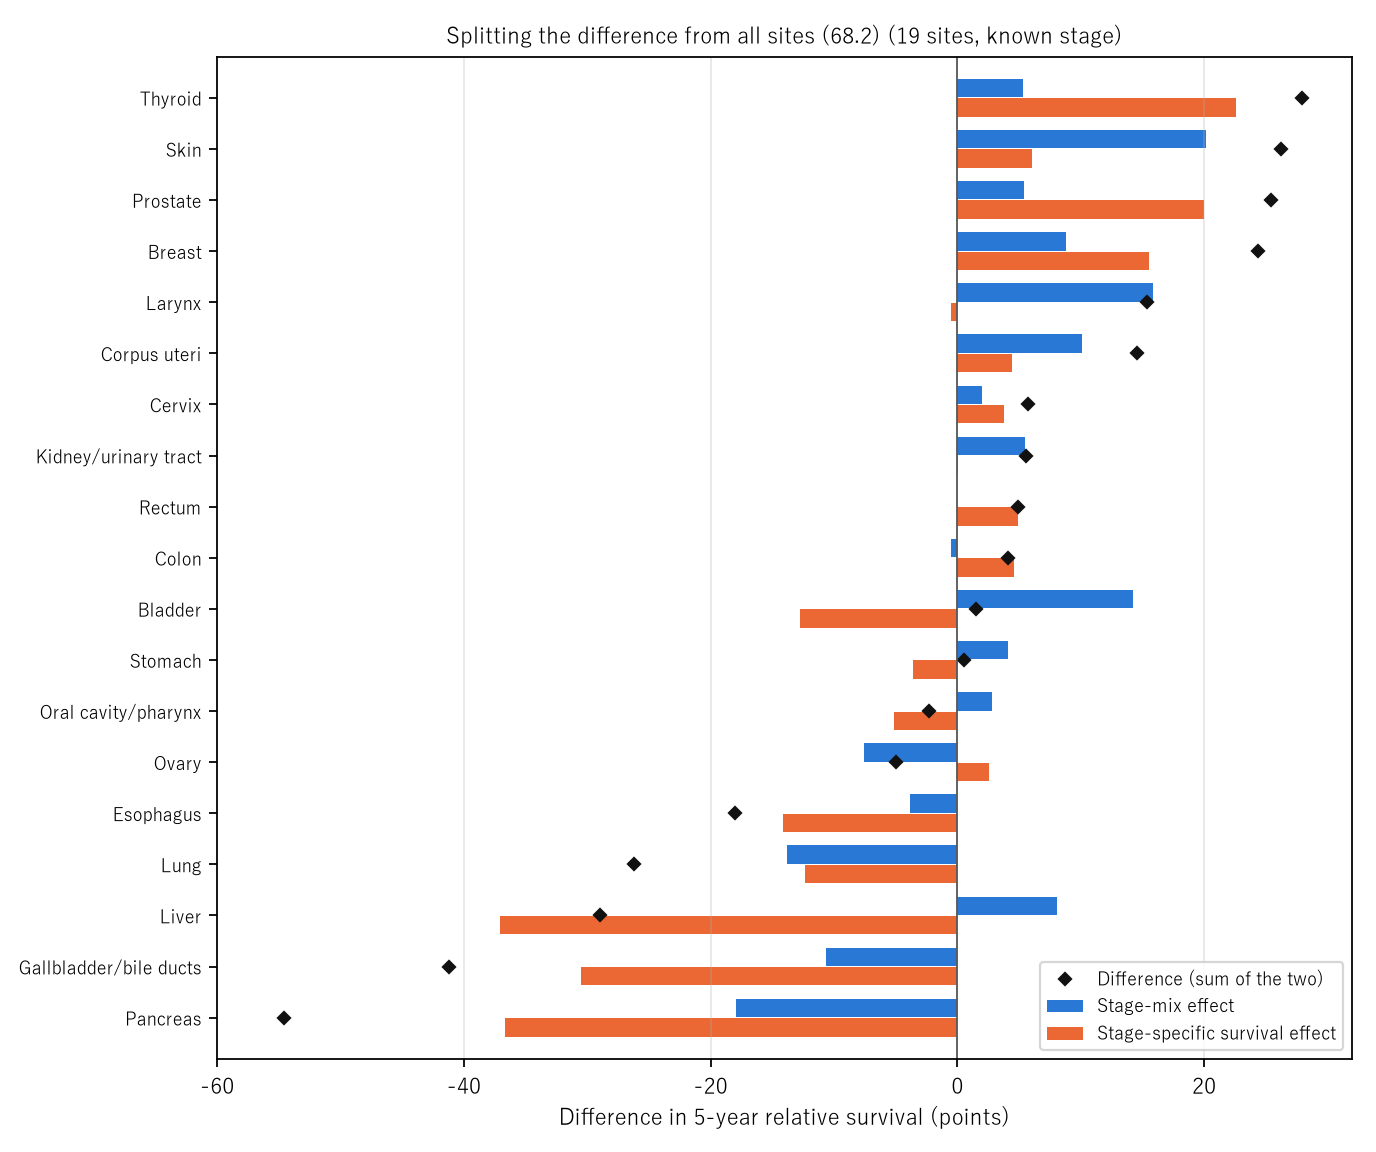
Figure 2: The difference (◆) between each site's survival of people with known stage and all sites (68.2), split into the stage-mix effect (blue) and the stage-specific survival effect (orange).
7. Limitations
- People with unknown stage are not included. Their share is 5.4–16.5%, and their survival is not in the table.
- Only both sexes combined were examined. Stage-specific values are published only for both sexes combined.
- Stage is three coarse categories. Spread within a category, age, and treatment are not separated.
- Why the stage mix differs by site (how cases are found, and so on) is not examined. The effectiveness of screening is not discussed.
- It is not a forecast for one person. It does not compare regions or facilities.
Conclusion
Bladder had nearly the same survival as lung at each of localized, regional, and distant, yet combined over people with known stage it was 69.6 against 41.9. Almost all of the difference came from at which stage more people are found. The same reversal occurred in 10 of the 171 pairs of 19 sites. Pancreas, by contrast, differed more within stages than in stage mix, at 42.4% even when localized.
Two things separate them — the stage mix and the survival within each stage.
When comparing the 5-year survival of cancer sites, recall together whether a difference is between the same stages or between the stages at which cases are found.
Data and reproduction
| Data | Table of 5-year relative survival by site based on the National Cancer Registry (cases diagnosed in 2018, by stage and by site, both sexes) (Cancer Information Service, retrieved 25 September 2026) |
| Terms of use | Used with the source stated as "National Cancer Center Japan, Cancer Information Service." The values in the table are shown unaltered and kept apart from this paper's calculations (weighted averages, splitting of differences and of variance) |
| Scope | Japan, cases diagnosed in 2018 |
| Verification | 検算/M026.py (--zu also writes the figures). Every number in the text is taken from 検算/M026_output.txt |
| Raw data | The retrieved file and SOURCES.md (URL, retrieval date, SHA-256, terms of use, copies of the file's notes, definitions and calculation) in data/ |
| Figures | 図/M026_zu1, 図/M026_zu2 (png, svg, English versions) |
References
- Center for Cancer Control and Information Services, National Cancer Center (2020). Monitoring of Cancer Incidence in Japan - Survival 2009-2011 Report.
- National Cancer Center Japan, Cancer Information Service. Cancer survival data from the National Cancer Registry (cases diagnosed in 2016-2018), 5-year relative survival, cancer_survivalNCR(2016-2018).xlsx (in Japanese; retrieved 25 September 2026). https://ganjoho.jp/reg_stat/statistics/data/dl/excel/cancer_survivalNCR%282016-2018%29.xlsx
- Yamagishi, Y. (2026). One Table, Two Correct Answers [Paper 183]. Zenodo. 10.5281/zenodo.22104230
- Yamagishi, Y. (2026). "The Death Rate Rose" Names Two Movements at Once, the Age Composition and the Age-Specific Rates [M001]. Zenodo. https://doi.org/10.5281/zenodo.22963112
- Yamagishi, Y. (2026). "5-Year Survival" Is One Phrase for Three Different Numbers [M007]. Zenodo. https://doi.org/10.5281/zenodo.22964570
Reference
Yamagishi, Y. (2026). Differences in 5-Year Survival Between Sites Split into Stage Mix and Stage-Specific Survival [M026]. Zenodo.
DOI: 10.5281/zenodo.22968675
YOI: https://www.yamagishiyuuki.com/yoi/M026
ORCID: 0009-0006-8587-3450
PDF (English) · PDF (Japanese) · Date proof of the English PDF (OpenTimestamps .ots) · SHA256SUMS
The record page for this paper (in Japanese, with the PDFs in each language and the date proof): YOI M026. This paper is a preprint and has not been peer reviewed.