Abstract
This paper asks how, when the number of cancer deaths rose while the age-adjusted death rate fell, the gap between the two differs by site. It compares 1995 and 2024 using Vital Statistics tables of deaths by site (Table 5.24), death rates by age (Table 5.25), and age-adjusted death rates (Table 5.26). It applies to each cancer site the split that M001 showed for all deaths. It claims no new mathematical theorem and no new law.
First, cancer deaths rose from 159,623 to 221,786 for men (1.389 times) and from 103,399 to 162,325 for women (1.570 times). Over the same years, the age-adjusted death rate (per 100,000, 2015 model population) fell from 537.7 to 372.6 for men (0.693 times) and from 244.6 to 193.0 for women (0.789 times). The population went to 0.959 times for men and 0.975 times for women. The ratio of deaths splits exactly into the population ratio × the age-adjusted rate ratio × the push from the age composition (2.090 times for men, 2.040 times for women) (Section 4).
Second, splitting the change in deaths into three, the men's +62,162 is population size −7,937, age composition +151,265, and age-specific rates −81,166. The women's +58,920 is −3,366, +93,354, and −31,069. The age-composition effect is 2.433 times (men) and 1.584 times (women) the net increase (Section 4).
Third, this is the core of the paper. The 36 site-by-sex groups split into 6 where both deaths and rate fell (stomach, liver, and larynx, male and female), 21 where deaths rose and the rate fell, and 9 where both rose (pancreas, breast, malignant lymphoma, and others); no group had deaths fall while the rate rose. Among the 24 groups whose age-adjusted rate is 5 or more in both years, the push from the age composition ranges from 1.433 times for breast to 2.918 times for prostate (median 2.128 times). For prostate, the age-adjusted rate fell to 0.904 times, yet deaths went to 2.532 times (Section 5).
Fourth, splitting the change in deaths into three for the 16 groups with age-specific rates, only pancreas (male and female) and breast had age-specific rates pushing the count up. Deaths fell only for stomach and liver, male and female, and in each the effect of the age-specific rates was larger than that of the age composition (Section 6).
Fifth, the push is larger for sites whose deaths lean more toward old age. Across the 16 groups, its rank correlation with the share of 1995 deaths at 75 and over is +0.744, and with the slope at which the rate rises with age over 40–84 is +0.715. Breast, with the smallest push, also has the smallest share at 75 and over (0.161) and the smallest slope (doubling every 59.7 years) of the 16 groups (Section 6).
Sixth, what separates them is the age composition and the age-specific rates, and the age shape of each site. The same ageing of the population pushes the count up by different amounts at different sites.
Scope note: This paper claims no new mathematical theorem and no new law — age-adjusted death rates, and the method of splitting a difference in deaths into age composition and age-specific rates (Kitagawa's decomposition), are known. The paper only lays out the ratios of deaths and rates from the published tables, applies the split to each site, and measures the size and direction of the differences. This paper is a structural interpretation of the shape of numbers in published aggregate data, and is not medical advice, diagnosis, or a treatment recommendation. The author is not a physician. For decisions about individual health, consult a physician or medical institution. It is a preprint that has not been peer reviewed. It is not a forecast for one person — every figure is a national aggregate. It does not go into why the age-specific rates moved (prevention, diagnosis, treatment, changes in risk factors, and so on). The "push from the age composition" is measured as the gap between the crude rate and the rate age-adjusted to the 2015 model population; a different standard population would move the values a little (M001 measured that movement for all deaths). It does not compare regions or facilities. Cells with fewer than 10 deaths are not shown (none among the cells shown). About the data: e-Stat Vital Statistics are used under the Public Data License (Version 2.0); this paper's ratios, populations, and three-way splits were produced by processing them. Source: Ministry of Health, Labour and Welfare, Vital Statistics. What the paper adds: sorting the 36 cancer groups by the directions of their ratio of deaths and ratio of age-adjusted rates, showing that the push from the age composition ranges from 1.433 to 2.918 times by site, splitting the change in deaths into three for the 16 groups with age-specific rates and showing that the size of the push lines up with the age shape of each site, and rebuilding the deaths and age-adjusted rates from the age-specific rates and confirming that they match the tables.
1. Notation and question
- Crude death rate: deaths from the site ÷ population × 100,000.
- Age-adjusted death rate: the average of age-specific rates weighted by the age composition of a fixed standard population (the 2015 model population; values of Table 5.26).
- Push from the age composition: the ratio of crude rates ÷ the ratio of age-adjusted rates. It shows how much more the crude rate moved than the age-adjusted rate because the population's age composition moved.
- Identity: ratio of deaths = population ratio × ratio of age-adjusted rates × push from the age composition.
- Three-way split: the difference in deaths = population × Σ (age composition × age-specific rate) is split into population size, age composition, and age-specific rates, using the averages of the two years as weights (the three add up exactly to the difference).
Question: when cancer deaths rose and the age-adjusted death rate fell, how does the gap differ by site? What does the difference line up with?
Observation 1.1: M001 showed for all deaths that "the death rate rose" names two movements at once: the age composition and the age-specific rates. The same happens for cancer, but since each site has its own age shape, the same ageing should push by different amounts. This paper counts that.
2. Survey and design
Stated honestly: the design was set after seeing the tables.
| Content | |
|---|---|
| Deaths and rates | Table 5.24: deaths and death rates by site (short list of causes) × sex × year. Table 5.26: age-adjusted death rates for the same sites (2015 model population) |
| Age-specific rates | Table 5.25: death rates by five-year age group for stomach, rectum, liver, pancreas, lung, leukemia, and colorectum (male and female) and breast and uterus (female). Prostate, bladder, and others are not included |
| Population by age | Deaths ÷ death rate × 100,000 from "総数" (all causes) of Table 5.15 (as in M019) |
| Years compared | 1995 and 2024. Uterus up to 1994 includes the placenta (table note), so the comparison starts in 1995, when the definition is aligned |
| Age groups | 19 groups: 0–4 to 85–89 and 90 and over. In 1995 the rate for 90–94 is the figure for 90 and over (table note) |
3. Data and checks
Calculation 3.1 The 5 retrieved files were fixed by SHA-256, and the following was checked.
- The note to Table 5.24 says uterus up to 1994 includes the placenta (the reason for starting in 1995). The note to Table 5.26 says the standard population is the 2015 (Heisei 27) model population.
- Table 5.24: male + female = total (1995 and 2024, all sites), and colon + rectum = colorectum.
- The population (deaths ÷ death rate × 100,000) agrees whichever site of the same sex it is derived from, within the width explained by the rounding of the rates (both sexes, 1995 and 2024).
- Deaths from malignant neoplasms in Table 5.15 = Table 5.24 (both sexes, 1995 and 2024).
- The sum of age-specific rates in Table 5.25 × population by age matches the deaths in Table 5.24 within the width of the rounding of the rates and the deaths of unknown age (all 32, 16 groups × 2 years).
- The 2024 age-adjusted death rates rebuilt from Table 5.25 and the 2015 model population match Table 5.26 within 0.060 (16 groups; within the 0.1 width of the two tables' rounding).
- Ratio of deaths = population ratio × ratio of age-adjusted rates × push from the age composition holds for 40 groups within computational error (4.0e-16).
Observation 3.2: Misreading the 1995 group aged 90 and over makes the rebuilt deaths come out below the table. In 1995 the "rate" for 90–94 is the figure for 90 and over, while the "deaths" are split into the rows 90–94, 95–99, and 100 and over. The population aged 90 and over was obtained by dividing the sum of the three death counts by the rate for 90 and over. At first it was divided using only the deaths aged 90–94; running that reading as a control, 12 of the 32 fail to match the table (which also confirms that the check catches this misreading).
4. All cancers
Calculation 4.1 All cancers (1995 to 2024)
| Male | Female | |
|---|---|---|
| Deaths | 159,623 to 221,786 (1.389 times) | 103,399 to 162,325 (1.570 times) |
| Age-adjusted death rate (per 100,000) | 537.7 to 372.6 (0.693 times) | 244.6 to 193.0 (0.789 times) |
| Population (thousands) | 60,925 to 58,457 (0.959 times) | 63,396 to 61,838 (0.975 times) |
| Push from the age composition | 2.090 times | 2.040 times |
Calculation 4.2 Splitting the change in deaths into three (deaths rebuilt from age-specific rates)
| Site, sex | 1995 | 2024 | Difference | Population size | Age composition | Age-specific rates |
|---|---|---|---|---|---|---|
| All cancers, M | 159,617 | 221,779 | +62,162 | −7,937 | +151,265 | −81,166 |
| All cancers, F | 103,404 | 162,324 | +58,920 | −3,366 | +93,354 | −31,069 |
| Stomach, F | 18,060 | 13,147 | −4,914 | −393 | +13,585 | −18,105 |
| Rectum, F | 4,098 | 6,129 | +2,031 | −129 | +3,535 | −1,374 |
| Liver, F | 8,932 | 7,321 | −1,610 | −205 | +6,132 | −7,537 |
| Pancreas, F | 7,052 | 20,867 | +13,815 | −355 | +9,515 | +4,655 |
| Lung, F | 12,348 | 23,238 | +10,890 | −451 | +13,120 | −1,779 |
| Breast, F | 7,762 | 15,864 | +8,103 | −300 | +4,309 | +4,094 |
| Uterus, F | 4,863 | 7,116 | +2,253 | −152 | +3,167 | −762 |
| Leukemia, F | 2,485 | 3,899 | +1,414 | −81 | +1,671 | −176 |
| Colorectum, F | 13,955 | 25,588 | +11,633 | −501 | +14,840 | −2,706 |
| Stomach, M | 32,013 | 24,720 | −7,293 | −1,173 | +25,618 | −31,738 |
| Rectum, M | 6,893 | 9,993 | +3,100 | −352 | +5,760 | −2,308 |
| Liver, M | 22,772 | 15,136 | −7,637 | −783 | +12,221 | −19,074 |
| Pancreas, M | 8,968 | 20,371 | +11,403 | −613 | +10,146 | +1,870 |
| Lung, M | 33,387 | 52,327 | +18,939 | −1,786 | +35,690 | −14,965 |
| Leukemia, M | 3,651 | 6,086 | +2,436 | −203 | +2,911 | −272 |
| Colorectum, M | 17,314 | 28,819 | +11,505 | −962 | +17,315 | −4,848 |
Observation 4.3: Cancer deaths did not rise because age-specific rates rose. For both sexes the effect of age-specific rates is negative (men −81,166, women −31,069), and the effect of population size is negative too. An age-composition effect larger than the increase itself (men +151,265, women +93,354) outweighed the two negatives. The age-composition effect is 2.433 times (men) and 1.584 times (women) the net increase.
5. Core — ratio of deaths and ratio of rates, site by site
Calculation 5.1 Ratios of deaths and of age-adjusted death rates for 40 site-by-sex groups (including all cancers and colorectum), 1995 to 2024. Sorted by the push from the age composition, smallest first.
| Site, sex | Deaths 1995 | 2024 | Ratio | Age-adjusted 1995 | 2024 | Ratio | Push |
|---|---|---|---|---|---|---|---|
| Central nervous system, M | 906 | 1,784 | 1.969 | 2.0 | 3.0 | 1.500 | 1.368 |
| Central nervous system, F | 668 | 1,467 | 2.196 | 1.3 | 2.1 | 1.615 | 1.394 |
| Breast, F | 7,763 | 15,869 | 2.044 | 14.7 | 21.5 | 1.463 | 1.433 |
| Ovary, F | 3,892 | 5,116 | 1.314 | 7.9 | 7.2 | 0.911 | 1.479 |
| Uterus, F | 4,865 | 7,116 | 1.463 | 10.9 | 9.9 | 0.908 | 1.651 |
| Leukemia, F | 2,484 | 3,895 | 1.568 | 5.1 | 4.8 | 0.941 | 1.708 |
| Liver, M | 22,773 | 15,133 | 0.665 | 63.2 | 25.4 | 0.402 | 1.723 |
| Leukemia, M | 3,645 | 6,077 | 1.667 | 10.1 | 10.1 | 1.000 | 1.738 |
| Lip/oral cavity/pharynx, M | 2,980 | 6,085 | 2.042 | 8.7 | 10.2 | 1.172 | 1.815 |
| Esophagus, M | 7,253 | 8,572 | 1.182 | 21.6 | 14.3 | 0.662 | 1.861 |
| Larynx, F | 87 | 80 | 0.920 | 0.2 | 0.1 | 0.500 | 1.885 |
| Malignant lymphoma, M | 3,735 | 7,839 | 2.099 | 11.8 | 13.2 | 1.119 | 1.955 |
| Rectum, M | 6,892 | 9,995 | 1.450 | 21.9 | 16.8 | 0.767 | 1.970 |
| Rectum, F | 4,096 | 6,124 | 1.495 | 9.7 | 7.5 | 0.773 | 1.982 |
| All cancers, F | 103,399 | 162,325 | 1.570 | 244.6 | 193.0 | 0.789 | 2.040 |
| Pancreas, M | 8,965 | 20,371 | 2.272 | 29.3 | 34.0 | 1.160 | 2.041 |
| Esophagus, F | 1,385 | 2,066 | 1.492 | 3.5 | 2.6 | 0.743 | 2.059 |
| All cancers, M | 159,623 | 221,786 | 1.389 | 537.7 | 372.6 | 0.693 | 2.090 |
| Other lymphoid/haematopoietic, M | 1,565 | 2,253 | 1.440 | 5.3 | 3.8 | 0.717 | 2.093 |
| Colorectum, M | 17,312 | 28,826 | 1.665 | 59.1 | 48.7 | 0.824 | 2.106 |
| Pancreas, F | 7,054 | 20,864 | 2.958 | 17.4 | 24.9 | 1.431 | 2.119 |
| Malignant lymphoma, F | 2,607 | 6,325 | 2.426 | 6.1 | 7.1 | 1.164 | 2.137 |
| Stomach, M | 32,015 | 24,720 | 0.772 | 110.6 | 41.5 | 0.375 | 2.145 |
| Lung, F | 12,356 | 23,236 | 1.881 | 30.0 | 26.8 | 0.893 | 2.158 |
| Colorectum, F | 13,962 | 25,590 | 1.833 | 34.1 | 29.4 | 0.862 | 2.179 |
| Colon, M | 10,420 | 18,831 | 1.807 | 37.2 | 31.9 | 0.858 | 2.196 |
| Liver, F | 8,934 | 7,332 | 0.821 | 21.2 | 8.1 | 0.382 | 2.202 |
| Stomach, F | 18,061 | 13,147 | 0.728 | 43.7 | 14.8 | 0.339 | 2.203 |
| Lip/oral cavity/pharynx, F | 1,119 | 2,495 | 2.230 | 2.7 | 2.8 | 1.037 | 2.204 |
| Other lymphoid/haematopoietic, F | 1,443 | 2,042 | 1.415 | 3.5 | 2.3 | 0.657 | 2.208 |
| Lung, M | 33,389 | 52,333 | 1.567 | 117.5 | 86.9 | 0.740 | 2.209 |
| Skin, M | 451 | 974 | 2.160 | 1.7 | 1.7 | 1.000 | 2.251 |
| Colon, F | 9,866 | 19,466 | 1.973 | 24.4 | 21.9 | 0.898 | 2.254 |
| Gallbladder/biliary, M | 6,189 | 9,205 | 1.487 | 23.5 | 15.5 | 0.660 | 2.350 |
| Larynx, M | 872 | 676 | 0.775 | 3.2 | 1.1 | 0.344 | 2.350 |
| Gallbladder/biliary, F | 7,557 | 8,027 | 1.062 | 19.3 | 8.6 | 0.446 | 2.444 |
| Skin, F | 418 | 920 | 2.201 | 1.1 | 1.0 | 0.909 | 2.482 |
| Bladder, M | 2,700 | 6,583 | 2.438 | 12.1 | 11.4 | 0.942 | 2.697 |
| Bladder, F | 1,231 | 3,142 | 2.552 | 3.5 | 3.3 | 0.943 | 2.775 |
| Prostate, M | 5,399 | 13,670 | 2.532 | 26.1 | 23.6 | 0.904 | 2.918 |
Observation 5.2: Leaving out all cancers and colorectum (the row combining colon and rectum), the 36 groups split three ways. Both deaths and rate fell in 6 groups (stomach, liver, and larynx, male and female). Deaths rose and the age-adjusted rate fell in 21 groups (lung, colon, rectum, prostate, bladder, and others). Both rose in 9 groups (pancreas, malignant lymphoma, lip/oral cavity/pharynx, and central nervous system, male and female, and breast). No group had deaths fall while the rate rose.
Observation 5.3: The push from the age composition differs by site. Among the 24 groups whose age-adjusted rate is 5 or more in both years (so that rounding moves the ratio by 1% or less), the smallest is breast at 1.433 times, the largest prostate at 2.918 times, and the median 2.128 times. For prostate, the age-adjusted rate fell to 0.904 times, yet deaths went to 2.532 times. Bladder (male) also went to 2.438 times in deaths with a rate of 0.942 times. Ovary (1.479 times) and uterus (1.651 times) have small pushes.
Observation 5.4: The 12 groups with small age-adjusted rates (central nervous system, larynx, skin, and others) are left out of the ranking of pushes, because rounding to one decimal moves their ratios a great deal. For example, larynx, female, has an age-adjusted rate of 0.2 to 0.1, and its ratio of 0.500 is strongly affected by rounding.
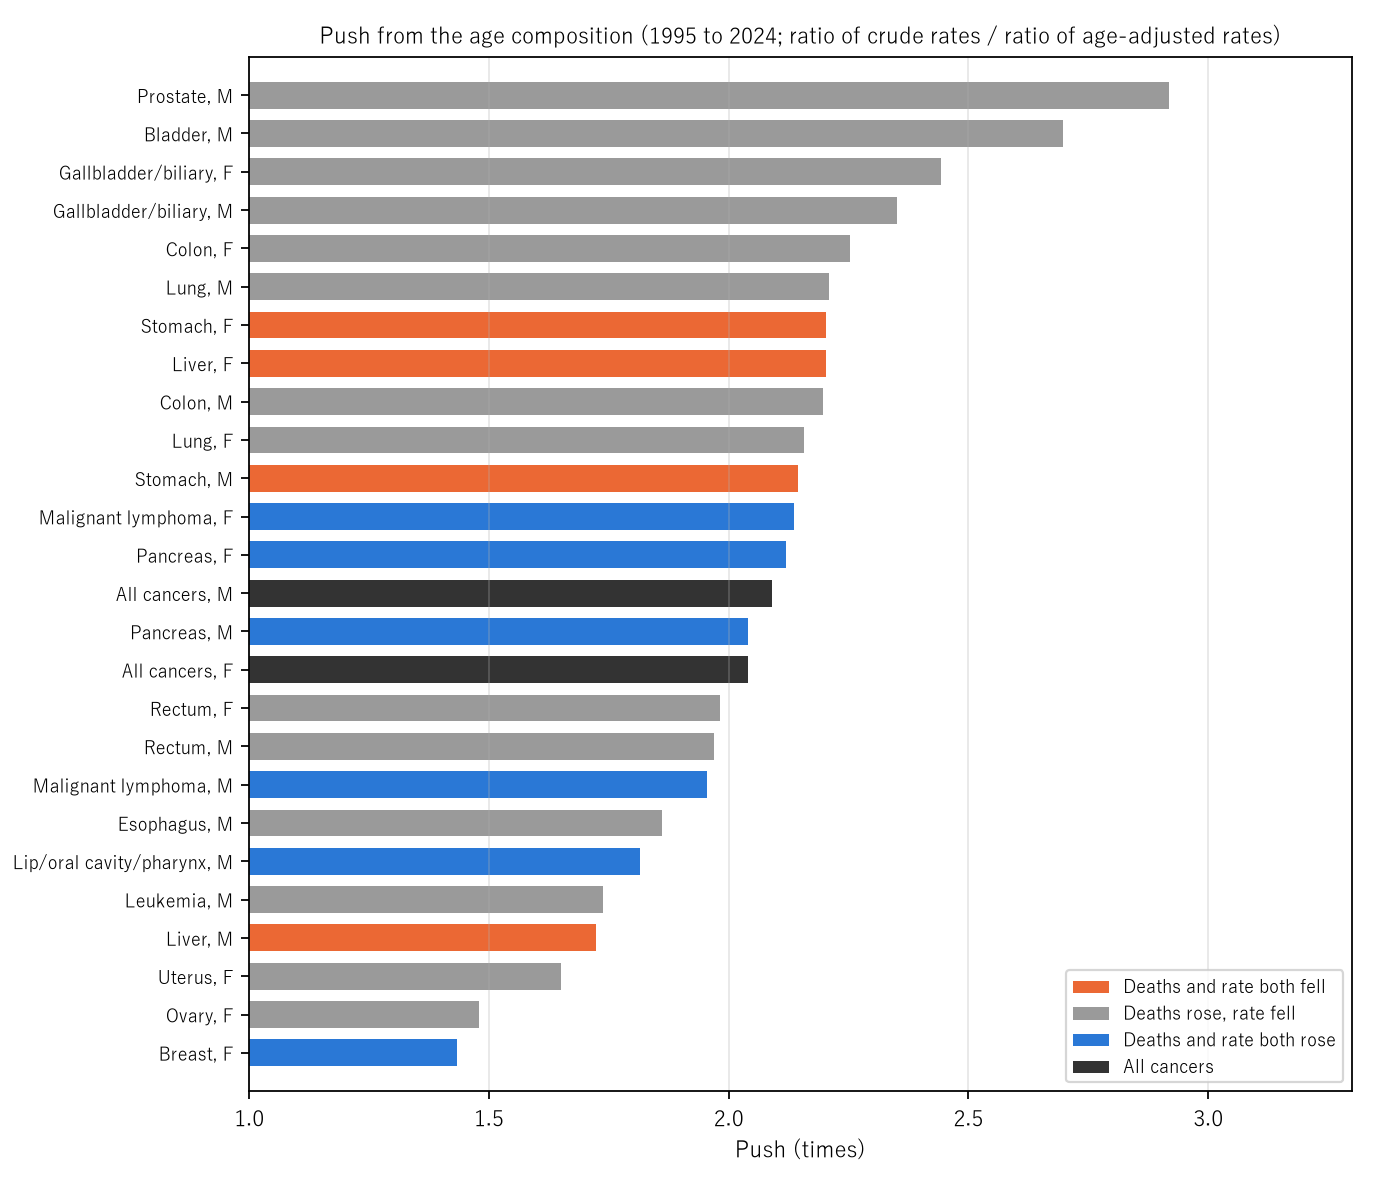
Figure 1: Push from the age composition (ratio of crude rates ÷ ratio of age-adjusted rates) for the 24 groups whose age-adjusted rate is 5 or more in both years, and for all cancers. Orange: both deaths and rate fell. Grey: deaths rose, rate fell. Blue: both rose. Black: all cancers.
6. The size of the push and the age shape of each site
Calculation 6.1 For the 16 groups with age-specific rates, the three-way split of the change in deaths (1995 to 2024) is in the table of Calculation 4.2 from the third row down. Among them, only pancreas (male +1,870, female +4,655) and breast (+4,094) have a positive effect of age-specific rates. Deaths fell for stomach and liver, male and female, and in each the effect of age-specific rates (stomach, male, −31,738, for example) was larger than the effect of the age composition (+25,618 there).
Calculation 6.2 Age shape of each site and the push (16 groups). "75+" is the share of 1995 deaths aged 75 and over. "Slope" is the slope (per year) of a straight line fitted to ln(rate) against age over 40–84 in 1995; "doubling years" is ln2 ÷ slope. The right column is the age-composition effect ÷ deaths in 1995.
| Site, sex | 75+ | Slope | Doubling years | Push | Age-composition effect ÷ 1995 deaths |
|---|---|---|---|---|---|
| Stomach, F | 0.485 | 0.0734 | 9.4 | 2.203 | +0.752 |
| Rectum, F | 0.436 | 0.0704 | 9.8 | 1.982 | +0.863 |
| Liver, F | 0.412 | 0.1148 | 6.0 | 2.202 | +0.687 |
| Pancreas, F | 0.512 | 0.1048 | 6.6 | 2.119 | +1.349 |
| Lung, F | 0.503 | 0.0893 | 7.8 | 2.158 | +1.063 |
| Breast, F | 0.161 | 0.0116 | 59.7 | 1.433 | +0.555 |
| Uterus, F | 0.358 | 0.0540 | 12.8 | 1.651 | +0.651 |
| Leukemia, F | 0.289 | 0.0493 | 14.0 | 1.708 | +0.673 |
| Colorectum, F | 0.483 | 0.0808 | 8.6 | 2.179 | +1.063 |
| Stomach, M | 0.369 | 0.0961 | 7.2 | 2.145 | +0.800 |
| Rectum, M | 0.291 | 0.0857 | 8.1 | 1.970 | +0.836 |
| Liver, M | 0.195 | 0.0813 | 8.5 | 1.723 | +0.537 |
| Pancreas, M | 0.332 | 0.0947 | 7.3 | 2.041 | +1.131 |
| Lung, M | 0.398 | 0.1161 | 6.0 | 2.209 | +1.069 |
| Leukemia, M | 0.230 | 0.0607 | 11.4 | 1.738 | +0.797 |
| Colorectum, M | 0.344 | 0.0944 | 7.3 | 2.106 | +1.000 |
Observation 6.3: The push is larger for sites whose deaths lean more toward old age. Across the 16 groups, the rank correlation of the push with the share at 75 and over is +0.744, and with the slope +0.715. Breast, with the smallest push (1.433 times), also has the smallest share at 75 and over (0.161) and the smallest slope (0.0116; doubling every 59.7 years) of the 16 groups. Because the push from the age composition is the movement of the weights with which age-specific rates are weighted by the population's age composition, it comes out larger for sites whose deaths lean toward old age. M019 showed that the speed at which death rates double with age differs by cause; the slope here is that speed for cancer sites.
Observation 6.4: Measuring the age shape by a single number, the order shifts a little with how it is measured. Liver, male, is 8th smallest of the 16 in slope (0.0813) but 2nd smallest in the share at 75 and over (0.195), and its push is small at 1.723 times.
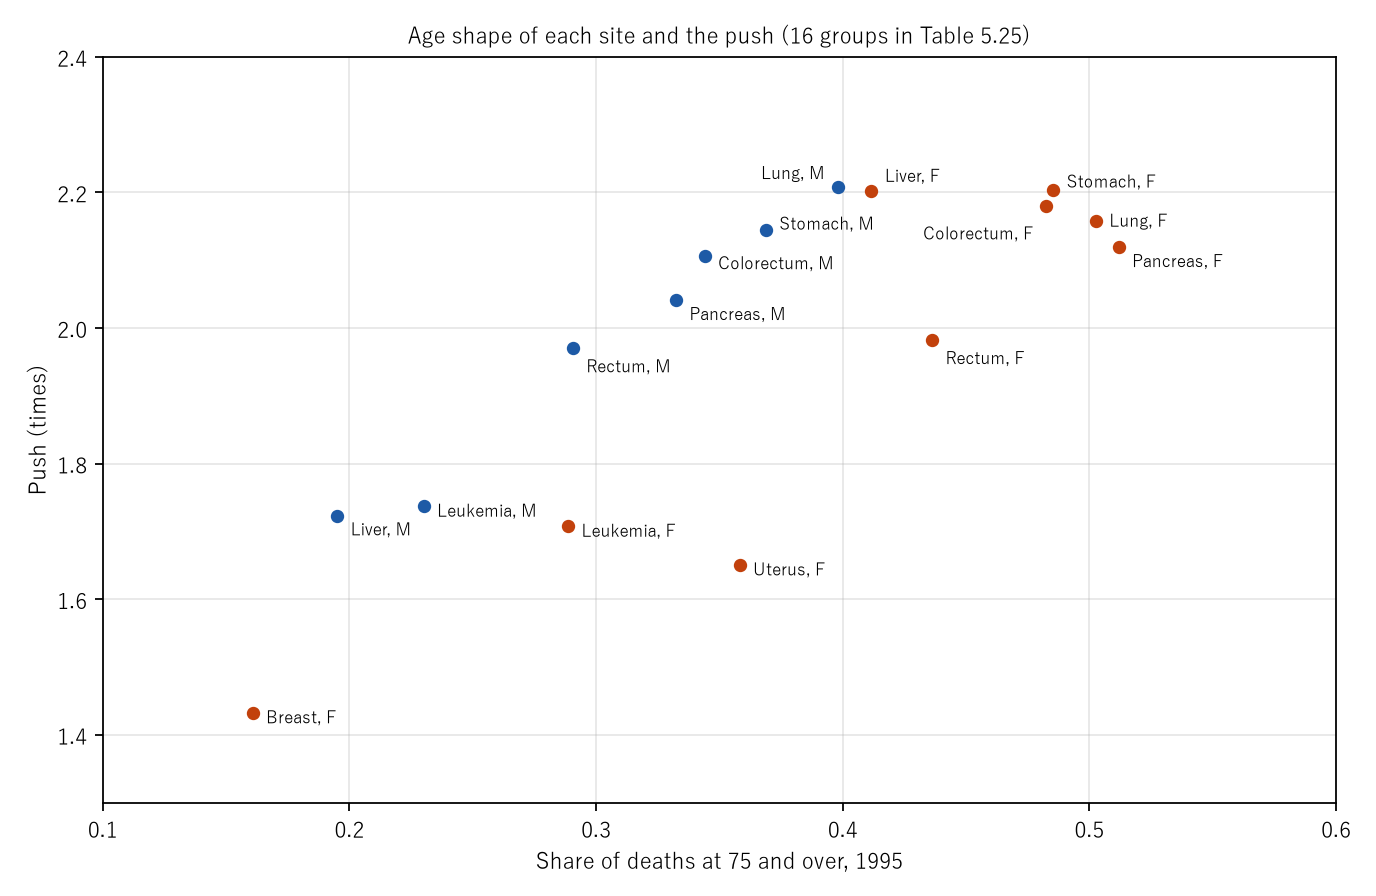
Figure 2: For the 16 groups with age-specific rates, the share of 1995 deaths aged 75 and over (horizontal) and the push from the age composition (vertical). Navy: male; orange: female.
7. Limitations
- The paper does not go into why the age-specific rates moved.
- The push from the age composition depends on the standard population. It was measured with the 2015 model population.
- Age-specific rates exist for only 9 sites (16 groups). The pushes for prostate, bladder, and others were measured but not set against their age shape.
- Only two years were compared. How things moved between 1995 and 2024 was not examined.
- Groups with small age-adjusted rates are not ranked (effect of rounding).
- It is not a forecast for one person. It does not compare regions or facilities.
Conclusion
From 1995 to 2024, cancer deaths rose 1.389 times for men and 1.570 times for women, while the age-adjusted death rate went to 0.693 and 0.789 times. Deaths rose because the age-composition effect outweighed both the fall in age-specific rates and the shrinking population. By site, only pancreas and breast had age-specific rates pushing the count up; the push from the age composition ranged from 1.433 times for breast to 2.918 times for prostate, and it was larger the more a site's deaths leaned toward old age.
Three things separate them — the age composition and the age-specific rates, and the age shape of each site.
When reading the number of cancer deaths, recall together which way the age-adjusted rate went, and how far that site leans toward old age.
Data and reproduction
| Data | Ministry of Health, Labour and Welfare, Vital Statistics 2024 (final data), Volume 1, Tables 5.24, 5.25, 5.26, and 5.15, and Appendix Table 6 (e-Stat, accessed 26 September 2026) |
| Terms of use | e-Stat follows the Public Data License (Version 2.0). This paper's ratios, populations, and three-way splits were produced by processing these and are not figures produced by the government |
| Scope | Japan, 1995 and 2024 |
| Verification | 検算/M024.py (--zu also writes the figures). Every number in the text is taken from 検算/M024_output.txt |
| Raw data | The 5 retrieved files and SOURCES.md (URLs, retrieval dates, SHA-256, terms of use, copies of the table notes, definitions and calculation) in data/ |
| Figures | 図/M024_zu1, 図/M024_zu2 (png, svg, English versions) |
References
- Ministry of Health, Labour and Welfare. Vital Statistics 2024 (final data), Volume 1, Tables 5.24, 5.25, 5.26, and 5.15, and Appendix Table 6 (in Japanese). e-Stat (accessed 26 September 2026). https://www.e-stat.go.jp/
- Yamagishi, Y. (2026). "The Death Rate Rose" Names Two Movements at Once, the Age Composition and the Age-Specific Rates [M001]. Zenodo. https://doi.org/10.5281/zenodo.22963112
- Yamagishi, Y. (2026). Men's 6.99-Year Doubling Time of the Death Rate Is a Mixture Ranging from Pneumonia at 4.80 Years to Liver Disease at 14.52 [M019]. Zenodo. https://doi.org/10.5281/zenodo.22967853
Reference
Yamagishi, Y. (2026). Cancer Deaths Rose While the Age-Adjusted Rate Fell [M024]. Zenodo.
DOI: 10.5281/zenodo.22968432
YOI: https://www.yamagishiyuuki.com/yoi/M024
ORCID: 0009-0006-8587-3450
PDF (English) · PDF (Japanese) · Date proof of the English PDF (OpenTimestamps .ots) · SHA256SUMS
The record page for this paper (in Japanese, with the PDFs in each language and the date proof): YOI M024. This paper is a preprint and has not been peer reviewed.