Abstract
This paper asks how cancer incidence rises with age — in particular, which sites follow the shape "doubling at a constant speed with age" and which do not. Using the National Cancer Registry's 2023 age-specific incidence, it fits a straight line to ln(incidence) at ages 40–84 and measures, site by site, the "doubling years" that M002 found for adult death rates. It claims no new mathematical theorem and no new law.
First, the "total" of each row of Table 3-1-A matches the crude incidence in Table 1-A (68 groups, relative difference within 1.3e-15), and the both-sexes age-specific rate lies between the male and female rates at every site and age (Section 3).
Second, the 45 site-by-sex groups split into 38 that double in 21 years or less and 7 that take over 40 years or fall with age, with no group in between (21–40 years). The 21-years-or-less groups run from 4.1 years for men's prostate to 20.3 years for men's brain/central nervous system, and all fit a straight line with R² of 0.885 or more (Section 4).
Third, the 7 groups that take over 40 years or fall are men's thyroid and women's breast, uterus, cervix, corpus uteri, ovary, and thyroid. Cervix peaks at 40–44 and falls with age over 40–84. Breast doubles in 9.5 years for men (R² 0.960) but takes 84.8 years for women (R² 0.405), with its peak at 70–74 (Section 4).
Fourth, this is the core of the paper. Women's all-sites incidence takes 17.7 years to double, 10.2 years longer than men's 7.5. Subtracting the rates of breast, uterus, ovary, and thyroid from women's all sites gives 9.7 years, and the gap to men's all sites minus prostate, thyroid, and breast (7.9 years) shrinks to 1.8 years (Section 5).
Fifth, the share of these four sites in women's incidence falls steadily with age, from 0.749 at 40–44 to 0.204 at 80–84. The sites that make up most of women's cancers at younger ages are the ones that do not double with age (Section 5).
Sixth, what separates them is the age shape of each site. "Cancer increases with age" holds for many sites but not for the sites most common in women.
Scope note: This paper claims no new mathematical theorem and no new law — age-specific incidence is published by the National Cancer Registry; the paper only fits straight lines to measure doubling years and lays the sites out. This paper is a structural interpretation of the shape of numbers in published aggregate data, and is not medical advice, diagnosis, or a treatment recommendation. The author is not a physician. For decisions about individual health, consult a physician or medical institution. It is a preprint that has not been peer reviewed. It is not one person's likelihood — every figure is a national rate for 2023. It does not go into why the age shape differs by site (hormones, infection, screening ages, and so on). It does not separate birth-year differences — one year's age-specific rates line up people born in different years and are not necessarily how the rate moves as one person ages (the distinction of M003). It does not compare regions. About the data: the National Cancer Registry on e-Stat is used under the Public Data License (Version 2.0); this paper's slopes, doubling years, and subtracted rates were produced by processing it. What the paper adds: showing that the doubling years of 45 groups split cleanly into two sets, confirming by subtracting rates that the slow doubling of women's all sites is almost entirely explained by four sites, and setting side by side that the same organ, the breast, has different age shapes in men and women.
1. Notation and question
- Doubling years: ln2 ÷ b, where b is the slope of a straight line fitted to ln(incidence) against age (middle of group − 62.5) over the nine five-year groups of ages 40–84. The same fit as M002 and M024. The fit is summarized by R². A negative slope means "falls with age."
- Peak: the age group with the highest incidence, from 0–4 to 100 and over.
- Rate without four sites: women's all-sites rate minus the rates of breast, uterus, ovary, and thyroid, age by age. Since the rates are per the same female population, they can be subtracted.
Question: does cancer incidence double with age at a constant speed? Which sites do not? What determines the shape of women's all sites?
Observation 1.1: M002 showed that adult death rates double with age at nearly a constant speed, and M024 laid out the age slope of cancer death rates by site. This paper applies the same fit to the rate of getting cancer.
2. Survey and design
Stated honestly: the design was set after seeing the tables.
| Content | |
|---|---|
| Age-specific incidence | National Cancer Registry 2023, Table 3-1-A (per 100,000; sex, site, five-year groups, 100 and over grouped) |
| Check | Same, Table 1-A crude incidence |
| Fit | Ages 40–84, nine groups (as in M002) |
| Expectation and what was measured | Before the survey the expectation was that doubling years would scatter continuously across sites. Measured, there was not a single group between the 21-years-or-less set and the over-40-years set |
3. Data and checks
Calculation 3.1 The 2 retrieved files were fixed by SHA-256, and the following was checked.
- The age groups of Table 3-1-A run from 0-4 to 100 and over (plus "unknown"); 73 rows.
- The "total" column of Table 3-1-A = crude incidence in Table 1-A (68 groups; largest relative difference 1.3e-15).
- The both-sexes age-specific rate lies between the male and female rates (all sites and ages present in both).
- 0 groups have a zero rate at ages 40–84.
4. Doubling years by site and sex
Calculation 4.1 Slope, doubling years, R², and peak at ages 40–84 (2023, per 100,000). Sorted by slope, largest first.
| Site, sex | Slope (per year) | Doubling years | R² | Peak | Rate at peak |
|---|---|---|---|---|---|
| Prostate, M | +0.1687 | 4.1 years | 0.886 | 75–79 | 703.8 |
| Gallbladder/bile ducts, M | +0.1214 | 5.7 years | 0.991 | 95–99 | 133.9 |
| Bladder, M | +0.1174 | 5.9 years | 0.972 | 95–99 | 249.6 |
| Lung, M | +0.1166 | 5.9 years | 0.960 | 95–99 | 634.7 |
| Larynx, M | +0.1161 | 6.0 years | 0.924 | 75–79 | 27.2 |
| Liver, M | +0.1103 | 6.3 years | 0.951 | 90–94 | 188.0 |
| Stomach, M | +0.1095 | 6.3 years | 0.973 | 85–89 | 548.8 |
| Gallbladder/bile ducts, F | +0.1088 | 6.4 years | 0.985 | 95–99 | 110.9 |
| Bladder, F | +0.1040 | 6.7 years | 0.981 | 95–99 | 61.1 |
| Esophagus, M | +0.1026 | 6.8 years | 0.900 | 75–79 | 124.5 |
| Liver, F | +0.0998 | 6.9 years | 0.991 | 100+ | 84.4 |
| Pancreas, M | +0.0961 | 7.2 years | 0.955 | 85–89 | 172.4 |
| Pancreas, F | +0.0935 | 7.4 years | 0.979 | 95–99 | 159.0 |
| All sites, M | +0.0925 | 7.5 years | 0.968 | 85–89 | 3700.8 |
| Multiple myeloma, M | +0.0901 | 7.7 years | 0.958 | 85–89 | 32.9 |
| Lung, F | +0.0893 | 7.8 years | 0.963 | 95–99 | 225.3 |
| Multiple myeloma, F | +0.0885 | 7.8 years | 0.956 | 80–84 | 20.4 |
| Larynx, F | +0.0881 | 7.9 years | 0.902 | 80–84 | 2.3 |
| Colon, M | +0.0864 | 8.0 years | 0.962 | 95–99 | 385.1 |
| Skin, M | +0.0849 | 8.2 years | 0.998 | 100+ | 445.5 |
| Stomach, F | +0.0822 | 8.4 years | 0.989 | 85–89 | 202.1 |
| Colorectum, M | +0.0757 | 9.2 years | 0.951 | 95–99 | 489.3 |
| Malignant lymphoma, M | +0.0748 | 9.3 years | 0.980 | 85–89 | 139.6 |
| Colon, F | +0.0738 | 9.4 years | 0.983 | 95–99 | 308.2 |
| Breast, M | +0.0728 | 9.5 years | 0.960 | 95–99 | 9.1 |
| Skin, F | +0.0698 | 9.9 years | 0.998 | 100+ | 253.2 |
| Kidney/urinary tract, M | +0.0688 | 10.1 years | 0.959 | 85–89 | 118.2 |
| Esophagus, F | +0.0657 | 10.6 years | 0.885 | 80–84 | 21.7 |
| Colorectum, F | +0.0649 | 10.7 years | 0.978 | 95–99 | 380.8 |
| Kidney/urinary tract, F | +0.0645 | 10.7 years | 0.984 | 90–94 | 53.4 |
| Oral cavity/pharynx, M | +0.0639 | 10.9 years | 0.913 | 80–84 | 80.1 |
| Malignant lymphoma, F | +0.0628 | 11.0 years | 0.974 | 85–89 | 81.1 |
| Rectum, M | +0.0615 | 11.3 years | 0.906 | 70–74 | 157.4 |
| Leukemia, M | +0.0526 | 13.2 years | 0.993 | 90–94 | 57.8 |
| Rectum, F | +0.0480 | 14.4 years | 0.933 | 95–99 | 72.6 |
| Leukemia, F | +0.0439 | 15.8 years | 0.989 | 85–89 | 26.9 |
| Oral cavity/pharynx, F | +0.0401 | 17.3 years | 0.985 | 95–99 | 41.2 |
| All sites, F | +0.0391 | 17.7 years | 0.983 | 95–99 | 1927.4 |
| Brain/CNS, F | +0.0355 | 19.5 years | 0.984 | 85–89 | 9.9 |
| Brain/CNS, M | +0.0341 | 20.3 years | 0.972 | 85–89 | 19.1 |
| Thyroid, M | +0.0170 | 40.8 years | 0.844 | 100+ | 18.2 |
| Breast, F | +0.0082 | 84.8 years | 0.405 | 70–74 | 277.7 |
| Thyroid, F | +0.0005 | 1267.6 years | 0.005 | 75–79 | 28.7 |
| Ovary, F | +0.0001 | 6544.8 years | 0.000 | 55–59 | 35.2 |
| Uterus, F | −0.0054 | falls with age | 0.094 | 55–59 | 102.2 |
| Cervix, F | −0.0120 | falls with age | 0.965 | 40–44 | 28.2 |
| Corpus uteri, F | −0.0008 | falls with age | 0.001 | 55–59 | 78.3 |
Observation 4.2: The 45 groups (excluding all sites) split into 38 that double in 21 years or less and 7 that take over 40 years or fall with age; no group falls between 21 and 40 years. The 21-years-or-less groups run from 4.1 years for men's prostate to 20.3 years for men's brain/central nervous system, with the smallest R² 0.885.
Observation 4.3: The 7 groups that take over 40 years or fall are men's thyroid and women's breast, uterus, cervix, corpus uteri, ovary, and thyroid. Cervix peaks at 40–44 and falls with age over 40–84. Corpus uteri and ovary peak at 55–59.
Observation 4.4: Breast doubles in 9.5 years for men (R² 0.960) and takes 84.8 years for women (R² 0.405; peak at 70–74). Even for the same organ, the age shape differs completely between men and women.
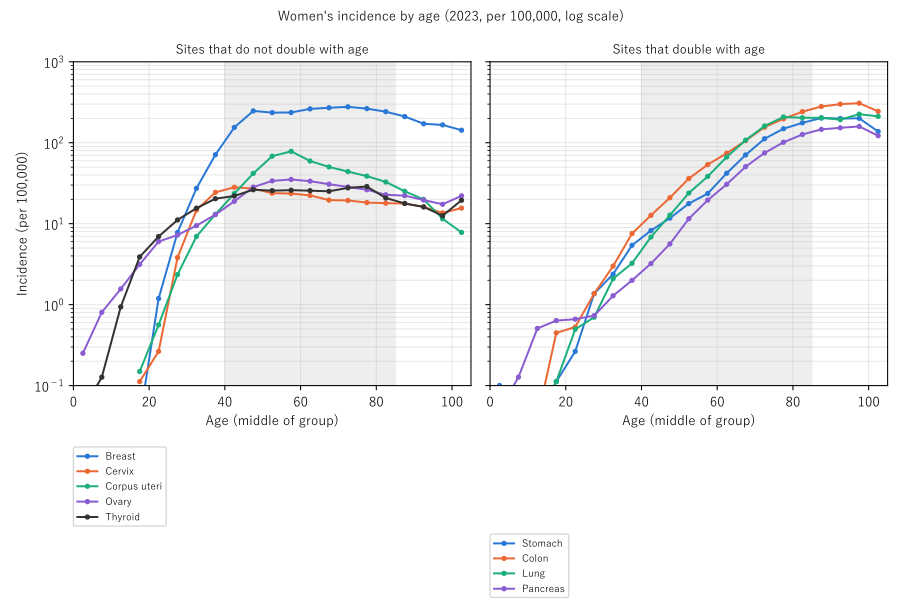
Figure 1: Women's age-specific incidence (2023, log vertical scale). Left: sites that do not double with age; right: sites that do. The grey band is the ages 40–84 used for the fit. On a log vertical axis, doubling at a constant speed is a straight line.
5. Core — why women's all sites double slowly
Calculation 5.1 Doubling years of all sites and of all sites minus some sites (ages 40–84)
| Doubling years | R² | |
|---|---|---|
| Women's all sites | 17.7 years | 0.983 |
| Men's all sites | 7.5 years | 0.968 |
| Women's all sites − breast, uterus, ovary, thyroid | 9.7 years | 0.987 |
| Men's all sites − prostate, thyroid, breast | 7.9 years | 0.973 |
Calculation 5.2 Share of breast, uterus, ovary, and thyroid in women's all-sites incidence
| 40–44 | 45–49 | 50–54 | 55–59 | 60–64 | 65–69 | 70–74 | 75–79 | 80–84 |
|---|---|---|---|---|---|---|---|---|
| 0.749 | 0.744 | 0.660 | 0.581 | 0.487 | 0.386 | 0.308 | 0.251 | 0.204 |
Observation 5.3: Women's all sites take 17.7 years to double, 10.2 years longer than men's 7.5. Subtracting the four sites gives 9.7 years, and the gap to men (7.9 years without prostate, thyroid, and breast) shrinks to 1.8 years. Most of the slowness of women's all sites comes from the age shape of the four sites.
Observation 5.4: The four sites make up 0.749 of women's incidence at 40–44 and 0.204 at 80–84. The sites that make up most of women's cancers at younger ages are the ones that do not double with age. So women's all sites start relatively high at younger ages and rise gently.
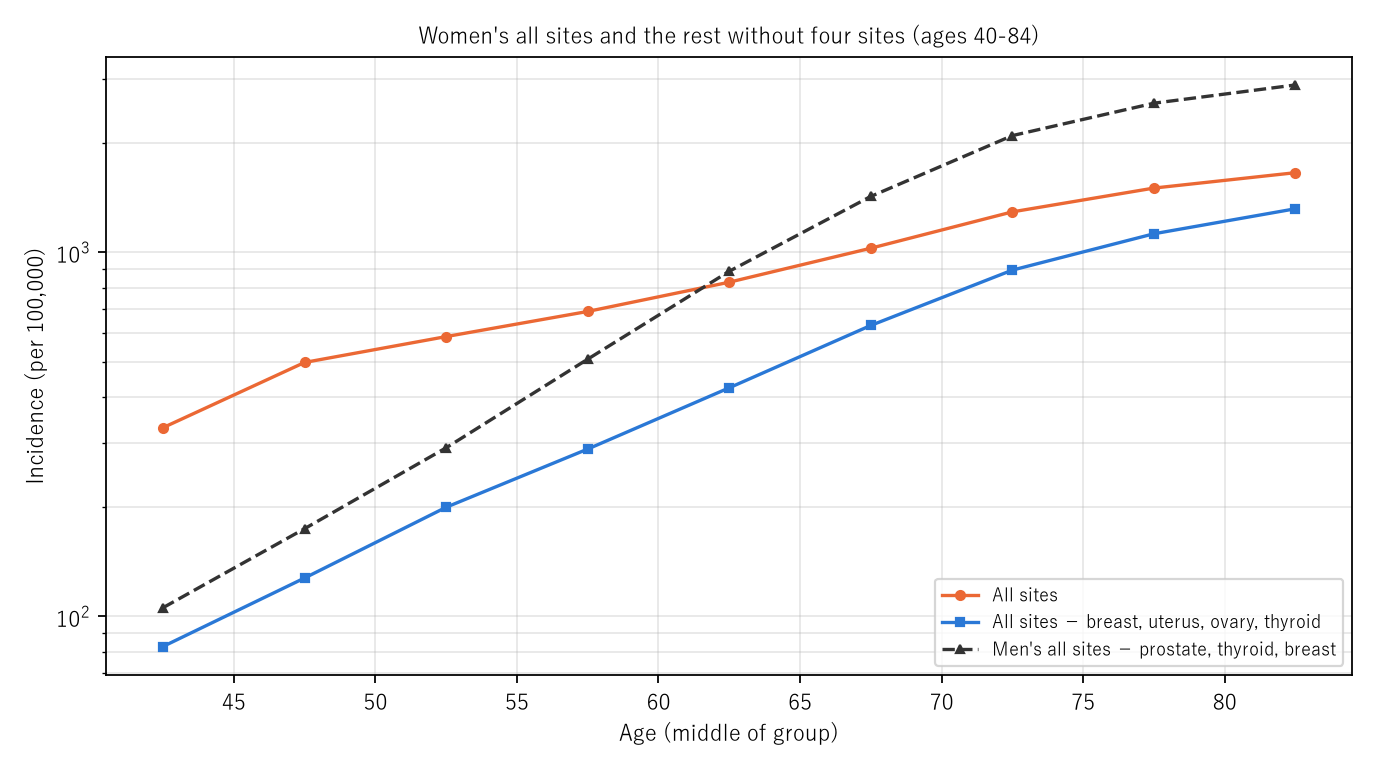
Figure 2: At ages 40–84: women's all sites (orange), women's all sites minus the four sites (blue), and men's all sites minus prostate, thyroid, and breast (black dashed). Log vertical scale.
6. Limitations
- These are one year's age-specific rates. They line up people born in different years and are not necessarily how the rate moves as one person ages.
- It does not go into why age shapes differ by site.
- The fit uses only ages 40–84. Shapes at younger and older ages are only shown in the figure.
- Subtracted rates are this paper's calculation. Sites not in the table are also in "the rest."
- It is not one person's likelihood. It does not compare regions.
Conclusion
At ages 40–84 in 2023, cancer incidence doubled with age at a constant speed for many sites (38 groups, 4.1–20.3 years). What did not double were men's thyroid and women's breast, uterus, ovary, and thyroid, and cervix fell with age. Women's all sites take 17.7 years to double because those four sites make up much of women's cancers at younger ages; without the four it was 9.7 years.
One thing separates them — the age shape of each site.
When hearing that "cancer increases with age," recall together that for many sites this is doubling at a constant speed, and for the sites most common in women it is a shape with a peak in middle age.
Data and reproduction
| Data | National Cancer Registry 2023, Tables 3-1-A and 1-A (e-Stat, retrieved 25 September 2026) |
| Terms of use | e-Stat follows the Public Data License (Version 2.0). This paper's slopes, doubling years, and subtracted rates were produced by processing these and are not figures produced by the government |
| Scope | Japan, 2023 |
| Verification | 検算/M029.py (--zu also writes the figures). Every number in the text is taken from 検算/M029_output.txt |
| Raw data | The 2 retrieved files and SOURCES.md (URLs, retrieval dates, SHA-256, terms of use, definitions and calculation) in data/ |
| Figures | 図/M029_zu1, 図/M029_zu2 (png, svg, English versions) |
References
- Ministry of Health, Labour and Welfare. National Cancer Registry: Cancer Incidence 2023, Table 1-A and Table 3-1-A (in Japanese). e-Stat (accessed 25 September 2026). https://www.e-stat.go.jp/
- Yamagishi, Y. (2026). The Speed at Which Adult Death Rates Double with Age Hardly Moved; What Fell Was the Level [M002]. Zenodo. https://doi.org/10.5281/zenodo.22963210
- Yamagishi, Y. (2026). Life Expectancy Is Not the Number of Years Anyone Actually Lives [M003]. Zenodo. https://doi.org/10.5281/zenodo.22963485
- Yamagishi, Y. (2026). Cancer Deaths Rose While the Age-Adjusted Rate Fell — the Push from the Age Composition Ranges from 1.433 Times for Breast to 2.918 Times for Prostate [M024]. Zenodo. https://doi.org/10.5281/zenodo.22968432
Reference
Yamagishi, Y. (2026). Women's Cancer Incidence Takes Longer to Double with Age (17.7 Years) Than Men's (7.5 Years) Because Breast, Uterus, Ovary, and Thyroid Do Not Double with Age [M029]. Zenodo.
DOI: 10.5281/zenodo.22968904
YOI: https://www.yamagishiyuuki.com/yoi/M029
ORCID: 0009-0006-8587-3450
PDF (English) · PDF (Japanese) · Date proof of the English PDF (OpenTimestamps .ots) · SHA256SUMS
The record page for this paper (in Japanese, with the PDFs in each language and the date proof): YOI M029. This paper is a preprint and has not been peer reviewed.