Abstract
This paper asks how the difference in cancer incidence between men and women changes with age, and which sites the reversal comes from. Using the National Cancer Registry's 2023 age-specific incidence rates (Table 3-1-A), it computes the male-to-female rate ratio by age; using age-specific case counts (Table 2-A), it splits the difference in the number of women and men by site; and it sets the content of cancers at ages 15–39 beside ages 65 and over. It claims no new mathematical theorem and no new law.
First, the "total" column of Table 2-A equals the sum of the age columns and the case counts in Table 1-A, and the population obtained as cases ÷ rate × 100,000 agrees whichever site it is computed from, for the same sex and age (464 pairs, relative difference within 7.5e-15) (Section 3).
Second, the male-to-female rate ratio is 1.342 over all ages, but falls below 1 in the 8 groups from 20–24 to 55–59, lowest at 0.345 at 40–44 (women's rate 2.90 times men's). Only these 8 groups fall below 1 (Section 4).
Third, this is the core of the paper. Removing breast, uterus, ovary, and thyroid (for men, prostate, thyroid, and breast), the male-to-female rate ratio exceeds 1 at every age, 1.135 at its lowest. At ages 20–59 the ratio moves from 0.345–0.866 to 1.278–1.765. If thyroid is kept, only 25–29 and 30–34 fall below 1 (Section 4).
Fourth, at ages 20–59 women outnumber men by 44,721 cases, but breast, uterus, ovary, and thyroid alone contribute 67,736 more, and each of the other 16 sites in the table has more men (Section 5).
Fifth, 0.687 of women's cancers at ages 15–39 are the four sites (0.242 at 65 and over); for men, colorectum 0.144, leukemia 0.115, and malignant lymphoma 0.093 lead, and sites without a row in the table make up 0.269 (0.031 at 65 and over). Women also outnumber men in cases at 90 and over, but there the rate is still higher in men (1.958 times at 90–94) — because women's population is 2.511 times men's (Sections 5 and 6).
Sixth, what separates them is the composition of sites. "Cancer is more common in men" holds for many sites at every age, but in the all-sites rate, women's four sites, large at younger ages, overturn it.
Scope note: This paper claims no new mathematical theorem and no new law — age-specific incidence rates and counts are published by the National Cancer Registry; the paper only takes their ratios and differences and lays the sites out. This paper is a structural interpretation of the shape of numbers in published aggregate data, and is not medical advice, diagnosis, or a treatment recommendation. The author is not a physician. For decisions about individual health, consult a physician or medical institution. It is a preprint that has not been peer reviewed. It is not one person's likelihood — every figure is a national aggregate for 2023. Bearing in mind that young people and their families may read it, figures are shown as rates and shares, and counts under 10 are not shown. It does not go into why the sexes differ (hormones, lifestyle, screening, infection, and so on). It does not read sites without a row as any particular site — Tables 2-A and 3-1-A have rows for only 21 sites; the rest are in "all sites" only. It does not separate birth-year differences and does not compare regions. About the data: the National Cancer Registry on e-Stat is used under the Public Data License (Version 2.0); this paper's ratios, differences, and shares were produced by processing it. What the paper adds: showing that the reversal of the male-to-female rate ratio occurs only in the 8 groups at ages 20–59 and disappears without the four sites, splitting the difference in cases at ages 20–59 by site and showing that all of the other 16 sites in the table are more common in men, and showing, by setting counts beside rates, that the reversal in cases at 90 and over comes from population.
1. Notation and question
- Male-to-female rate ratio: men's rate ÷ women's rate in Table 3-1-A, by age group. Since each rate is per the population of the same sex, differences in the size of the male and female populations do not enter. Below 1 means the rate is higher in women at that age.
- The four sites: breast, uterus, ovary, and thyroid — the sites that did not double with age over 40–84 in M029.
- Rate without some sites: the all-sites rate minus the rates of those sites, age by age. For women the four sites are subtracted; for men, prostate, thyroid, and breast.
- The 16 common sites in the table: the 21 site rows minus breast, uterus, ovary, prostate, and thyroid.
- Sites without a row: all-sites cases minus the sum of the 21 site rows.
Question: is the cancer incidence rate higher in men at every age? If there are ages where it is higher in women, which sites does that come from? How does the content of cancers in young people differ from that in older people?
Observation 1.1: M029 showed that women's all-sites incidence rises only gently because the four sites, large at younger ages, do not double with age. This paper looks at the same four sites from the side of the male-to-female ratio.
2. Survey and design
Stated honestly: the design was set after seeing the tables.
| Content | |
|---|---|
| Age-specific rates | National Cancer Registry 2023, Table 3-1-A (per 100,000; sex, site, five-year groups, 100 and over grouped) |
| Age-specific counts | Same, Table 2-A (sex, site, five-year groups, with an age-unknown column) |
| Checks | Same, Table 1-A case counts and crude rates |
| How to compare | Men and women are compared by rates (to keep population differences out). The split of differences by site uses counts |
| Expectation and what was measured | Before the survey the expectation was that, even without the four sites, some age in the 20s or 30s would remain where women were higher. Measured, 2 groups remained only when thyroid was kept, and none when thyroid was also removed |
3. Data and checks
Calculation 3.1 The 3 retrieved files were fixed by SHA-256, and the following was checked.
- Tables 2-A and 3-1-A have the same age groups: 21 groups from 0-4 to 100 and over (plus "unknown"). Both have 73 rows, with 21 site rows.
- The "total" column of Table 2-A = sum of the age columns (including unknown), for every row.
- The "total" column of Table 2-A = case counts in Table 1-A, for every row.
- The both-sexes row of Table 2-A equals men + women or exceeds it by 0–2 (8 cells are not zero; the table gives no reason; the same pattern as in Table 1-A seen in M025).
- The population obtained as cases ÷ rate × 100,000 agrees, for the same sex and age, whichever site (100 cases or more) it is computed from (464 pairs; largest relative difference 7.5e-15).
- The sum of the 21 site rows does not exceed all sites, for both sexes and all ages.
4. The male-to-female rate ratio and age
Calculation 4.1 All-sites incidence rate and male-to-female ratio by age group (2023, per 100,000). The last column is the male-to-female ratio of rates without breast, uterus, ovary, and thyroid for women and without prostate, thyroid, and breast for men.
| Age | Men's rate | Women's rate | Men ÷ women | Men ÷ women without the four sites etc. |
|---|---|---|---|---|
| 0–4 | 20.3 | 18.2 | 1.116 | 1.135 |
| 5–9 | 10.8 | 8.9 | 1.211 | 1.343 |
| 10–14 | 12.7 | 11.8 | 1.079 | 1.347 |
| 15–19 | 16.8 | 16.2 | 1.035 | 1.764 |
| 20–24 | 21.0 | 28.0 | 0.748 | 1.451 |
| 25–29 | 29.6 | 51.4 | 0.576 | 1.399 |
| 30–34 | 46.4 | 106.8 | 0.434 | 1.293 |
| 35–39 | 72.9 | 193.9 | 0.376 | 1.301 |
| 40–44 | 113.7 | 329.9 | 0.345 | 1.278 |
| 45–49 | 186.9 | 498.3 | 0.375 | 1.366 |
| 50–54 | 322.3 | 586.8 | 0.549 | 1.456 |
| 55–59 | 595.7 | 687.9 | 0.866 | 1.765 |
| 60–64 | 1092.8 | 827.7 | 1.320 | 2.089 |
| 65–69 | 1808.1 | 1026.0 | 1.762 | 2.261 |
| 70–74 | 2684.6 | 1291.1 | 2.079 | 2.341 |
| 75–79 | 3291.1 | 1500.7 | 2.193 | 2.283 |
| 80–84 | 3585.1 | 1654.1 | 2.167 | 2.188 |
| 85–89 | 3700.8 | 1808.9 | 2.046 | 2.034 |
| 90–94 | 3631.0 | 1854.7 | 1.958 | 1.920 |
| 95–99 | 3648.8 | 1927.4 | 1.893 | 1.798 |
| 100 and over | 3009.1 | 1729.9 | 1.739 | 1.729 |
Over all ages (Table 1-A crude rates), men 919.2 and women 685.0, so men ÷ women is 1.342.
Observation 4.2: The male-to-female rate ratio falls below 1 only in the 8 groups from 20–24 to 55–59. It is lowest at 0.345 at 40–44, where women's rate is 2.90 times men's. Up to 15–19 and from 60–64 on, men's rate is higher.
Calculation 4.3 Groups below 1 as the removed sites change
| Removed | Groups below 1 | Lowest male-to-female ratio |
|---|---|---|
| Nothing (all sites) | The 8 groups from 20–24 to 55–59 | 0.345 (40–44) |
| Breast, uterus, ovary, prostate | 25–29 (0.976), 30–34 (0.959) | 0.959 (30–34) |
| Also thyroid | None | 1.135 (0–4) |
| Only the 16 common sites in the table (sites without a row also removed) | None | 1.051 (25–29) |
Observation 4.4: Without the four sites (for men, prostate, thyroid, and breast), the male-to-female rate ratio exceeds 1 at every age. At ages 20–59 the range changes from 0.345–0.866 for all sites to 1.278–1.765 after removal. Keeping thyroid leaves only 25–29 and 30–34 below 1, so at these two ages the thyroid difference also matters. Even with only the 16 sites in the table, sites without a row removed as well, the ratio exceeds 1 at every age.
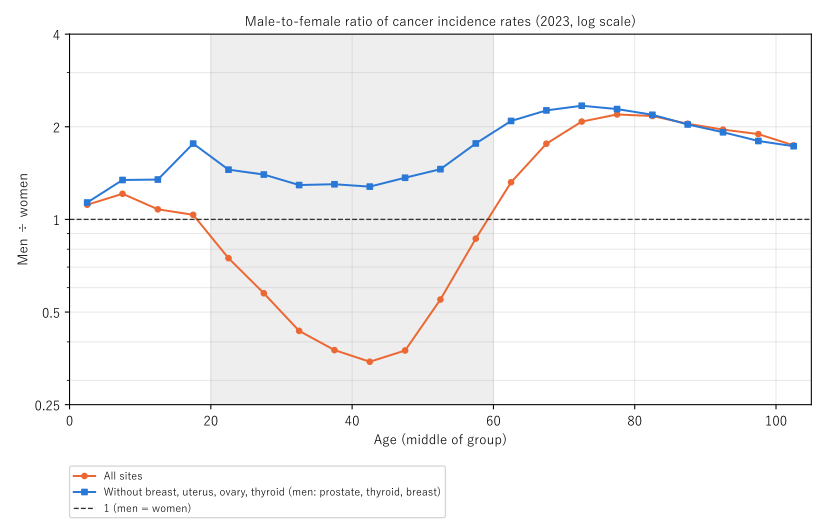
Figure 1: Male-to-female ratio of cancer incidence rates (men ÷ women, 2023, log vertical scale). Orange: all sites; blue: without breast, uterus, ovary, and thyroid (for men, prostate, thyroid, and breast). The dashed line is 1. The grey band is ages 20–59, where the all-sites ratio is below 1.
5. Core — which sites the difference at ages 20–59 comes from
Calculation 5.1 Difference in cases (women − men) at ages 20–59 (the 8 groups from 20–24 to 55–59)
| Difference in cases (women − men) | |
|---|---|
| All sites | +44,721 (women 104,010, men 59,289) |
| Breast | +41,519 |
| Uterus | +15,915 |
| Ovary | +6,218 |
| Thyroid | +4,084 |
| Four sites combined | +67,736 |
| Prostate | −4,432 |
| The 16 common sites combined | −16,872 |
| Sites without a row | −1,711 |
| Difference without the four sites | −23,015 |
In order of size, the 16 common sites are colorectum −3,101, stomach −2,202, kidney/urinary tract −2,163, oral cavity/pharynx −1,700, lung −1,599, esophagus −1,399, liver −1,182, leukemia −776, bladder −763, pancreas −694, malignant lymphoma −350, larynx −279, brain/CNS −264, multiple myeloma −167, skin −118, and gallbladder/bile ducts −115.
Observation 5.2: At ages 20–59 women outnumber men by 44,721 cases, but breast, uterus, ovary, and thyroid alone contribute 67,736 more. Every one of the 16 common sites in the table has more men. Without the four sites the difference becomes −23,015 (more men). The breast difference is women's breast minus men's breast.
Observation 5.3: "More in women" at ages 20–59 does not have the shape of women being more prone to cancer in general. It has the shape of four sites found only or mostly in women being large at younger ages.
6. What cancers are at ages 15–39
Calculation 6.1 Content of cases at ages 15–39 (from 15–19 to 35–39). Shares are of all sites for each sex. The last column is the share of the same site at 65 and over (from 65–69 to 100 and over).
Women (ages 15–39: 12,909 cases; 65 and over: 300,729 cases)
| Site | Cases at 15–39 | Share | Share at 65 and over |
|---|---|---|---|
| Breast | 3,587 | 0.278 | 0.170 |
| Uterus | 2,195 | 0.170 | 0.039 |
| Thyroid | 1,850 | 0.143 | 0.016 |
| Ovary | 1,235 | 0.096 | 0.018 |
| Colorectum | 807 | 0.063 | 0.181 |
| Malignant lymphoma | 517 | 0.040 | 0.045 |
| Leukemia | 445 | 0.034 | 0.013 |
| Stomach | 315 | 0.024 | 0.097 |
| Other sites in the table | 1,312 | 0.102 | 0.377 |
| Sites without a row | 646 | 0.050 | 0.045 |
Men (ages 15–39: 6,269 cases; 65 and over: 454,623 cases)
| Site | Cases at 15–39 | Share | Share at 65 and over |
|---|---|---|---|
| Colorectum | 902 | 0.144 | 0.142 |
| Leukemia | 719 | 0.115 | 0.013 |
| Malignant lymphoma | 582 | 0.093 | 0.033 |
| Thyroid | 491 | 0.078 | 0.004 |
| Brain/CNS | 325 | 0.052 | 0.004 |
| Stomach | 309 | 0.049 | 0.135 |
| Oral cavity/pharynx | 308 | 0.049 | 0.026 |
| Kidney/urinary tract (excl. bladder) | 260 | 0.041 | 0.034 |
| Other sites in the table | 689 | 0.110 | 0.577 |
| Sites without a row | 1,684 | 0.269 | 0.031 |
Observation 6.2: 0.687 of women's cancers at ages 15–39 are the four sites (0.242 at 65 and over), in the order breast, uterus, thyroid, ovary. At ages 15–39, women's cases are 2.059 times men's.
Observation 6.3: For men at ages 15–39, colorectum, leukemia, and malignant lymphoma lead, and leukemia (0.115 against 0.013 at 65 and over), thyroid (0.078 against 0.004), and brain/CNS (0.052 against 0.004) are clearly larger than at 65 and over. Sites without a row make up 0.269, 8.57 times the share at 65 and over (0.031). Which sites they are cannot be told from this table, so they are not read as any particular site. Lung is much smaller in the young: 0.032 at 15–39 against 0.156 at 65 and over for men, and 0.017 against 0.121 for women.
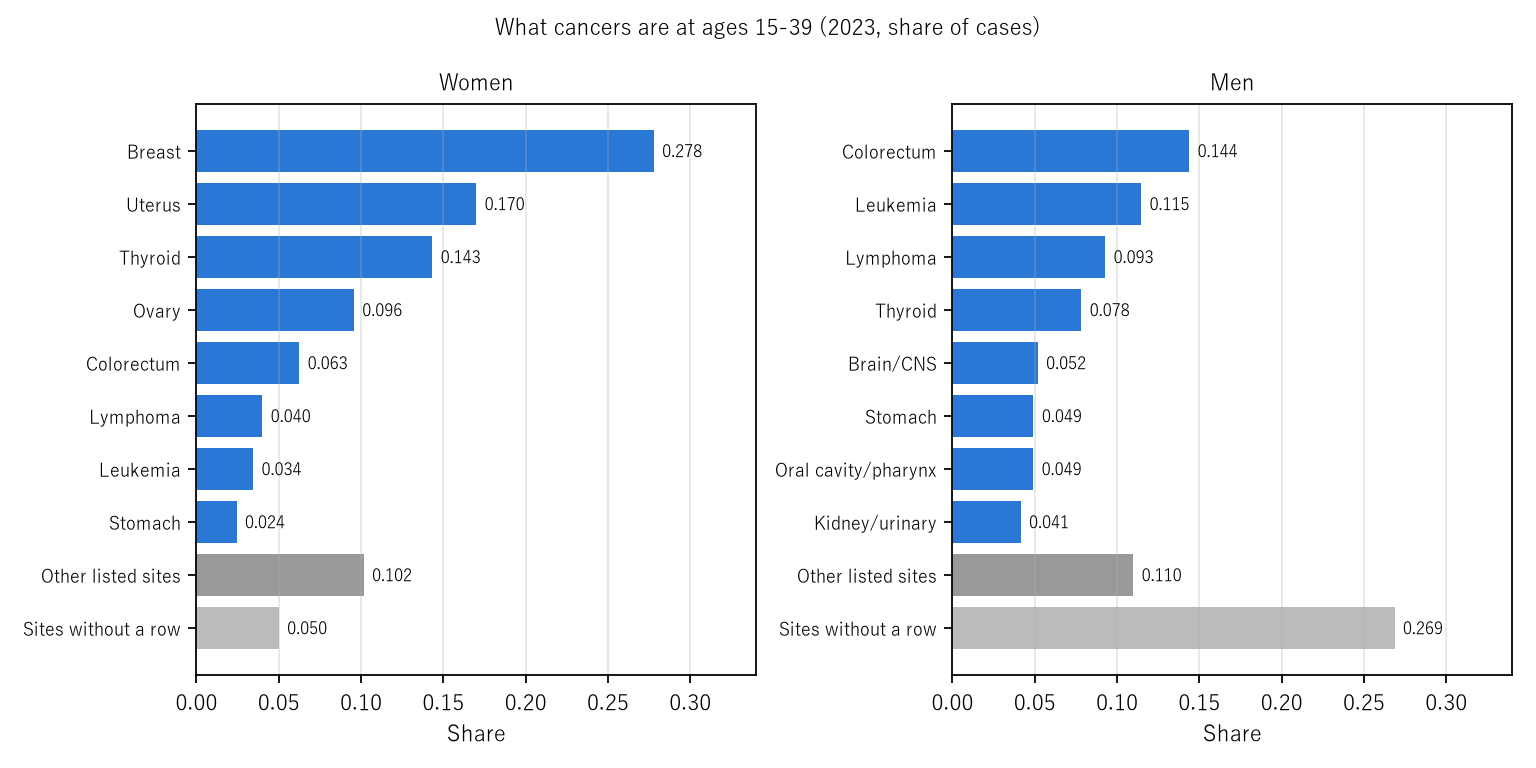
Figure 2: What cancers are at ages 15–39 (2023, share of cases). Left: women; right: men. Grey: sites in the table outside the top 8, and sites without a row in the table.
Observation 6.4: Women outnumber men in cases in the 8 groups at ages 20–59 and in the three groups at 90 and over. At 90 and over the rate is still higher in men (1.958 times at 90–94, 1.893 at 95–99, 1.739 at 100 and over). The population obtained as cases ÷ rate × 100,000 is 2.511, 3.950, and 7.000 times larger for women than for men, outweighing the rate difference. The reversal at 20–59 comes from the composition of sites, and the reversal at 90 and over comes from population — the same "more women" has different content.
7. Limitations
- These are one year's age-specific figures. They line up people born in different years and are not necessarily how figures move as one person ages.
- It does not go into why the sexes differ.
- Which sites lack a row cannot be told. They are large for men at 15–39, but are not read as any particular site.
- The split of differences by site uses counts. Counts also depend on population size, so the main comparison of the sexes rests on rates.
- It is not one person's likelihood. It does not compare regions.
Conclusion
In 2023 the cancer incidence rate was 1.342 times higher in men over all ages, but higher in women in the 8 groups at ages 20–59, and 2.90 times higher in women at 40–44. That reversal came from breast, uterus, ovary, and thyroid; without them, men's rate was higher at every age. Splitting the difference in cases at ages 20–59 by site, all of the other 16 sites in the table were more common in men. At ages 15–39, 0.687 of women's cancers were the four sites, while for men colorectum, leukemia, and malignant lymphoma led.
One thing separates them — the composition of sites.
When hearing that "among young people, cancer is more common in women," recall together that this is not about cancer in general but about four sites more common in women being large at younger ages, and that the other sites are higher in men at every age.
Data and reproduction
| Data | National Cancer Registry 2023, Table 2-A (retrieved 26 September 2026), Tables 3-1-A and 1-A (retrieved 25 September 2026) (e-Stat) |
| Terms of use | e-Stat follows the Public Data License (Version 2.0). This paper's ratios, differences, and shares were produced by processing these and are not figures produced by the government |
| Scope | Japan, 2023 |
| Verification | 検算/M030.py (--zu also writes the figures). Every number in the text is taken from 検算/M030_output.txt |
| Raw data | The 3 retrieved files and SOURCES.md (URLs, retrieval dates, SHA-256, terms of use, definitions and calculation) in data/ |
| Figures | 図/M030_zu1, 図/M030_zu2 (png, svg, English versions) |
References
- Ministry of Health, Labour and Welfare. National Cancer Registry: Cancer Incidence 2023, Table 1-A, Table 2-A, and Table 3-1-A (in Japanese). e-Stat (accessed 26 September 2026). https://www.e-stat.go.jp/
- Yamagishi, Y. (2026). The Year's Deaths Divided by Its New Cases (the MI Ratio) Is Not a Share of the Same People — Against 1 − 5-Year Survival It Is 0.97 Times for Pancreas and 3.07 Times for Prostate [M025]. Zenodo. https://doi.org/10.5281/zenodo.22968532
- Yamagishi, Y. (2026). Women's Cancer Incidence Takes Longer to Double with Age (17.7 Years) Than Men's (7.5 Years) Because Breast, Uterus, Ovary, and Thyroid Do Not Double with Age — Without Those Four It Is 9.7 Years [M029]. Zenodo. https://doi.org/10.5281/zenodo.22968904
Reference
Yamagishi, Y. (2026). Cancer Incidence Is Higher in Men Overall but Higher in Women at Ages 20–59 [M030]. Zenodo.
DOI: 10.5281/zenodo.22968960
YOI: https://www.yamagishiyuuki.com/yoi/M030
ORCID: 0009-0006-8587-3450
PDF (English) · PDF (Japanese) · Date proof of the English PDF (OpenTimestamps .ots) · SHA256SUMS
The record page for this paper (in Japanese, with the PDFs in each language and the date proof): YOI M030. This paper is a preprint and has not been peer reviewed.