Abstract
This paper asks by which route cancers are found — cancer screening, health checks, or checkups; during follow-up of another disease; or otherwise — and how this differs by site. It lays out, site by site, the National Cancer Registry's 2023 table of the circumstances of detection (Table 4-A), and sets it beside the stage mix of cases diagnosed in 2018. It claims no new mathematical theorem and no new law.
First, the number counted in Table 4-A equals incidence (Table 1-A) minus people registered from death information only (DCO, Table 8-A) for all 26 sites (difference under one person). For all sites it is 972,956 (Section 3).
Second, this is the core of the paper. For all sites, 34.49% were found "during follow-up of another disease," and 15.06% by "cancer screening, health check, or checkup" (screening etc. in this paper). Follow-up is 2.29 times screening etc., about one in 2.90. 47.68% are "other," 2.73% "unknown," and 0.04% found at autopsy (Section 4).
Third, the share found by screening etc. ranges by site from 0.21% for skin to 26.59% for prostate (followed by breast 26.16%, stomach 18.36%, and rectum 18.35%). Follow-up is highest for liver at 60.12%, followed by multiple myeloma 52.67% and kidney/urinary tract 51.59%. Follow-up exceeds "other" at 6 of 23 sites (Section 5).
Fourth, across sites, the way cancers are found and the share localized (diagnosed 2018, among people with known stage) hardly line up (over 19 sites, rank correlation −0.126 with the share found by screening etc., −0.146 with screening etc. plus follow-up). Skin is 0.21% screening etc. and 89.4% localized; bladder 3.51% and 77.1%; lung 15.80% and 35.0% (Section 6).
Fifth, this lack of alignment shows only that differences in how sites are found do not explain differences in their stage; it says nothing about whether screening helps. Comparison between sites and effectiveness within a site are different questions (Section 6).
Sixth, what separates them is the route by which each site is found.
Scope note: This paper claims no new mathematical theorem and no new law — the circumstances of detection are published by the National Cancer Registry; the paper only lays them out by site and sets them beside the stage mix. This paper is a structural interpretation of the shape of numbers in published aggregate data, and is not medical advice, diagnosis, or a treatment recommendation. The author is not a physician. For decisions about individual health, consult a physician or medical institution. It is a preprint that has not been peer reviewed. It does not discuss the effectiveness of screening, and neither recommends nor discourages screening — that detection routes and stage do not line up between sites says nothing about whether screening moves the stage within a site. It does not read "other" as visits for symptoms or the like — the table does not say what it contains. It is not a forecast for one person. It does not compare regions or facilities. Cells that would come to fewer than 10 people (site-by-site autopsy findings) are not shown. About the data: the National Cancer Registry on e-Stat is used under the Public Data License (Version 2.0); this paper's ratios and rank correlations were produced by processing it. Stage shares are used with the source stated as "National Cancer Center Japan, Cancer Information Service." What the paper adds: confirming, by matching three tables, that the number counted in Table 4-A excludes people registered from death information only, setting out that follow-up is 2.29 times screening etc. for all sites, and how detection routes spread by site, and measuring that detection routes and stage do not line up across sites.
1. Notation and question
- Detection route: the five categories of Table 4-A (%, both sexes, 2023) — "cancer screening, health check, checkup" (screening etc.), "during follow-up of another disease" (follow-up), "found at autopsy," "other," and "unknown."
- Share localized: the share localized among people with known stage, cases diagnosed in 2018 (Cancer Information Service table; as in M026).
Question: by which route are cancers found, and how does this differ by site? Do differences in route line up with differences in stage between sites?
Observation 1.1: How cancers are found is often told in two ways: "found by screening" and "found after symptoms appear." Table 4-A counts a large route that is neither — found while visiting for another disease.
2. Survey and design
Stated honestly: the design was set after seeing the tables.
| Content | |
|---|---|
| Detection route | National Cancer Registry 2023, Table 4-A, "circumstances of detection (%) by site" (both sexes) |
| Matching | Same, Table 1-A (incidence) and Table 8-A (DCO) |
| Stage | Cancer Information Service table, cases diagnosed in 2018, by stage (both sexes). A different year from 4-A |
| Expectation and what was measured | Before the survey the expectation was "the higher a site's share found by screening etc., the higher its share localized." Laid out across sites, the rank correlation was −0.126: they hardly line up |
3. Data and checks
Calculation 3.1 The 4 retrieved files were fixed by SHA-256, and the following was checked.
- The columns of Table 4-A: number counted, cancer screening/health check/checkup, follow-up of another disease, found at autopsy, other, unknown.
- The five categories sum to 100 (all sites).
- Number counted in Table 4-A = incidence in Table 1-A × (1 − DCO in Table 8-A ÷ 100) (difference under one person for all 26 sites). All sites: incidence 993,469 × (1 − DCO 2.06% ÷ 100) = 972,956.0; number counted 972,956.
- No cell of screening etc., follow-up, other, or unknown comes to fewer than 10 people. Autopsy findings come to fewer than 10 people at 14 of 23 sites, so site values are not shown.
Observation 3.2: The shares in Table 4-A are shares among people excluding those registered from death information only (DCO). People first known to have cancer after death are not in the denominator of detection routes. DCO is the registration-quality indicator that M025 set beside the MI ratio.
4. All sites
Calculation 4.1 All sites (972,956 people, 2023)
| Detection route | Share (%) | In people |
|---|---|---|
| Cancer screening, health check, checkup | 15.06 | 146,493 |
| Follow-up of another disease | 34.49 | 335,576 |
| Found at autopsy | 0.04 | 393 |
| Other | 47.68 | 463,914 |
| Unknown | 2.73 | 26,580 |
Observation 4.2: Follow-up is 2.29 times screening etc., about one in 2.90. The table does not say what "other" contains, so the paper does not read it as visits for symptoms or the like.
5. Core — detection routes by site
Calculation 5.1 Detection routes by site (%, both sexes, 2023). Sorted by the share found by screening etc., highest first. Autopsy findings are not shown by site.
| Site | Number counted | Screening etc. | Follow-up | Other | Unknown |
|---|---|---|---|---|---|
| Prostate | 101,047 | 26.59 | 44.65 | 23.87 | 4.83 |
| Breast | 101,510 | 26.16 | 16.89 | 53.18 | 3.75 |
| Stomach | 103,018 | 18.36 | 37.12 | 42.51 | 1.98 |
| Rectum | 51,011 | 18.35 | 22.27 | 56.95 | 2.41 |
| Thyroid | 16,376 | 18.24 | 45.38 | 30.06 | 6.08 |
| Colon | 100,250 | 17.29 | 29.81 | 50.88 | 2.00 |
| Cervix | 10,371 | 17.25 | 17.46 | 62.45 | 2.83 |
| Lung | 119,748 | 15.80 | 47.78 | 34.22 | 2.15 |
| Esophagus | 25,644 | 15.68 | 33.36 | 49.26 | 1.66 |
| Kidney/urinary tract | 30,231 | 10.87 | 51.59 | 34.41 | 3.06 |
| Leukemia | 14,853 | 9.61 | 40.31 | 47.02 | 3.03 |
| Corpus uteri | 19,848 | 8.46 | 21.19 | 69.21 | 1.14 |
| Ovary | 12,678 | 7.80 | 28.34 | 60.77 | 3.07 |
| Malignant lymphoma | 36,882 | 6.79 | 30.52 | 60.57 | 2.01 |
| Multiple myeloma | 7,690 | 6.23 | 52.67 | 38.40 | 2.69 |
| Pancreas | 45,742 | 5.22 | 36.40 | 56.88 | 1.45 |
| Liver | 31,157 | 4.70 | 60.12 | 31.42 | 3.69 |
| Gallbladder/bile ducts | 20,014 | 4.01 | 35.65 | 58.48 | 1.84 |
| Bladder | 23,358 | 3.51 | 28.01 | 65.30 | 3.17 |
| Brain/CNS | 5,674 | 1.94 | 17.01 | 76.93 | 4.07 |
| Oral cavity/pharynx | 23,466 | 1.77 | 26.23 | 69.77 | 2.22 |
| Larynx | 4,614 | 1.41 | 22.37 | 74.32 | 1.89 |
| Skin | 27,252 | 0.21 | 14.36 | 84.07 | 1.36 |
Observation 5.2: The share found by screening etc. ranges from 0.21% for skin to 26.59% for prostate. At the top are prostate, breast (26.16%), stomach (18.36%), and rectum (18.35%); at the bottom, skin, larynx (1.41%), oral cavity/pharynx (1.77%), and brain/central nervous system (1.94%).
Observation 5.3: Follow-up is highest for liver at 60.12%, followed by multiple myeloma 52.67%, kidney/urinary tract 51.59%, lung 47.78%, thyroid 45.38%, and prostate 44.65%. Follow-up exceeds "other" at 6 sites: liver, lung, prostate, kidney/urinary tract, thyroid, and multiple myeloma.
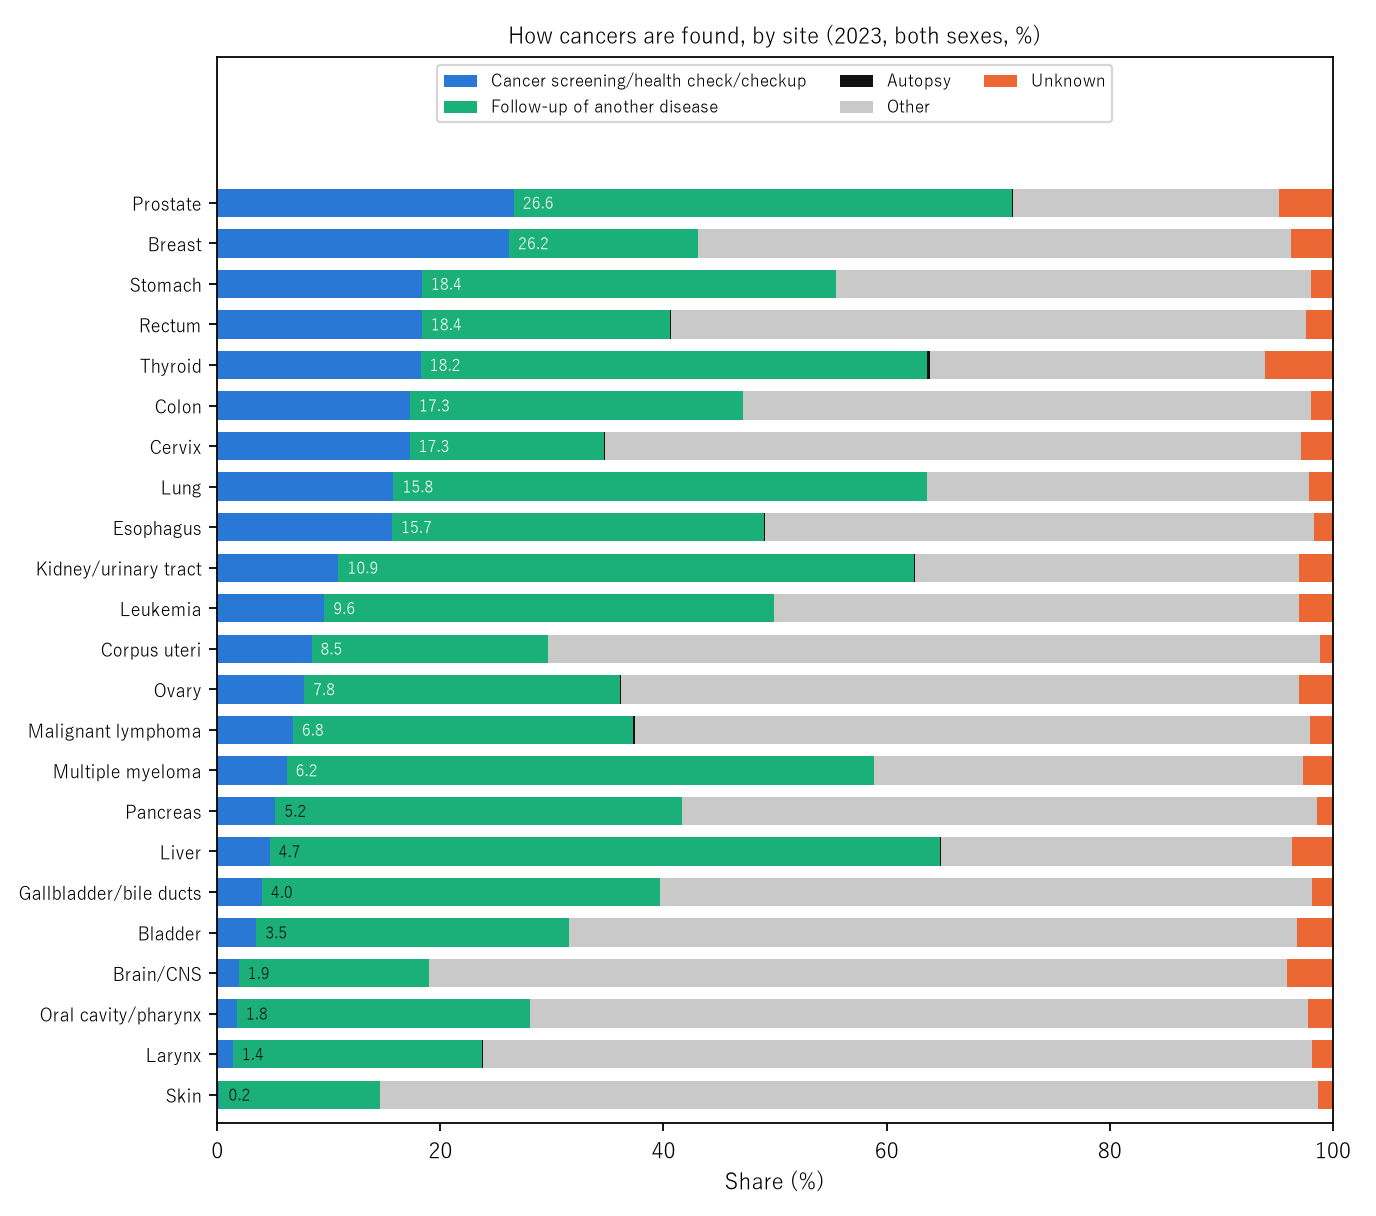
Figure 1: Detection routes by site (%). Blue: cancer screening, health check, checkup (the number is its share); green: follow-up of another disease; grey: other; orange: unknown; black: found at autopsy.
6. Detection routes and stage mix
Calculation 6.1 Share localized by site (diagnosed 2018, among people with known stage) and detection routes (2023) (%). Sorted by share localized, highest first.
| Site | Share localized | Screening etc. | Follow-up |
|---|---|---|---|
| Skin | 89.4 | 0.21 | 14.36 |
| Bladder | 77.1 | 3.51 | 28.01 |
| Larynx | 75.1 | 1.41 | 22.37 |
| Liver | 70.9 | 4.70 | 60.12 |
| Corpus uteri | 70.8 | 8.46 | 21.19 |
| Prostate | 67.0 | 26.59 | 44.65 |
| Breast | 64.6 | 26.16 | 16.89 |
| Kidney/urinary tract | 62.3 | 10.87 | 51.59 |
| Stomach | 61.2 | 18.36 | 37.12 |
| Colon | 49.2 | 17.29 | 29.81 |
| Rectum | 48.7 | 18.35 | 22.27 |
| Thyroid | 44.7 | 18.24 | 45.38 |
| Cervix | 43.8 | 17.25 | 17.46 |
| Esophagus | 40.9 | 15.68 | 33.36 |
| Oral cavity/pharynx | 38.0 | 1.77 | 26.23 |
| Lung | 35.0 | 15.80 | 47.78 |
| Ovary | 24.2 | 7.80 | 28.34 |
| Gallbladder/bile ducts | 19.3 | 4.01 | 35.65 |
| Pancreas | 17.5 | 5.22 | 36.40 |
Observation 6.2: Across sites, the way cancers are found and the share localized hardly line up. Over 19 sites, the rank correlation is −0.126 between screening etc. and localized, −0.146 between screening etc. plus follow-up and localized, and +0.160 between other and localized. Skin is 0.21% screening etc. and 89.4% localized; bladder 3.51% and 77.1%; lung 15.80% and 35.0%; pancreas 5.22% and 17.5%.
Observation 6.3: Differences in stage between sites cannot be explained by differences in how they are found. Skin and bladder are rarely found by screening etc., yet many are found localized. The paper does not go into why (how symptoms appear, and so on). This lack of alignment says nothing about whether screening moves the stage within a site — comparison between sites and effectiveness within a site are different questions (and the years also differ, 2023 and 2018).
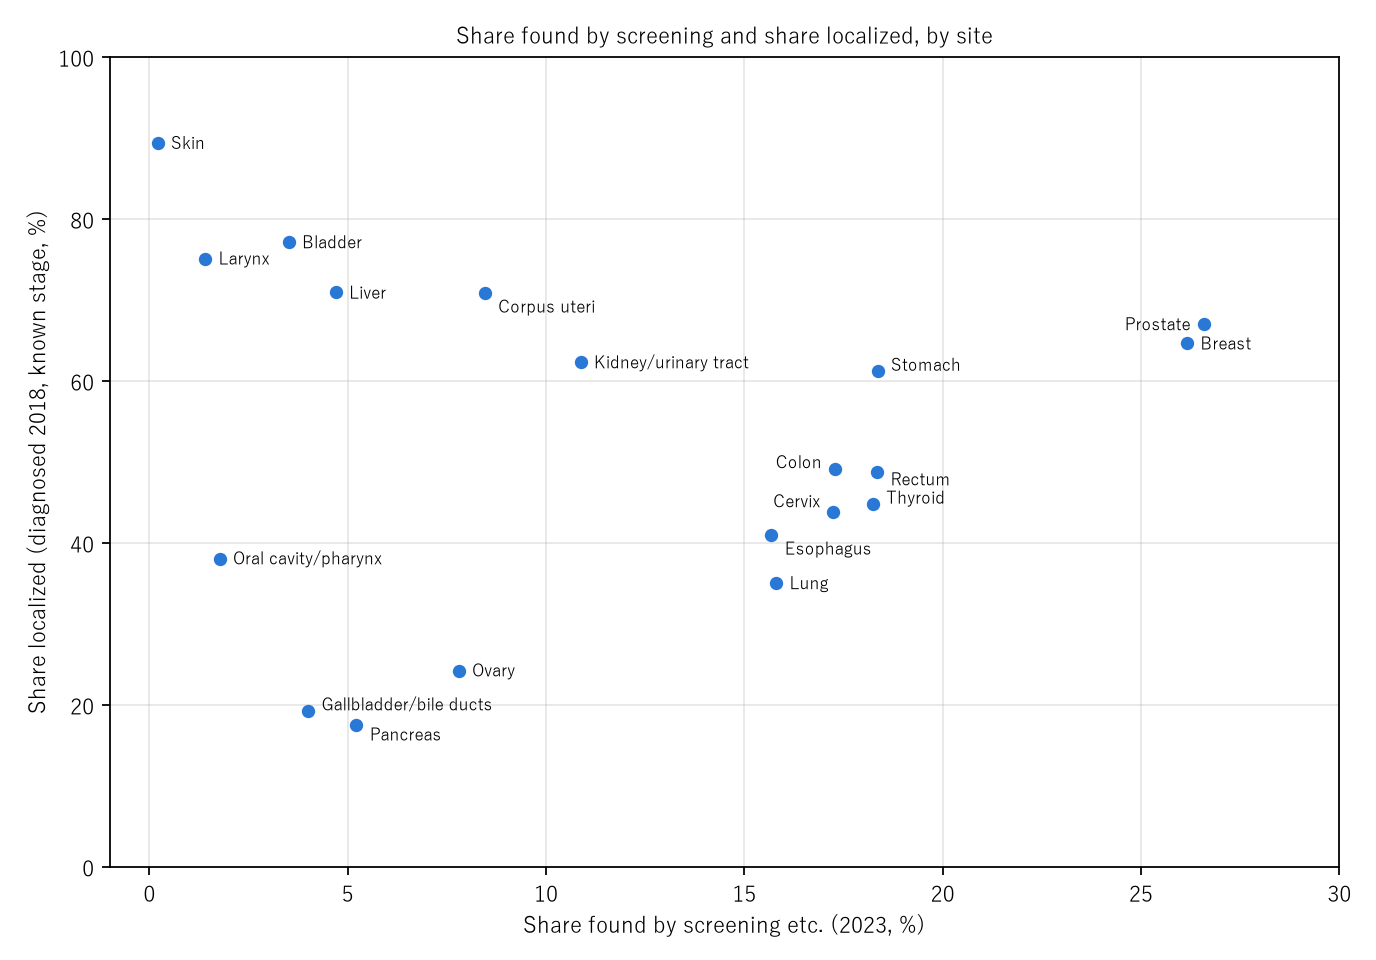
Figure 2: By site, the share found by screening etc. (horizontal, 2023) and the share localized (vertical, diagnosed 2018, among people with known stage).
7. Limitations
- What "other" contains is unknown. The table does not say.
- Detection routes (2023) and stage (diagnosed 2018) differ in year. They are not matched on the same people.
- Only both sexes combined were examined.
- The effectiveness of screening is not discussed. Alignment between sites and effectiveness within a site are different questions.
- People registered from death information only are not included (outside the denominator of Table 4-A).
- It is not a forecast for one person. It does not compare regions or facilities.
Conclusion
About one in three cancers registered in 2023 (34.49%) was found during follow-up of another disease, and 15.06% by screening or health checks. That share ranged by site from 0.21% (skin) to 26.59% (prostate), and 60.12% of liver cancers were found during follow-up. Across sites, detection routes and the share localized hardly lined up.
One thing separates them — the route by which each site is found.
When thinking about how cancers are found, recall together that besides screening and symptoms there is a large route — while visiting for another disease — and that its width differs by site.
Data and reproduction
| Data | National Cancer Registry 2023, Tables 4-A, 1-A, and 8-A (e-Stat); table of 5-year relative survival based on the National Cancer Registry (cases diagnosed in 2018, by stage) (Cancer Information Service) (accessed 26 September 2026) |
| Terms of use | e-Stat follows the Public Data License (Version 2.0). Stage shares are used with the source stated as "National Cancer Center Japan, Cancer Information Service." This paper's ratios and rank correlations are processed figures, not figures produced by the government or the institutions that compiled them |
| Scope | Japan, 2023 (detection routes), diagnosed 2018 (stage) |
| Verification | 検算/M028.py (--zu also writes the figures). Every number in the text is taken from 検算/M028_output.txt |
| Raw data | The 4 retrieved files and SOURCES.md (URLs, retrieval dates, SHA-256, terms of use, definitions and calculation) in data/ |
| Figures | 図/M028_zu1, 図/M028_zu2 (png, svg, English versions) |
References
- Ministry of Health, Labour and Welfare. National Cancer Registry: Cancer Incidence 2023, Table 1-A, Table 4-A, and Table 8-A (in Japanese). e-Stat (accessed 26 September 2026). https://www.e-stat.go.jp/
- National Cancer Center Japan, Cancer Information Service. Cancer survival data from the National Cancer Registry (cases diagnosed in 2016-2018), 5-year relative survival, cancer_survivalNCR(2016-2018).xlsx (in Japanese; accessed 26 September 2026). https://ganjoho.jp/reg_stat/statistics/data/dl/excel/cancer_survivalNCR%282016-2018%29.xlsx
- Yamagishi, Y. (2026). The Year's Deaths Divided by Its New Cases (the MI Ratio) Is Not a Share of the Same People — Against 1 − 5-Year Survival It Is 0.97 Times for Pancreas and 3.07 Times for Prostate [M025]. Zenodo. https://doi.org/10.5281/zenodo.22968532
- Yamagishi, Y. (2026). Differences in 5-Year Survival Between Sites Split into Stage Mix and Stage-Specific Survival — Bladder and Lung Are Nearly Equal Stage by Stage, Yet Combined They Are 69.6 Versus 41.9 [M026]. Zenodo. https://doi.org/10.5281/zenodo.22968675
Reference
Yamagishi, Y. (2026). About One in Three Cancers Is Found During Follow-Up of Another Disease [M028]. Zenodo.
DOI: 10.5281/zenodo.22968852
YOI: https://www.yamagishiyuuki.com/yoi/M028
ORCID: 0009-0006-8587-3450
PDF (English) · PDF (Japanese) · Date proof of the English PDF (OpenTimestamps .ots) · SHA256SUMS
The record page for this paper (in Japanese, with the PDFs in each language and the date proof): YOI M028. This paper is a preprint and has not been peer reviewed.