Abstract
This paper asks how the large rise in cancer incidence in 2016 should be set beside movements in other years. 2016 is the year incidence counting switched from regional cancer registries to the National Cancer Registry. Using the age-standardized incidence of two series published by the Cancer Information Service — national (national estimates from regional registries up to 2015, the National Cancer Registry from 2016) and the three prefectures of Yamagata, Fukui, and Nagasaki (observed regional registry data up to 2015, the National Cancer Registry from 2016) — it sets the change from 2015 to 2016 beside changes in other years, by site and by age. It claims no new mathematical theorem and no new law.
First, the sums within the three tables agree, and the table download page says that "due to the institutional change with the introduction of the National Cancer Registry in 2016, caution is needed in interpreting changes in incidence data around 2015–2016." That the 2016 value was the highest ever in the three-prefecture series is already stated in the abstract of an earlier study (Tanaka et al., 2026) (Section 3).
Second, the age-standardized incidence of all sites (both sexes) went from 369.0 to 402.0 nationally (1.089 times) and from 356.6 to 419.4 in the three prefectures (1.176 times). In both series this is the largest yearly change in 2004–2023. In the previous 10 years (2006–2015), the year-on-year ratio ranged 0.990–1.049 nationally and 0.976–1.039 in the three prefectures (Section 4).
Third, this is the core of the paper. In the three prefectures, all 17 sites rose from the previous year in 2016, while in other years at most 12 did. Nationally, 16 sites rose in 2016 (only larynx did not), while in other years at most 15 did (Section 5).
Fourth, the jump differs in size by site. Sites exceeding the maximum of the previous 10 years numbered 6 nationally and 11 in the three prefectures. In all 9 age groups from 40 to 84, the year-on-year ratio exceeds 1 in both series (Section 6).
Fifth, the largest national year-on-year ratio in the previous 10 years is 1.049 in 2011, which coincides with the year the criteria for choosing regions for the national estimates changed. After the jump, the rate fell in 2017 (0.967 nationally, 0.954 in the three prefectures), and in 2023 the national rate is 0.933 times that of 2016 (Section 4).
Sixth, what separates them is a seam in how cases are counted, or a movement in disease. This paper does not decide how much of the 2016 jump comes from counting. What it shows is a shape: the jump coincides with the year counting changed, is larger than in any other year, and occurred in the same direction in almost all sites and at all ages.
Scope note: This paper claims no new mathematical theorem and no new law — age-standardized incidence is published by the Cancer Information Service; the paper only compares it with the previous year and lays it out by site and age. This paper is a structural interpretation of the shape of numbers in published aggregate data, and is not medical advice, diagnosis, or a treatment recommendation. The author is not a physician. For decisions about individual health, consult a physician or medical institution. It is a preprint that has not been peer reviewed. It does not split the 2016 jump into a part due to counting and a part due to disease — that would need data counting the same people under both systems. That the three-prefecture value was the highest ever in 2016 is already stated in the abstract of an earlier study (Tanaka et al., 2026). This paper has not read its full text and cites only one sentence of its abstract. It does not go into the reasons for the 2020 fall. It does not discuss the merits of registry systems. It is not one person's likelihood. It does not read the three prefectures against the nation as a comparison of regions — the three prefectures form a series chosen for long-running, high-quality registration. About the data: the Cancer Information Service tables are used following the citation forms and rules shown on the page; this paper's year-on-year ratios and site counts were produced by processing them. What the paper adds: setting the 2016 change beside the changes in all other years of 2004–2023 with the same yardstick, counting the sites that rose each year and showing that only in 2016 did all 17 sites rise in the three prefectures, and setting the jump by site and by age beside the range of the previous 10 years.
1. Notation and question
- Age-standardized incidence: the value for the 1985 Japanese model population on the asr sheet of each table (the standard population common to the three tables). Per 100,000.
- National series: national estimates from regional registries for 1975–2015 and the National Cancer Registry for 2016–2023. Three-prefecture series: Yamagata, Fukui, and Nagasaki, with observed regional registry data for 1985–2015 and the National Cancer Registry for 2016–2023. Both change source between 2015 and 2016.
- Year-on-year ratio: a year's value ÷ the previous year's. The size of a change is compared by the absolute value of the natural logarithm of the ratio (putting rises and falls on the same yardstick).
- Range of the previous 10 years: minimum and maximum year-on-year ratios in 2006–2015.
- Sites that rose: of the 17 sites common to both series (both sexes), the number whose year-on-year ratio exceeded 1.
Question: how large is the 2016 rise compared with movements in other years, and what shape does it have?
Observation 1.1: M031 showed that "the most common cancer" changes with how sites are grouped and whether carcinoma in situ is included. This paper looks at a difference in counting not from the side of sites but from the side of years.
2. Survey and design
Stated honestly: the design was set after seeing the tables and the abstract of the earlier study.
| Content | |
|---|---|
| National series | Cancer Information Service national estimates (1975–2015) and National Cancer Registry (2016–2023) |
| Three-prefecture series | Cancer Information Service high-quality regional observed data (1985–2015) and National Cancer Registry (2016–2023) |
| Yardsticks | Year-on-year ratio of age-standardized incidence (1985 model population), number of sites that rose, range of the previous 10 years |
| Expectation and what was measured | Before the survey the expectation was that the three-prefecture series would be a control not crossing the seam. Reading the file notes, the three-prefecture series also switches to the National Cancer Registry from 2016, so it is not a control. The two series were therefore set side by side, both as series crossing the seam |
3. Data and checks
Calculation 3.1 The 6 retrieved files (3 tables, the table page, and the bibliographic record and page of the earlier study) were fixed by SHA-256, and the following was checked.
- In all three tables, "all ages" for all sites on the number sheet = the sum of the age columns (national estimates 2015: 903,914; three prefectures 2015: 24,926 and 2016: 29,595; National Cancer Registry 2016: 995,131).
- In all three tables, the crude incidence of all sites = cases ÷ population × 100,000 (population: national estimates 2015 127,094,745; three prefectures 2016 3,264,000; National Cancer Registry 2016 126,933,000).
- The table page contains sentences urging caution both about changes around 2015–2016 and about trends in the national estimates.
- The abstract of the earlier study (Tanaka, Arai, and Katanoda, Journal of Epidemiology, 2026) contains the sentence "The ASR incidence in 2016 (the first year of the NCR) was the highest ever recorded."
- The sites common to both series (both sexes, excluding tabulations including in situ) number 17.
4. The year-on-year ratio for all sites
Calculation 4.1 Year-on-year ratio of age-standardized incidence for all sites and number of sites that rose (both sexes, 2004–2023)
| Year | National ratio | Three-prefecture ratio | Sites that rose, national | Sites that rose, three prefectures |
|---|---|---|---|---|
| 2004 | 0.992 | 0.976 | 8 of 17 | 5 of 17 |
| 2005 | 1.010 | 0.997 | 9 of 17 | 8 of 17 |
| 2006 | 1.009 | 1.037 | 9 of 17 | 11 of 17 |
| 2007 | 1.037 | 1.032 | 14 of 17 | 12 of 17 |
| 2008 | 1.043 | 1.004 | 15 of 17 | 10 of 17 |
| 2009 | 1.015 | 1.013 | 10 of 17 | 10 of 17 |
| 2010 | 1.017 | 1.039 | 11 of 17 | 8 of 17 |
| 2011 | 1.049 | 0.976 | 13 of 17 | 5 of 17 |
| 2012 | 0.999 | 1.001 | 6 of 17 | 10 of 17 |
| 2013 | 0.990 | 1.000 | 5 of 17 | 9 of 17 |
| 2014 | 1.001 | 0.985 | 7 of 17 | 6 of 17 |
| 2015 | 1.019 | 0.995 | 11 of 17 | 7 of 17 |
| 2016 | 1.089 | 1.176 | 16 of 17 | 17 of 17 |
| 2017 | 0.967 | 0.954 | 3 of 17 | 3 of 17 |
| 2018 | 0.990 | 0.967 | 7 of 17 | 5 of 17 |
| 2019 | 1.006 | 1.001 | 9 of 17 | 6 of 17 |
| 2020 | 0.935 | 0.956 | 0 of 17 | 7 of 17 |
| 2021 | 1.046 | 1.047 | 15 of 17 | 12 of 17 |
| 2022 | 0.988 | 0.981 | 3 of 17 | 7 of 17 |
| 2023 | 1.001 | 0.985 | 8 of 17 | 7 of 17 |
Observation 4.2: The 2016 year-on-year ratio is 1.089 nationally and 1.176 in the three prefectures, the largest change in 2004–2023 in both series. The next largest is 0.935 in 2020 nationally and 0.954 in 2017 in the three prefectures. The range of the previous 10 years was 0.990–1.049 nationally (maximum in 2011) and 0.976–1.039 in the three prefectures (maximum in 2010).
Observation 4.3: The 2016 value is the highest both nationally (1975–2023) and in the three prefectures (1985–2023) (national 402.0, three prefectures 419.4). For the three prefectures this is already stated in the abstract of the earlier study. In 2017 the rate fell (0.967 nationally, 0.954 in the three prefectures), and in 2023 it is 375.0 nationally (0.933 times 2016) and 374.4 in the three prefectures (0.893 times).
Observation 4.4: The largest national year-on-year ratio in the previous 10 years is 1.049 in 2011. According to the note in the national-estimates file, the criteria for the regional registries used in the national estimates change "from 2011." The shape of a large change in a year when counting changed appears not only in 2016 but once within the national estimates as well.
By sex, the 2016 year-on-year ratio is 1.081 nationally and 1.157 in the three prefectures for men, and 1.098 and 1.201 for women.
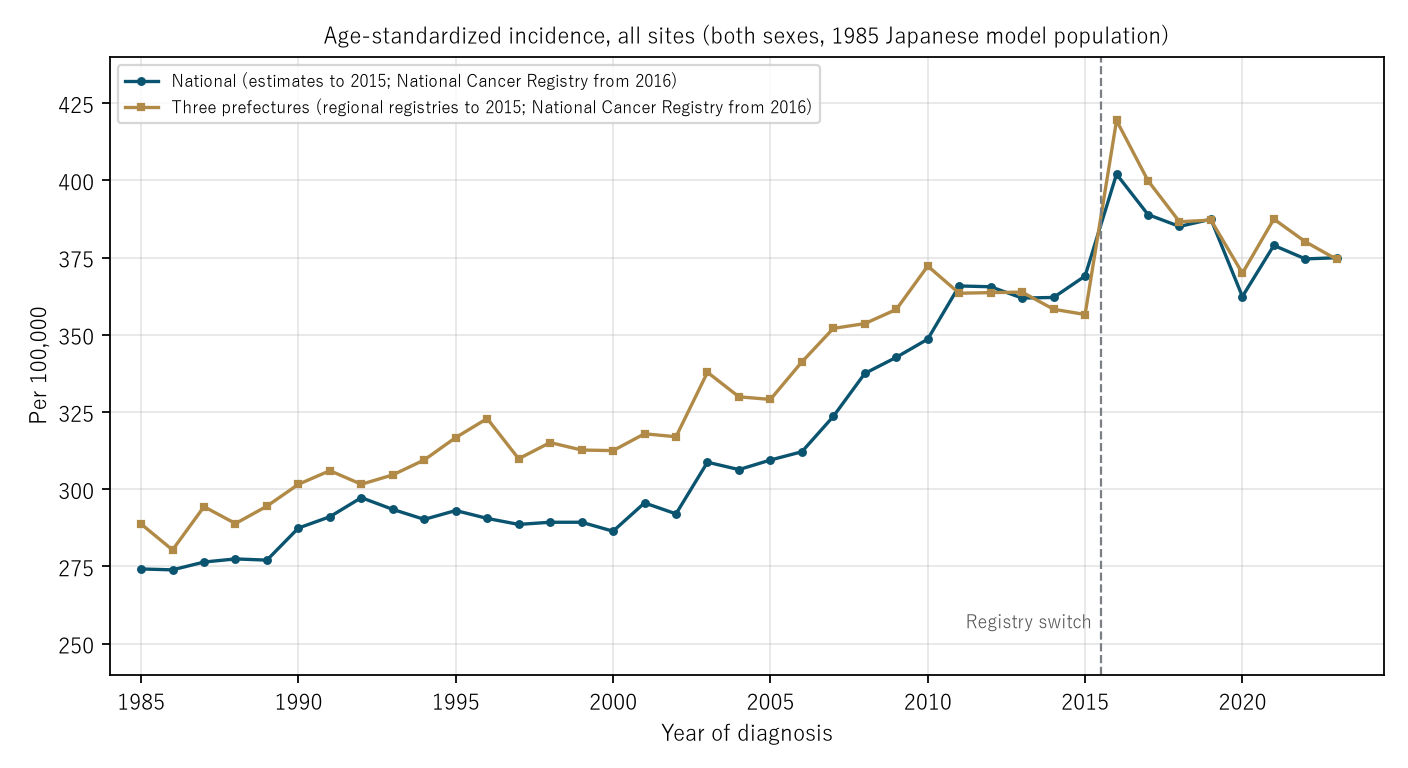
Figure 1: Age-standardized incidence, all sites (both sexes, 1985 Japanese model population). Navy: national (estimates to 2015; National Cancer Registry from 2016). Gold: three prefectures (regional registries to 2015; National Cancer Registry from 2016). The dashed line marks the registry switch.
5. Core — 17 sites rising in the same year
Observation 5.1: In the three prefectures, all 17 sites rose from the previous year in 2016. In other years (2004–2023), the number of sites that rose was 3–12. Nationally too, 16 of the 17 sites rose in 2016 (larynx did not), and 0–15 in other years.
Observation 5.2: In an ordinary year, sites that rise and sites that fall are mixed. In 2016, almost all sites moved in the same direction in the same year. The shape of many sites moving in the same direction at once reads more simply as a change in counting applied to everything at once than as disease movements in each site happening to line up. This paper, however, does not decide between them.
Observation 5.3: Nationally in 2020, all 17 sites fell from the previous year (0 sites rose). This is also a shape of moving in the same direction at once, but this paper does not go into its reasons.
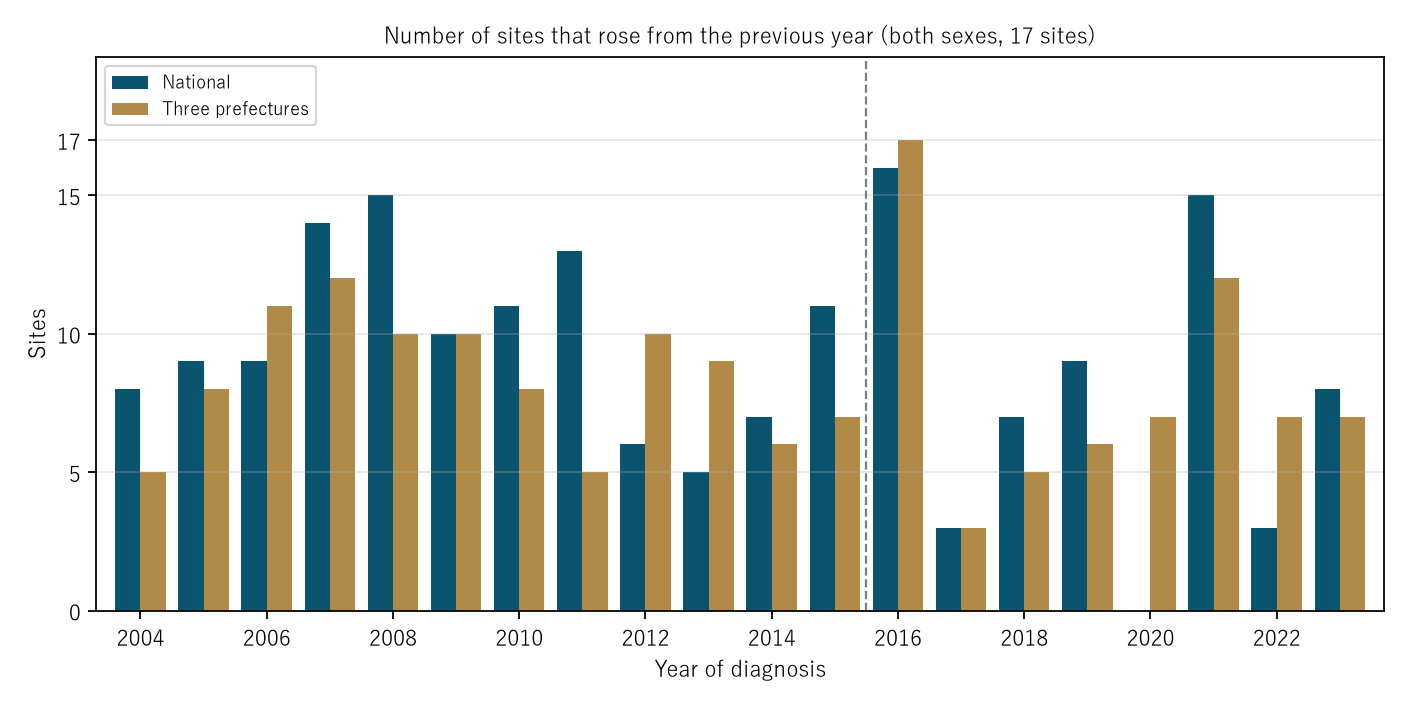
Figure 2: Number of sites that rose from the previous year (both sexes, 17 sites). Navy: national; gold: three prefectures. The dashed line marks the registry switch.
6. Sites and ages
Calculation 6.1 Year-on-year ratio from 2015 to 2016 by site and the range of year-on-year ratios in the previous 10 years (2006–2015) (both sexes)
| Site | National ratio | National, previous 10 years | Three-prefecture ratio | Three prefectures, previous 10 years |
|---|---|---|---|---|
| All sites | 1.089 | 0.990–1.049 | 1.176 | 0.976–1.039 |
| Oral cavity and pharynx | 1.175 | 0.959–1.216 | 1.243 | 0.850–1.139 |
| Esophagus | 1.113 | 0.934–1.076 | 1.131 | 0.863–1.130 |
| Stomach | 1.015 | 0.954–1.029 | 1.078 | 0.932–1.052 |
| Colon | 1.116 | 0.983–1.045 | 1.157 | 0.955–1.086 |
| Liver | 1.045 | 0.907–1.040 | 1.289 | 0.896–1.041 |
| Gallbladder and bile ducts | 1.004 | 0.944–1.034 | 1.210 | 0.876–1.083 |
| Pancreas | 1.069 | 0.989–1.108 | 1.185 | 0.930–1.115 |
| Larynx | 0.940 | 0.880–1.193 | 1.052 | 0.883–1.205 |
| Lung | 1.065 | 0.978–1.067 | 1.252 | 0.931–1.079 |
| Skin | 1.159 | 0.914–1.285 | 1.129 | 0.904–1.217 |
| Bladder | 1.114 | 0.917–1.033 | 1.239 | 0.874–1.057 |
| Kidney and urinary tract (excl. bladder) | 1.092 | 0.968–1.119 | 1.040 | 0.932–1.074 |
| Brain and CNS | 1.113 | 0.914–1.122 | 1.072 | 0.817–1.400 |
| Thyroid | 1.237 | 0.964–1.112 | 1.422 | 0.936–1.153 |
| Malignant lymphoma | 1.109 | 0.956–1.160 | 1.080 | 0.970–1.185 |
| Multiple myeloma | 1.031 | 0.962–1.102 | 1.088 | 0.891–1.164 |
| Leukemia | 1.109 | 0.972–1.103 | 1.100 | 0.879–1.073 |
Observation 6.2: Sites exceeding the maximum of the previous 10 years number 6 nationally (esophagus, colon, liver, bladder, thyroid, leukemia) and 11 in the three prefectures. In 12 of the 17 sites, the jump is larger in the three prefectures. Thyroid is large in both series, 1.237 nationally and 1.422 in the three prefectures. Stomach, at 1.015 nationally, lies within its range for the previous 10 years (0.954–1.029).
Calculation 6.3 Year-on-year ratio from 2015 to 2016 by age (all sites, both sexes)
| Age | National | Three prefectures |
|---|---|---|
| 40–44 | 1.100 | 1.096 |
| 45–49 | 1.044 | 1.252 |
| 50–54 | 1.084 | 1.205 |
| 55–59 | 1.070 | 1.154 |
| 60–64 | 1.084 | 1.184 |
| 65–69 | 1.105 | 1.157 |
| 70–74 | 1.094 | 1.167 |
| 75–79 | 1.079 | 1.176 |
| 80–84 | 1.093 | 1.187 |
Observation 6.4: In all 9 age groups from 40 to 84, the year-on-year ratio exceeds 1 in both series (national 1.044–1.105, three prefectures 1.096–1.252). The jump is not concentrated at any one age.
7. Limitations
- It does not split the jump into a part due to counting and a part due to disease. That would need data counting the same people under both systems.
- It does not go into the reasons for movements within the National Cancer Registry from 2016 (the 2017 fall, the 2020 fall).
- The national series before 2015 consists of estimates. The table page says that, because estimation methods and included regions differ by year, caution is needed in examining trends.
- The three-prefecture series has a small population (3,264,000 in 2016), and rates for less common sites fluctuate from year to year.
- Only the abstract of the earlier study was read. It is not one person's likelihood. The three prefectures are not read against the nation as a comparison of regions.
Conclusion
Age-standardized cancer incidence rose 1.089-fold nationally and 1.176-fold in the three prefectures in 2016. Both are the largest yearly changes in 2004–2023; all 17 sites in the three prefectures and 16 nationally rose in the same year, and every age from 40 to 84 rose. That year is the year incidence counting switched to the National Cancer Registry.
One thing separates them — a seam in how cases are counted, or a movement in disease.
When looking at a trend that says "cancer increased in 2016," check together that counting changed in that year, and how different the shape of the jump is from changes in other years.
Data and reproduction
| Data | Three tables from "Cancer Statistics," Cancer Information Service, National Cancer Center, Japan (national estimates 1975–2015; high-quality regional observed data and National Cancer Registry 1985–2023; National Cancer Registry 2016–2023) (retrieved 25–26 September 2026) |
| Citation form | Cancer Statistics. Cancer Information Service, National Cancer Center, Japan (Monitoring of Cancer Incidence in Japan (MCIJ); National Cancer Registry, Ministry of Health, Labour and Welfare). The English citations are Hori et al. (2015), Tanaka et al. (2026), and the Cancer Information Service entry in the references |
| Scope | Japan (national) and the three prefectures of Yamagata, Fukui, and Nagasaki, 1985–2023 |
| Verification | 検算/M032.py (--zu also writes the figures). Every number in the text is taken from 検算/M032_output.txt |
| Raw data | The 6 retrieved files and SOURCES.md (URLs, retrieval dates, SHA-256, rules of use, copies of notes, definitions and calculation) in data/ |
| Figures | 図/M032_zu1, 図/M032_zu2 (png, svg, English versions) |
References
- Hori, M., Matsuda, T., Shibata, A., Katanoda, K., Sobue, T., & Nishimoto, H. (2015). Cancer incidence and incidence rates in Japan in 2009: a study of 32 population-based cancer registries for the Monitoring of Cancer Incidence in Japan (MCIJ) project. Japanese Journal of Clinical Oncology. 10.1093/jjco/hyv088
- National Cancer Center Japan, Cancer Information Service. Cancer Statistics: tables cancer_incidence(1975-2015).xls (Monitoring of Cancer Incidence in Japan), cancer_incidence3pref(1985-2023).xls, and cancer_incidenceNCR(2016-2023).xls (National Cancer Registry, Ministry of Health, Labour and Welfare) (in Japanese; accessed 26 September 2026). https://ganjoho.jp/reg_stat/statistics/data/dl/index.html
- Tanaka, H., Arai, K., & Katanoda, K. (2026). Updated Trends in Cancer Statistics in Japan: Incidence in 1985–2021 in selected prefectures and Mortality in 1979–2023—Beyond the Launch of the National Cancer Registry in 2016. Journal of Epidemiology. 10.2188/jea.JE20250559
- Yamagishi, Y. (2026). Which Cancer Is "Most Common" Changes with How Sites Are Grouped — For Both Sexes, the Top Site by Cases Is Colorectum When Grouped, Lung When Colon and Rectum Are Split, and Prostate at ICD Four Characters [M031]. Zenodo. https://doi.org/10.5281/zenodo.22972431
Reference
Yamagishi, Y. (2026). The Year Cancer Incidence Jumped, 2016, Is the Year the Registry System Changed [M032]. Zenodo.
DOI: 10.5281/zenodo.22972789
YOI: https://www.yamagishiyuuki.com/yoi/M032
ORCID: 0009-0006-8587-3450
PDF (English) · PDF (Japanese) · Date proof of the English PDF (OpenTimestamps .ots) · SHA256SUMS
The record page for this paper (in Japanese, with the PDFs in each language and the date proof): YOI M032. This paper is a preprint and has not been peer reviewed.