Abstract
This paper asks whether the rise and fall of cancer death rates moves with people born in the same year or happens at all ages in the same year. Using Vital Statistics death rates by site, sex, age (five-year groups), and year (Table 5.25), it finds, for each of 8 age groups from 45 to 84, the year in which the death rate was highest (the peak year), and compares with two spans whether those peaks line up by "year" or by "birth year." It claims no new mathematical theorem and no new law.
First, the "total" rows of Table 5.25 agree with the death rates in Table 5.24 in all 384 cells. The yardstick returned a birth-year span of 0.1 years and a year span of 35.0 years for a model surface determined by birth year alone, and a year span of 0.1 years and a birth-year span of 34.9 years for a surface determined by year alone (Section 3).
Second, this is the core of the paper. For men's liver cancer, all 8 age groups have a peak, and the peak year shifts over 28.5 years, from 1981.2 at ages 45–49 to 2009.7 at ages 80–84, yet the peak birth years fall within 6.5 years, 1927.7–1934.2. The birth-year span ÷ year span is 0.226, the smallest of the 16 series (Section 4).
Third, lung (men and women) and colorectum (men and women) have a peak in all 8 age groups, and their peak-year span (8.2–17.6 years) is narrower than their peak-birth-year span (29.5–31.1 years) — they line up by year. For colorectum in women, all peak years fall within 1990.0–1998.2 (Section 4).
Fourth, 10 of the 16 series could be classified: 4 line up by birth year (liver in men, leukemia in men and women, stomach in men) and 6 by year (lung, colorectum, and rectum in men and women). For 8 of the 10, the classification does not change when any one age group is left out; it changes for stomach (men) and rectum (women) (Section 5).
Fifth, the remaining 6 series cannot be classified with this yardstick. For pancreas (men and women) and breast, the highest year at most ages is 2020 (no peak yet); for stomach (women), uterus, and liver (women), the highest year at most ages is the start of the table (still falling) (Section 4).
Sixth, what separates them is birth year, or year. Year-to-year changes in death rates take a different shape for sites that move with the year of birth and for sites that move at all ages in a given year.
Scope note: This paper claims no new mathematical theorem and no new law — age-specific death rates are published by Vital Statistics; the paper only finds their peak years and rearranges them by birth year. This paper is a structural interpretation of the shape of numbers in published aggregate data, and is not medical advice, diagnosis, or a treatment recommendation. The author is not a physician. For decisions about individual health, consult a physician or medical institution. It is a preprint that has not been peer reviewed. It does not go into why peaks line up by birth year or by year (infection, smoking, diagnosis, treatment, changes in classification, and so on). It does not use a model separating age, period, and cohort at once (an age-period-cohort model) — the three are tied by "year − age = birth year," and separating them at once needs assumptions. This paper compares only the positions of peaks. These are deaths, not incidence. It is not one person's likelihood and does not compare regions. About the data: Vital Statistics on e-Stat is used under the Public Data License (Version 2.0); this paper's peak years, birth years, and spans were produced by processing it. What the paper adds: checking on model surfaces a yardstick that separates "lining up by year" from "lining up by birth year" by two spans, and then applying it to 16 series, showing that the peaks of men's liver cancer gather at birth years 1927.7–1934.2, and listing the series that cannot be classified and why.
1. Notation and question
- Grid: every 5 years from 1950 to 2020 (15 years). Five-year age groups and 5-year steps line up, so birth-year diagonals line up. For liver, following the table note (1950 and 1955 include the biliary tract), the grid starts in 1960.
- Ages: the 8 groups from 45–49 to 80–84 (ages 85 and over are not used, because 90–94 up to 2000 is 90 and over).
- Peak year: for each age group, the vertex year of a quadratic fitted to ln(death rate) at the highest year on the grid and the years before and after it. If the highest year is the first or last on the grid, the peak is not inside the table.
- Peak birth year: peak year − middle of the age group.
- Two spans: for the age groups with a peak, the span of peak years and the span of peak birth years. If the birth-year span is narrower, the series "lines up by birth year"; if the year span is narrower, it "lines up by year." Only series with a peak in 6 or more age groups are classified.
Question: do the peaks of cancer death rates move with birth year, or line up by year? How does this differ by site?
Observation 1.1: M003 showed that one year's age-specific rates line up people born in different years and are not necessarily how the rate moves as one person ages. This paper applies that distinction (year, or birth year) to cancer death rates by site. M024 used the same Table 5.25 to split cancer deaths into population size, age composition, and age-specific rates. This paper looks at whether those age-specific rates themselves move with year or with birth year.
2. Survey and design
Stated honestly: the design was set after seeing the tables.
| Content | |
|---|---|
| Age-specific death rates | Vital Statistics 2024, Volume 1, Table 5.25 (stomach, rectum, liver, pancreas, lung, leukemia, and colorectum for men and women; breast and uterus for women) |
| Check | Same, Table 5.24 death rates by site, sex, and year |
| Yardstick | Two spans of peak years and peak birth years by age, checked first on model surfaces determined by birth year alone or by year alone |
| Expectation and what was measured | Before the survey the plan was to use the highest grid year as the peak year. On a 5-year grid the spans would only be multiples of 5 and differences hard to see, so a quadratic was fitted to the three points around the maximum to get a continuous value |
3. Data and checks
Calculation 3.1 The 2 retrieved files were fixed by SHA-256, and the following was checked.
- Table 5.25 has 16 series (site × sex) and 24 years (1950–2024; every 5 years for 1950–2010 and every year from 2014). The grid has 15 years, 1950–2020.
- The "total" row of Table 5.25 = the death rate for the same site, sex, and year in Table 5.24 (384 cells, 0 mismatches).
Calculation 3.2 Checking the yardstick (model surfaces, 8 age groups)
| Model | Span of peak years | Span of peak birth years | Slope of peak year on age |
|---|---|---|---|
| Determined by birth year alone | 35.0 years | 0.1 years | 1.00 |
| Determined by year alone | 0.1 years | 34.9 years | 0.00 |
Observation 3.3: The same procedure brings the birth-year span to nearly 0 on the surface determined by birth year alone, and the year span to nearly 0 on the surface determined by year alone. The yardstick does not confuse the two.
4. Peaks by series
Calculation 4.1 Peak years and peak birth years by series (ages 45–84, grid 1950–2020, liver from 1960)
| Series | Age groups with a peak | Peak years (span) | Peak birth years (span) | Birth-year span ÷ year span | Classification |
|---|---|---|---|---|---|
| Stomach, men | 6 | 1954.4–1976.1 (21.7) | 1888.7–1907.4 (18.7) | 0.860 | Aligned by birth year |
| Stomach, women | 4 | — | — | — | Not classified (highest year first in grid 4, last 0) |
| Rectum, men | 8 | 1979.7–1997.0 (17.3) | 1905.0–1942.8 (37.7) | 2.183 | Aligned by year |
| Rectum, women | 6 | 1956.6–1976.9 (20.3) | 1894.6–1918.6 (24.0) | 1.183 | Aligned by year |
| Liver, men | 8 | 1981.2–2009.7 (28.5) | 1927.7–1934.2 (6.5) | 0.226 | Aligned by birth year |
| Liver, women | 1 | — | — | — | Not classified (highest year first in grid 7, last 0) |
| Pancreas, men | 4 | — | — | — | Not classified (highest year first in grid 0, last 4) |
| Pancreas, women | 2 | — | — | — | Not classified (highest year first in grid 0, last 6) |
| Lung, men | 8 | 1987.3–2005.0 (17.6) | 1920.2–1950.5 (30.3) | 1.720 | Aligned by year |
| Lung, women | 8 | 1983.4–1999.1 (15.7) | 1917.1–1948.2 (31.1) | 1.985 | Aligned by year |
| Leukemia, men | 7 | 1971.5–2012.2 (40.7) | 1924.5–1936.7 (12.2) | 0.300 | Aligned by birth year |
| Leukemia, women | 8 | 1970.3–2014.1 (43.8) | 1915.5–1937.1 (21.6) | 0.494 | Aligned by birth year |
| Colorectum, men | 8 | 1990.1–2003.9 (13.8) | 1913.6–1943.1 (29.5) | 2.140 | Aligned by year |
| Colorectum, women | 8 | 1990.0–1998.2 (8.2) | 1913.0–1943.0 (30.0) | 3.643 | Aligned by year |
| Breast, women | 4 | — | — | — | Not classified (highest year first in grid 0, last 4) |
| Uterus, women | 3 | — | — | — | Not classified (highest year first in grid 5, last 0) |
Observation 4.2: For men's liver cancer, the peak year shifts over 28.5 years while the peak birth years fall within 6.5 years. The birth-year span ÷ year span is 0.226, the smallest of the 10 classified series. The largest is colorectum in women, 3.643.
Calculation 4.3 Peaks by age for men's liver and men's lung cancer
| Age | Liver: peak year | Liver: peak birth year | Lung: peak year | Lung: peak birth year |
|---|---|---|---|---|
| 45–49 | 1981.2 | 1934.2 | 1997.5 | 1950.5 |
| 50–54 | 1984.8 | 1932.8 | 2000.4 | 1948.4 |
| 55–59 | 1989.6 | 1932.6 | 1987.3 | 1930.3 |
| 60–64 | 1994.1 | 1932.1 | 1990.7 | 1928.7 |
| 65–69 | 1997.8 | 1930.8 | 1993.9 | 1926.9 |
| 70–74 | 2002.7 | 1930.7 | 1995.7 | 1923.7 |
| 75–79 | 2006.3 | 1929.3 | 1997.2 | 1920.2 |
| 80–84 | 2009.7 | 1927.7 | 2005.0 | 1923.0 |
Observation 4.4: For men's liver cancer, the older the age group, the later the peak year (slope of peak year on age 0.83), and the peak birth years stay between 1934.2 and 1927.7. For men's lung cancer, peak years at ages 55–79 fall within 1987.3–1997.2, while the peak birth years of the 8 age groups spread over 1920.2–1950.5. Men's liver cancer death rate at ages 65–69 was 83.9 in 1960, 164.8 in 2000 near the peak, and 43.5 in 2020.
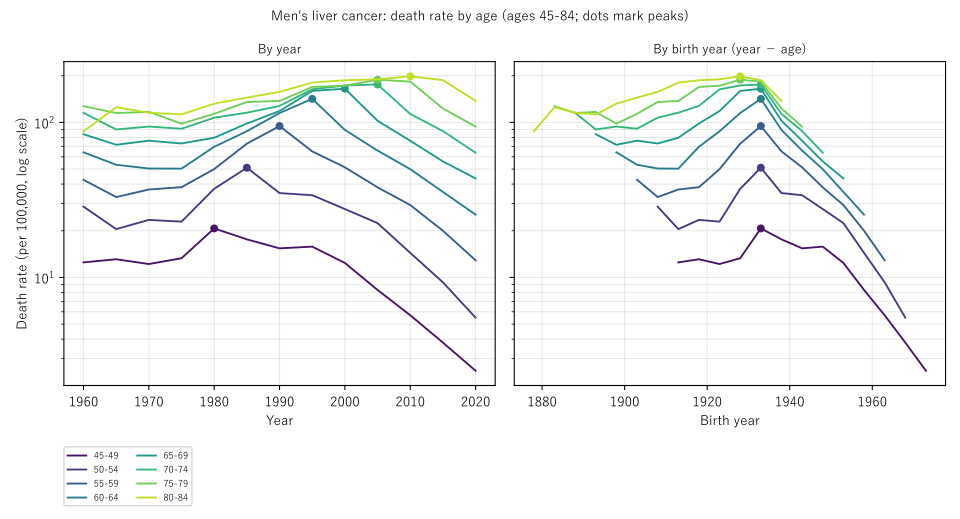
Figure 1: Men's liver cancer death rates by age (ages 45–84, log scale, dots mark peaks). Left: by year; right: by birth year (year − age). On the right the peaks stand in a column near one birth year.
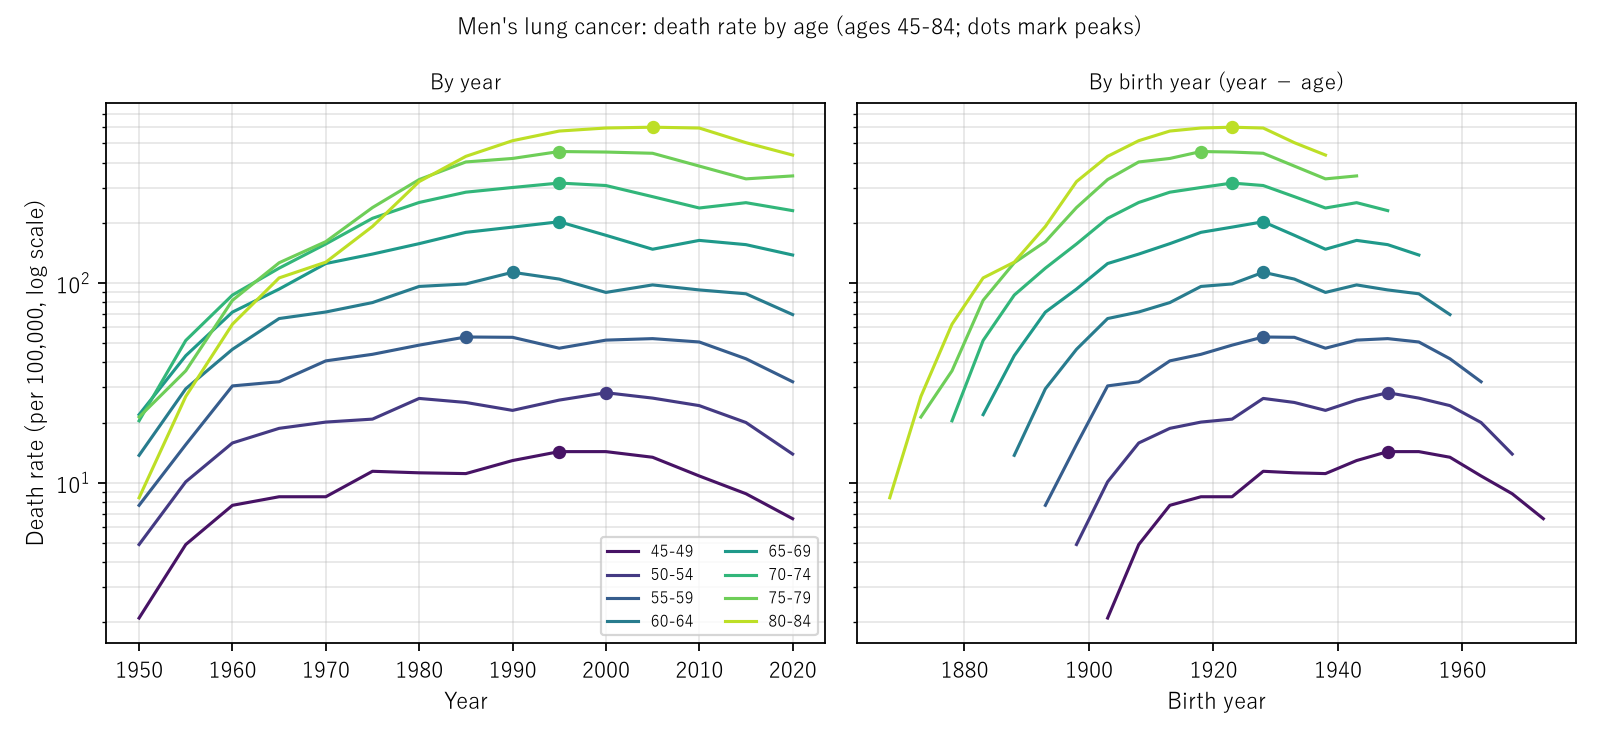
Figure 2: Men's lung cancer death rates by age (drawn the same way). The peaks gather on the year axis on the left and scatter on the birth-year axis on the right.
Observation 4.5: Six series cannot be classified with this yardstick. For pancreas (men and women) and breast, the highest year at most ages is the last on the grid (2020): the peak has not yet come. For stomach (women), uterus, and liver (women), the highest year at most ages is the first on the grid: the rate has fallen since the start of the table. A yardstick comparing peak positions cannot be used for series whose peaks lie outside the table.
5. Does the classification change when one age group is left out?
Calculation 5.1 Classification when each age group with a peak is left out in turn (as many ways as age groups with a peak)
| Series | Ways | Ways that change the classification | Range of birth-year span ÷ year span |
|---|---|---|---|
| Colorectum, women | 8 | 0 | 3.226–6.016 |
| Colorectum, men | 8 | 0 | 1.216–3.580 |
| Leukemia, women | 8 | 0 | 0.315–0.520 |
| Leukemia, men | 7 | 0 | 0.257–0.358 |
| Rectum, women | 6 | 1 | 0.398–2.094 |
| Rectum, men | 8 | 0 | 1.961–2.389 |
| Liver, men | 8 | 0 | 0.192–0.226 |
| Lung, women | 8 | 0 | 1.876–2.318 |
| Lung, men | 8 | 0 | 1.561–2.320 |
| Stomach, men | 6 | 1 | 0.249–1.536 |
Observation 5.2: For 8 of the 10 series, the classification does not change whichever single age group is left out. Men's liver stays on the birth-year side with ratios of 0.192–0.226. Lung and colorectum keep ratios above 1 throughout. The classification changes for stomach (men) and rectum (women), and this paper does not assert a classification for those two.
6. Limitations
- It does not go into why peaks line up. Infection, smoking, diagnosis, treatment, changes in classification — this paper examined none of them.
- It does not use a model separating age, period, and cohort at once. The yardstick looks only at the positions of peaks.
- The grid is 5 years by 5 years of age. Peak birth years carry a width of about ±2.5 years, and the quadratic fit rests on only three points.
- Figures from 2017 and earlier differ from older reports because of re-aggregation after reporting omissions (table note).
- These are deaths, not incidence. It is not one person's likelihood. It does not compare regions.
Conclusion
In Vital Statistics age-specific death rates for 1950–2020, the peak of men's liver cancer came in later years at older ages, and at every age lay with people born around 1927.7–1934.2. For lung and colorectum, the span of peak years was narrower than the span of peak birth years in every series: they lined up by year. Pancreas and breast have not yet peaked, and stomach (women), uterus, and liver (women) keep falling, so they could not be classified by peak position.
One thing separates them — birth year, or year.
When hearing that "the death rate from this cancer has fallen," check together whether it fell at all ages in some year, or moved with people born in some year as they grew older.
Data and reproduction
| Data | Vital Statistics 2024 (final data), Volume 1, Tables 5.25 and 5.24 (e-Stat, retrieved 26 September 2026) |
| Terms of use | e-Stat follows the Public Data License (Version 2.0). This paper's peak years, birth years, and spans were produced by processing these and are not figures produced by the government |
| Scope | Japan, 1950–2020 (every 5 years) |
| Verification | 検算/M033.py (--zu also writes the figures). Every number in the text is taken from 検算/M033_output.txt |
| Raw data | The 2 retrieved files and SOURCES.md (URLs, retrieval dates, SHA-256, terms of use, table notes, definitions and calculation) in data/ |
| Figures | 図/M033_zu1, 図/M033_zu2 (png, svg, English versions) |
References
- Ministry of Health, Labour and Welfare. Vital Statistics 2024 (final data), Volume 1, Tables 5.24 and 5.25 (in Japanese). e-Stat (accessed 26 September 2026). https://www.e-stat.go.jp/
- Yamagishi, Y. (2026). Life Expectancy Is Not the Number of Years Anyone Actually Lives [M003]. Zenodo. https://doi.org/10.5281/zenodo.22963485
- Yamagishi, Y. (2026). Cancer Deaths Rose While the Age-Adjusted Rate Fell — the Push from the Age Composition Ranges from 1.433 Times for Breast to 2.918 Times for Prostate [M024]. Zenodo. https://doi.org/10.5281/zenodo.22968432
Reference
Yamagishi, Y. (2026). The Peaks of Men's Liver Cancer Death Rates Line Up by Birth Year, While Those of Lung and Colorectal Cancer Line Up by Year [M033]. Zenodo.
DOI: 10.5281/zenodo.22972855
YOI: https://www.yamagishiyuuki.com/yoi/M033
ORCID: 0009-0006-8587-3450
PDF (English) · PDF (Japanese) · Date proof of the English PDF (OpenTimestamps .ots) · SHA256SUMS
The record page for this paper (in Japanese, with the PDFs in each language and the date proof): YOI M033. This paper is a preprint and has not been peer reviewed.