Abstract
This paper checks how the distribution of systolic blood pressure moved over the years — whether only the mean fell, or the shape of the high tail changed as well — using the tables of blood pressure distributions and of means and standard deviations in 8 rounds of the National Health and Nutrition Survey (2013, 2014, 2015, 2017, 2018, 2019, 2022, and 2023). The cells are men and women × ages 50–59, 60–69, and 70+ (6 cells × 8 rounds = 48). It claims no new mathematical theorem and no new law.
First, the tables agree with each other. In all 32 tables, the sum of the classes equals the total, the total equals the count in the table of means, and the percentages equal count ÷ total (Section 3).
Second, this is the core of the paper. The share of people with systolic blood pressure of 140 or above is nearly determined by that year's mean in that cell alone. The difference between the share fitted by putting the mean into a normal distribution and the actual share averages −2.28 points with a spread of 1.76 points (48 cells, including people on medication). Adding each year's standard deviation narrows the spread only to 1.66, while fitting without the year — using the cell's average over the 8 rounds — gives 5.16. The remaining differences are of the size of sampling variation (spread of difference ÷ sampling variation 0.63) (Section 5).
Third, the decade's change is also accounted for by the mean. Comparing 2013–2015 with 2022–2023, the mean fell by 2.6 to 5.1 mmHg in all 6 cells; the fall in the share at 140 or above sums to −60.0 points, and its difference of −7.3 from the −52.7 expected from the fall in the mean alone lies within the rough range (± 11.6) (Section 6).
Fourth, the largest drop in the mean between adjacent rounds falls in 2018→2019 in 4 of the 6 cells. From that year, a non-mercury sphygmomanometer has been used (note in the 2019 overview). In the age-adjusted values in the table notes as well, the share of men at 140 or above fell from 28.0% in 2018 to 23.0% in 2019 (Section 7).
Fifth, no change in the shape of the distribution is visible across the device change — the average difference from the mean-only fit is −2.09 in the mercury rounds and −2.60 in the non-mercury rounds, a difference of −0.51 within the rough range (± 1.03) (Section 7).
Sixth, what separates them is whether the mean moved, or the shape changed. The fall in the share at 140 or above visible over this decade is nearly accounted for by the distribution sliding down as a whole while keeping its shape. How much of that fall is due to the device change, however, cannot be separated from these tables.
Scope note: This paper claims no new mathematical theorem and no new law — the counts, means, and standard deviations are in the tables of the National Health and Nutrition Survey; the paper only puts them into a normal distribution and compares. This paper is a structural interpretation of the shape of numbers in published aggregate data, and is not medical advice, diagnosis, or a treatment recommendation. The author is not a physician. For decisions about individual health, consult a physician or medical institution. It is a preprint that has not been peer reviewed. It does not go into why blood pressure fell (diet, treatment, measurement, and so on). The effect of the device change from 2019 cannot be separated — the tables used here contain no measurements of the same people before and after the change. It does not judge whether one person's blood pressure is high. Ages 40–49 and below are not used, because some rounds have fewer than 10 people at 140 or above. Years with only nationally corrected tables (2012, 2016, 2024) are not used. Prefectures and regions are not compared. About the data: the National Health and Nutrition Survey on e-Stat is used under the Public Data License (Version 2.0), and the Ministry of Health, Labour and Welfare overview under the Public Data License (Version 1.0); this paper's shares, fits, and differences were produced by processing them. What the paper adds: checking over 48 cells that the share at 140 or above is nearly determined by the mean alone, and comparing the decade's fall with the part explained by a shift of the mean, and counting, cell by cell, that the largest drop in the mean coincides with the year of the device change.
1. Notation and question
- Share at 140 or above: the number of people from 140–149 up to 180 or above in the distribution of systolic blood pressure ÷ total.
- Normal fit: 1 − Φ((140 − μ)/σ) from that year's mean μ and standard deviation σ. Mean-only fit: σ fixed at the cell's average over the 8 rounds. Fit without the year: the cell's average share over the 8 rounds.
- Difference ÷ sampling variation: (actual − fitted) ÷ √(p(1−p)/n). If its spread is below 1, the remaining difference is of the size of sampling variation.
- Mercury-device rounds: 2013, 2014, 2015, 2017, 2018. Non-mercury-device rounds: 2019, 2022, 2023.
Question: is the change in the share of people at 140 or above accounted for by a shift in the mean of the distribution? Did the shape of the distribution change?
Observation 1.1: M002 showed that the speed at which adult death rates double with age hardly moved, and that what fell was the level. This paper separates, for the distribution of blood pressure, whether the mean or the shape moved. M039 compared definitions of "people with hypertension" in the single 2023 survey. This paper looks at the time side.
2. Survey and design
Stated honestly: the design was set after seeing the tables.
| Content | |
|---|---|
| Counts, means, SDs | Tables of the distributions of systolic and diastolic blood pressure and of means and standard deviations (including and excluding people on medication) in 8 rounds of the National Health and Nutrition Survey (2013, 2014, 2015, 2017, 2018, 2019, 2022, 2023) |
| Change in measurement | Overview of the 2019 National Health and Nutrition Survey (note on page 21) |
| Yardsticks | Share at 140 or above; normal fits (mean and SD, mean only, without the year); rough ranges |
| Cells | Men and women × 50–59, 60–69, 70+. Ages 40–49 are not used because some rounds have fewer than 10 people at 140 or above |
| Question and what was noticed | The inventory's question was "does the tail shrink at the same speed as the mean falls?" Along the way, it was noticed that the large drop in the mean falls in 2018→2019, and that the device changed that year (note in the overview) |
3. Data and checks
Calculation 3.1 The 33 retrieved files (32 tables and 1 overview) were fixed by SHA-256, and the following was checked.
- The survey year, the treatment of people on medication (included/excluded), and the kind of table of the 32 tables match what was read. In all 8 rounds, the classes of systolic blood pressure (11) and the age groups are the same.
- Sum of classes in the distribution table = total = count in the table of means. Percentages = count ÷ total (rounded half up to one decimal).
- In the 6 cells used, the number of people at 140 or above is 10 or more in every round (minimum 18). Ages 40–49 have a round with 5.
- The page "3. Blood pressure" of the 2019 overview (page 21 of the booklet) states that from 2019 a non-mercury sphygmomanometer was used.
4. Means and the share at 140 or above by year
Calculation 4.1 Mean systolic blood pressure (mmHg, including people on medication)
| Year | Men 50–59 | Men 60–69 | Men 70+ | Women 50–59 | Women 60–69 | Women 70+ |
|---|---|---|---|---|---|---|
| 2013 | 134.9 | 138.1 | 141.5 | 126.5 | 137.1 | 140.1 |
| 2014 | 134.5 | 138.7 | 139.8 | 125.4 | 135 | 138.5 |
| 2015 | 133.1 | 137.9 | 137.8 | 127.2 | 132.5 | 137.8 |
| 2017 | 133.4 | 138.2 | 140.9 | 125.1 | 134.7 | 138.4 |
| 2018 | 134.1 | 138.8 | 140.3 | 126.9 | 132.2 | 138.5 |
| 2019 | 131.7 | 135.8 | 135.8 | 123.7 | 131 | 136.1 |
| 2022 | 128.7 | 133.3 | 136.7 | 122.1 | 128.5 | 134 |
| 2023 | 130.6 | 133.5 | 137.6 | 122.6 | 130.8 | 135.6 |
Calculation 4.2 Share at 140 or above (%, including people on medication)
| Year | Men 50–59 | Men 60–69 | Men 70+ | Women 50–59 | Women 60–69 | Women 70+ |
|---|---|---|---|---|---|---|
| 2013 | 34.4 | 43.8 | 53.0 | 20.5 | 41.5 | 48.3 |
| 2014 | 38.4 | 43.3 | 45.1 | 18.8 | 37.2 | 42.9 |
| 2015 | 28.1 | 44.6 | 42.1 | 23.4 | 32.2 | 41.8 |
| 2017 | 30.1 | 44.0 | 50.4 | 17.9 | 36.0 | 44.2 |
| 2018 | 33.7 | 43.4 | 47.9 | 20.5 | 30.4 | 44.8 |
| 2019 | 31.3 | 36.1 | 35.7 | 16.2 | 28.2 | 41.7 |
| 2022 | 20.2 | 32.1 | 41.5 | 15.6 | 19.8 | 34.4 |
| 2023 | 24.2 | 29.2 | 38.8 | 13.3 | 26.9 | 37.0 |
Observation 4.3: Even within one cell, the values go up and down between rounds (for example, the share of men aged 70+ at 140 or above is 53.0% in 2013, 42.1% in 2015, and 50.4% in 2017). One cell in one round has a few hundred people, so comparing only adjacent rounds is pulled by sampling variation.
5. Core — the share at 140 or above is nearly determined by the mean
Calculation 5.1 Differences between normal fits and the actual share (points, 48 cells)
| People on medication | Mean and SD: average difference | Mean and SD: spread | Mean only: average difference | Mean only: spread | Without the year: spread | Difference ÷ sampling variation: spread |
|---|---|---|---|---|---|---|
| Included | -2.16 | 1.66 | -2.28 | 1.76 | 5.16 | 0.63 |
| Excluded | -2.35 | 2.03 | -2.49 | 1.95 | 4.63 | 0.60 |
Observation 5.2: Over the 48 cells including people on medication, the spread of the difference between the share at 140 or above fitted from the mean alone and the actual share is 1.76 points, less than half that of the fit without the year (5.16). Adding each year's standard deviation narrows it only to 1.66. Most of the difference between years in the share at 140 or above is accounted for by the difference in that year's mean. The same holds when people on medication are excluded (1.95 and 4.63).
Observation 5.3: The actual share is on average 2.28 points below the fitted value (2.49 excluding people on medication). This means the shape of the distribution differs a little from a normal distribution, and this difference does not move much between years (Section 7). The remaining spread, 0.63 as difference ÷ sampling variation, is below 1 and of the size of sampling variation.
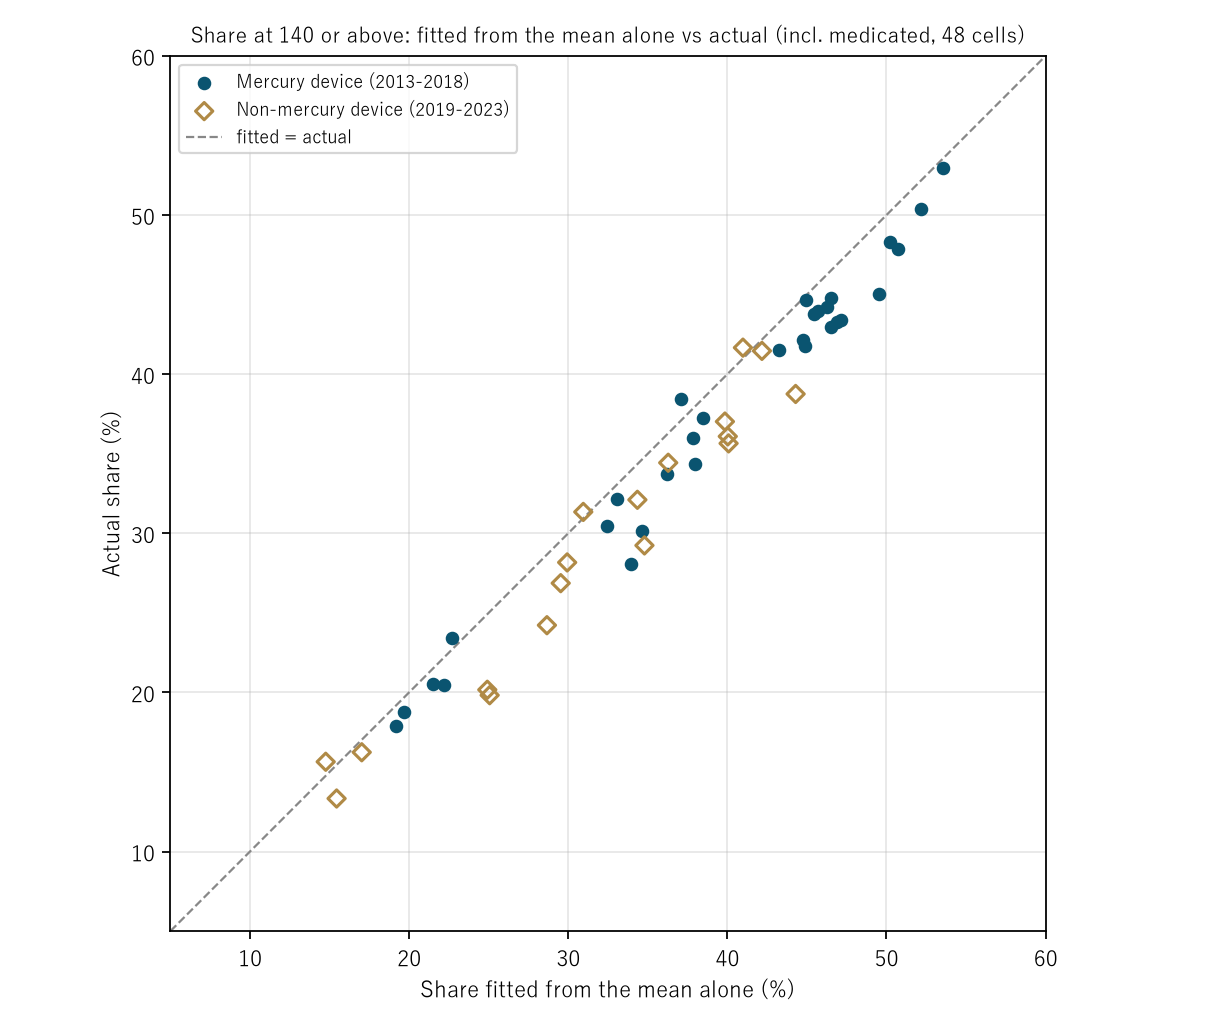
Figure 1: Horizontal: share at 140 or above fitted from the mean alone; vertical: actual share (48 cells including people on medication). Navy circles: mercury-device rounds; gold diamonds: non-mercury rounds. The points line up in one band slightly below the diagonal.
6. The decade's change is accounted for by a shift of the mean
Calculation 6.1 Comparison of 2013–2015 (3 rounds) with 2022–2023 (2 rounds) combined (including people on medication)
| Cell | Mean (mmHg) | Share at 140 or above (%) | Change in share (points) | Change expected from the mean alone |
|---|---|---|---|---|
| Men, 50–59 | 134.2 → 129.8 (-4.4) | 34.1 → 22.5 | -11.6 | -9.4 |
| Men, 60–69 | 138.2 → 133.4 (-4.8) | 43.9 → 30.5 | -13.4 | -11.2 |
| Men, 70+ | 139.7 → 137.2 (-2.6) | 46.8 → 40.1 | -6.7 | -6.1 |
| Women, 50–59 | 126.3 → 122.4 (-4.0) | 20.9 → 14.3 | -6.5 | -6.1 |
| Women, 60–69 | 134.9 → 129.7 (-5.1) | 36.9 → 23.6 | -13.3 | -10.7 |
| Women, 70+ | 138.8 → 134.8 (-4.0) | 44.3 → 35.7 | -8.6 | -9.1 |
| Sum of 6 | -60.0 (± 11.6) | -52.7 |
Observation 6.2: The mean fell in all 6 cells (by 2.6 to 5.1 mmHg); the fall in the share at 140 or above sums to −60.0 points, and its difference of −7.3 from the −52.7 expected from the fall in the mean alone lies within the rough range (± 11.6). Excluding people on medication, −47.0 against −42.7 (difference −4.4, ± 14.2). The fall in the share at 140 or above over this decade is accounted for by the distribution sliding down while keeping its shape.
7. The year the device changed
Calculation 7.1 Change in the mean between adjacent rounds (mmHg, including people on medication)
| Period | Men 50–59 | Men 60–69 | Men 70+ | Women 50–59 | Women 60–69 | Women 70+ |
|---|---|---|---|---|---|---|
| 2013→2014 | -0.4 | +0.6 | -1.7 | -1.1 | -2.1 | -1.6 |
| 2014→2015 | -1.4 | -0.8 | -2.0 | +1.8 | -2.5 | -0.7 |
| 2015→2017 | +0.3 | +0.3 | +3.1 | -2.1 | +2.2 | +0.6 |
| 2017→2018 | +0.7 | +0.6 | -0.6 | +1.8 | -2.5 | +0.1 |
| 2018→2019 | -2.4 | -3.0 | -4.5 | -3.2 | -1.2 | -2.4 |
| 2019→2022 | -3.0 | -2.5 | +0.9 | -1.6 | -2.5 | -2.1 |
| 2022→2023 | +1.9 | +0.2 | +0.9 | +0.5 | +2.3 | +1.6 |
| Largest drop | 2019→2022 | 2018→2019 | 2018→2019 | 2018→2019 | 3 tied at -2.5 | 2018→2019 |
Observation 7.2: The largest drop in the mean between adjacent rounds falls in 2018→2019 in 4 of the 6 cells (also 4 when people on medication are excluded). The change in the mean in 2018→2019 is a drop in all 6 cells (−1.2 to −4.5). From that year, a non-mercury sphygmomanometer has been used. In the age-adjusted values in the table notes as well, the share of men at 140 or above went from 28.0% in 2018 to 23.0% in 2019, and the mean from 130.3 to 127.6 mmHg.
Observation 7.3: No change in the shape of the distribution is visible across the device change. The average difference from the mean-only fit is −2.09 in the mercury rounds and −2.60 in the non-mercury rounds; the difference of −0.51 lies within the rough range (± 1.03) (excluding people on medication, −2.44 and −2.58).
Observation 7.4: These tables cannot separate how much of the 2018→2019 drop is due to the device change. If blood pressure itself fell in the same year as the change, the tables would look the same. As M035 found a step in heart disease deaths in the year of an instruction on the death certificate, a step in the numbers coincides with a change in how things are measured.
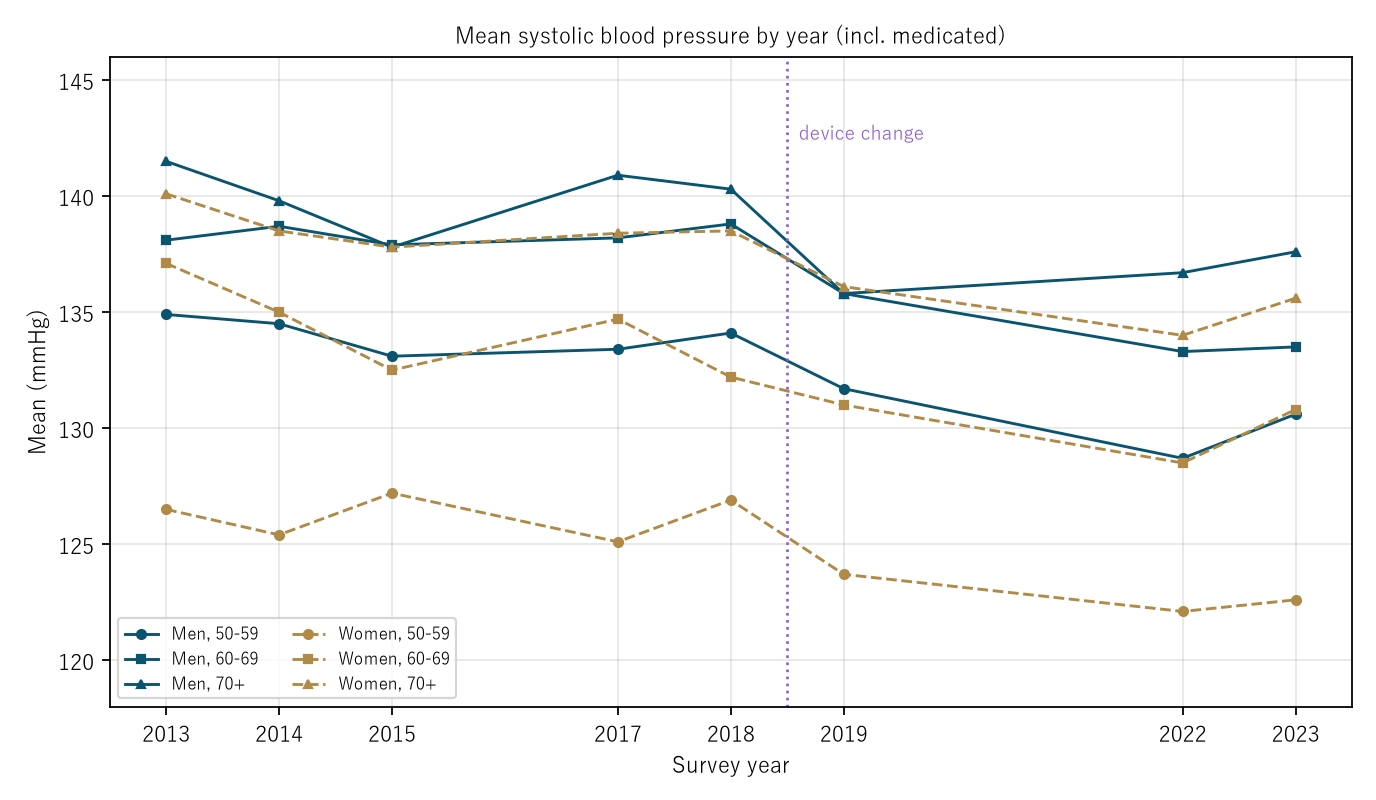
Figure 2: Mean systolic blood pressure in the 6 cells (including people on medication). Solid lines: men; dashed lines: women. The purple dotted line marks the device change (between 2018 and 2019).
8. Limitations
- Within the 2018→2019 drop, the effect of the device change and a change in blood pressure itself cannot be separated.
- The normal distribution is a fitting tool and does not represent the shape of the distribution itself (the actual share is on average 2.28 points lower).
- The rough ranges treat the survey as a simple random sample; the true range can be wider.
- Differences between rounds in the age composition within a cell (for example, the share of people at higher ages within 70+) are not separated.
- Only the 6 cells aged 50 and over are examined. It is not one person's likelihood.
Conclusion
Across 8 surveys from 2013 to 2023 at ages 50 and over, the share of people with systolic blood pressure of 140 or above is nearly determined by that year's mean alone (spread of the difference from the fitted value 1.76 points, against 5.16 without the year). The decade's fall in the share (−60.0 points summed over 6 cells) also matches, within sampling variation, the −52.7 expected from the fall in the mean. And the largest drop in the mean came, in 4 of the 6 cells, in 2018→2019, the year the device changed.
One thing separates them — whether the mean moved, or the shape changed.
When hearing that "fewer people have high blood pressure," check together whether the whole distribution slid, whether only the high side shrank, and whether the measurement stayed the same.
Data and reproduction
| Data | Tables of blood pressure distributions and of means and standard deviations (including/excluding people on medication, 32 tables) in the National Health and Nutrition Survey 2013, 2014, 2015, 2017, 2018, 2019, 2022, and 2023 (e-Stat, retrieved 26 September 2026), and the overview of the 2019 National Health and Nutrition Survey (Ministry of Health, Labour and Welfare, retrieved the same day) |
| Terms of use | e-Stat follows the Public Data License (Version 2.0), and the Ministry's pages the Public Data License (Version 1.0). This paper's shares, fits, and differences were produced by processing these and are not figures produced by the government |
| Scope | Japan; survey participants aged 50 and over whose blood pressure was measured; 8 rounds |
| Verification | 検算/M040.py (--zu also writes the figures). Every number in the text is taken from 検算/M040_output.txt |
| Raw data | The 33 retrieved files and SOURCES.md (URLs, retrieval dates, SHA-256, terms of use, definitions and calculation) in data/ |
| Figures | 図/M040_zu1, 図/M040_zu2 (png, svg, English versions) |
References
- Ministry of Health, Labour and Welfare. National Health and Nutrition Survey 2013, Tables 27-1 to 27-4; 2014, Tables 22-1 to 22-4; 2015, Tables 22-1 to 22-4; 2017, Tables 24-1 to 24-4; 2018, Tables 23-1 to 23-4; 2019, Tables 23-1 to 23-4; 2022, Tables 23-1 to 23-4; 2023, Tables 23-1 to 23-4 (in Japanese). e-Stat (accessed 26 September 2026). https://www.e-stat.go.jp/
- Ministry of Health, Labour and Welfare. Overview of the results of the 2019 National Health and Nutrition Survey (in Japanese) (accessed 26 September 2026). https://www.mhlw.go.jp/content/10900000/000687163.pdf
- Yamagishi, Y. (2026). The Speed at Which Adult Death Rates Double with Age Hardly Moved; What Fell Was the Level [M002]. Zenodo. https://doi.org/10.5281/zenodo.22963210
- Yamagishi, Y. (2026). Heart Disease Deaths Fell by More Than a Tenth in Each of Two Years, 1994 and 1995 — The Years of an Instruction on the Death Certificate; Only Heart Failure Fell (0.377-Fold from 1990 to 1995), While Acute Myocardial Infarction Rose 1.645-Fold [M035]. Zenodo. https://doi.org/10.5281/zenodo.22973433
- Yamagishi, Y. (2026). The Share of "People with Hypertension" Moves 2.32-Fold with the Height of the Line and How Medication Is Counted — From 27.6% to 64.2% of Adults Aged 20+ in the 2023 Survey; Lowering the Line Adds More at Ages 20–49, Counting Medication Adds More at 70+ [M039]. Zenodo. https://doi.org/10.5281/zenodo.22974218
Reference
Yamagishi, Y. (2026). The Share of People with Systolic Blood Pressure of 140 or Above Is Nearly Determined by That Year's Mean [M040]. Zenodo.
DOI: 10.5281/zenodo.22974334
YOI: https://www.yamagishiyuuki.com/yoi/M040
ORCID: 0009-0006-8587-3450
PDF (English) · PDF (Japanese) · Date proof of the English PDF (OpenTimestamps .ots) · SHA256SUMS
The record page for this paper (in Japanese, with the PDFs in each language and the date proof): YOI M040. This paper is a preprint and has not been peer reviewed.