Abstract
This paper checks how much the share of people meant by the one phrase "people with hypertension" moves with the height of the line (140/90 or 130/80) and with how people taking blood-pressure-lowering medication are counted, using the counts in the tables of the 2023 National Health and Nutrition Survey (Tables 22-1 and 22-2, 23-1 and 23-3, and 56). It claims no new mathematical theorem and no new law.
First, the counts agree across tables. The 1577 people not on medication (Table 22-2) plus the 774 on medication make the 2351 in Table 56, and the 346 people at 140/90 or above in Table 22-2 equal the 1120 people with hypertension minus the 774 on medication. The 651 people measured at 140/90 or above are the sum of the 439 who crossed on systolic alone and the 212 with diastolic 90 or above (Section 3).
Second, for adults aged 20 and over (both sexes), the share of "people with hypertension" is 27.6% if measured 140/90 or above, 47.6% if 140/90 or on medication (the survey's definition), 54.6% if measured 130/80 or above, and 64.2% if 130/80 or on medication; the widest definition is 2.32 times the narrowest. This ratio is larger at younger ages (3.41 at 20–49, 2.18 at 70+) (Section 4).
Third, this is the core of the paper. What lowering the line to 130/80 adds and what counting people on medication adds swap sizes with age. At ages 20–49, lowering the line adds 15.4 points and counting medication 2.6; at 70+, 12.7 against 33.3. At 60–69, 19.4 and 21.4, and the rough 95% ranges overlap (Section 5).
Fourth, 60.6–61.1% of people on medication measure below 140/90 (59.4–70.0% across age groups). Counting only measured values leaves these people out (Section 6).
Fifth, which value crosses 140/90 also differs by age. At 20–49, 40.0% crossed on the diastolic value alone and 25.0% on the systolic alone; at 70+, 83.8% on the systolic alone and 3.1% on the diastolic alone (Section 7).
Sixth, what separates them is the height of the line, or how medication is counted. For the same "people with hypertension," where the line is drawn moves the share most at younger ages, and whether people on medication are counted moves it most at older ages.
Scope note: This paper claims no new mathematical theorem and no new law — the counts are in the tables of the National Health and Nutrition Survey; the paper only adds and subtracts them under different lines. This paper is a structural interpretation of the shape of numbers in published aggregate data, and is not medical advice, diagnosis, or a treatment recommendation. The author is not a physician. For decisions about individual health, consult a physician or medical institution. It is a preprint that has not been peer reviewed. It does not argue which line is right — it does not go into the grounds for the height of the line or thresholds for starting treatment. It does not judge whether one person's blood pressure is high — the survey uses the mean of two readings on one day, which differs from diagnostic procedure. The shares are those of the survey participants and are not aligned to the national age composition. Age groups were combined so that no cell the paper divides out has fewer than 10 people. Prefectures and regions are not compared. About the data: the National Health and Nutrition Survey on e-Stat is used under the Public Data License (Version 2.0); this paper's shares, differences, and rough ranges were produced by processing them. What the paper adds: setting the shares under four definitions side by side for the same people, splitting the differences into what lowering the line adds and what counting medication adds, and showing that their sizes swap with age, and checking what each definition contains through agreement of counts across tables (people not on medication; the contents of grades I–III).
1. Notation and question
- Measured 140/90: people with grade I, II, or III hypertension in Table 22-1 (people on medication also counted by their measured values).
- 140/90 or medication: people with hypertension in Table 56 (systolic 140 or above, or diastolic 90 or above, or taking blood-pressure-lowering medication).
- Measured 130/80: people with elevated blood pressure and grades I–III in Table 22-1.
- 130/80 or medication: people with hypertension plus people with elevated blood pressure in Table 56 (systolic 130–139 and/or diastolic 80–89, not on medication).
- Lowering the line: 130/80 or medication − 140/90 or medication (difference in %, points). Counting medication: 140/90 or medication − measured 140/90.
- Rough 95% range: 1.96 × √(p(1−p)/n), treating the survey as a simple random sample.
Question: how much, and at which ages, does the share of "people with hypertension" move with the height of the line and with how medication is counted?
Observation 1.1: M007 showed that the one phrase "5-year survival" points to three different numbers. This paper checks the same for the one phrase "people with hypertension."
2. Survey and design
Stated honestly: the design was set after seeing the tables.
| Content | |
|---|---|
| Counts | 2023 National Health and Nutrition Survey, Table 22-1 (blood pressure classification of the Japanese Society of Hypertension, including people on medication), Table 22-2 (same, excluding them), Table 56 (people with hypertension) |
| Checks | Tables 23-1 and 23-3 (distributions of systolic and diastolic pressure), percentages in each table |
| Yardsticks | Shares under four definitions, lowering the line, counting medication, rough 95% range |
| Grouping | Both sexes: 20–49, 50–59, 60–69, 70+; by sex: 20–59, 60–69, 70+. Chosen so that no cell the paper divides out has fewer than 10 people |
| Noticed along the way | That many people at younger ages cross 140/90 on the diastolic value alone was noticed while matching Table 23 against the count of isolated systolic hypertension |
3. Data and checks
Calculation 3.1 The 5 retrieved files were fixed by SHA-256, and the following was checked.
- Percentages in Tables 22 and 56 = count ÷ total (one decimal place). Sum of classes = total; men + women = total.
- The counts of people not on medication agree across the two tables: 1577 people not on medication (Table 22-2) + 774 on medication = 2351 (Table 56). Grades I–III in Table 22-2, 346 = 1120 people with hypertension − 774 on medication. The counts of normal, high-normal, and elevated also match "others," high-normal, and elevated in Table 56.
- Grades I–III = isolated systolic hypertension + diastolic 90 or above (Table 23): including people on medication, 651 = 439 + 212; excluding them, 346 = 198 + 148. Grades I–III are the people with "systolic 140 or above, or diastolic 90 or above."
- The total in Table 22-1 is 4 larger than in Table 56 (people who did not answer the medication question).
4. Four definitions
Calculation 4.1 Shares under four definitions (both sexes, %)
| Age | Measured 140/90 | 140/90 or medication | Measured 130/80 | 130/80 or medication | Widest ÷ narrowest | On medication | People (Table 22, Table 56) |
|---|---|---|---|---|---|---|---|
| All ages | 27.6 | 47.6 | 54.6 | 64.2 | 2.32× | 32.9 | 2355, 2351 |
| 20–49 | 7.5 | 10.1 | 24.3 | 25.5 | 3.41× | 3.7 | 535, 534 |
| 50–59 | 24.4 | 35.5 | 54.1 | 59.0 | 2.41× | 18.5 | 401, 400 |
| 60–69 | 31.0 | 52.4 | 60.9 | 71.8 | 2.32× | 33.7 | 504, 504 |
| 70+ | 39.0 | 72.3 | 69.0 | 85.0 | 2.18× | 55.9 | 915, 913 |
Observation 4.2: For ages 20 and over, the share of "people with hypertension" moves from 27.6% to 64.2%, and the widest definition is 2.32 times the narrowest. The survey's definition (140/90 or medication), 47.6%, lies between them.
Observation 4.3: This ratio is smaller at older ages (3.41 at 20–49, 2.41 at 50–59, 2.32 at 60–69, 2.18 at 70+). At younger ages, the share differs by more than 3 times depending on the definition.
Calculation 4.4 By sex
| Sex, age | Measured 140/90 | 140/90 or medication | Measured 130/80 | 130/80 or medication | Widest ÷ narrowest | On medication | People (Table 22, Table 56) |
|---|---|---|---|---|---|---|---|
| Men, All ages | 31.8 | 54.8 | 62.0 | 72.5 | 2.28× | 38.2 | 1029, 1026 |
| Men, 20–59 | 21.1 | 27.8 | 49.3 | 51.9 | 2.46× | 11.5 | 375, 374 |
| Men, 60–69 | 33.9 | 60.2 | 64.4 | 77.1 | 2.27× | 42.8 | 236, 236 |
| Men, 70+ | 40.2 | 76.0 | 72.0 | 88.5 | 2.20× | 59.6 | 418, 416 |
| Women, All ages | 24.4 | 42.1 | 48.8 | 57.8 | 2.37× | 28.8 | 1326, 1325 |
| Women, 20–59 | 10.5 | 16.4 | 28.9 | 31.8 | 3.02× | 9.1 | 561, 560 |
| Women, 60–69 | 28.4 | 45.5 | 57.8 | 67.2 | 2.37× | 25.7 | 268, 268 |
| Women, 70+ | 38.0 | 69.2 | 66.4 | 82.1 | 2.16× | 52.7 | 497, 497 |
Observation 4.5: For both sexes, widest ÷ narrowest is largest at 20–59 (2.46 for men, 3.02 for women).
5. Core — the line at younger ages, medication at older ages
Calculation 5.1 Lowering the line and counting medication (points; ± is the rough 95% range)
| Sex, age | Lowering the line | Counting medication | Larger | Ranges overlap |
|---|---|---|---|---|
| Both sexes, All ages | 16.6 (± 1.5) | 20.0 (± 1.6) | Counting medication | No |
| Both sexes, 20–49 | 15.4 (± 3.1) | 2.6 (± 1.4) | Lowering the line | No |
| Both sexes, 50–59 | 23.5 (± 4.2) | 11.1 (± 3.1) | Lowering the line | No |
| Both sexes, 60–69 | 19.4 (± 3.5) | 21.4 (± 3.6) | Counting medication | Yes |
| Both sexes, 70+ | 12.7 (± 2.2) | 33.3 (± 3.1) | Counting medication | No |
| Men, All ages | 17.7 (± 2.3) | 23.0 (± 2.6) | Counting medication | No |
| Men, 20–59 | 24.1 (± 4.3) | 6.7 (± 2.5) | Lowering the line | No |
| Men, 60–69 | 16.9 (± 4.8) | 26.3 (± 5.6) | Counting medication | Yes |
| Men, 70+ | 12.5 (± 3.2) | 35.8 (± 4.6) | Counting medication | No |
| Women, All ages | 15.7 (± 2.0) | 17.7 (± 2.1) | Counting medication | Yes |
| Women, 20–59 | 15.4 (± 3.0) | 5.9 (± 2.0) | Lowering the line | No |
| Women, 60–69 | 21.6 (± 4.9) | 17.2 (± 4.5) | Lowering the line | Yes |
| Women, 70+ | 12.9 (± 2.9) | 31.2 (± 4.1) | Counting medication | No |
Observation 5.2: For both sexes at 20–49, lowering the line adds 15.4 and counting medication 2.6; at 70+, 12.7 against 33.3 — the larger one swaps. At both ages the two rough ranges do not overlap.
Observation 5.3: Counting medication adds more at older ages (2.6, 11.1, 21.4, 33.3), while lowering the line adds the most at 50–59 (23.5). At 60–69, 19.4 and 21.4: the rough ranges overlap and the two are about the same size. By sex as well, the line is larger at 20–59 and medication at 70+, and at 60–69 the ranges overlap for both sexes.
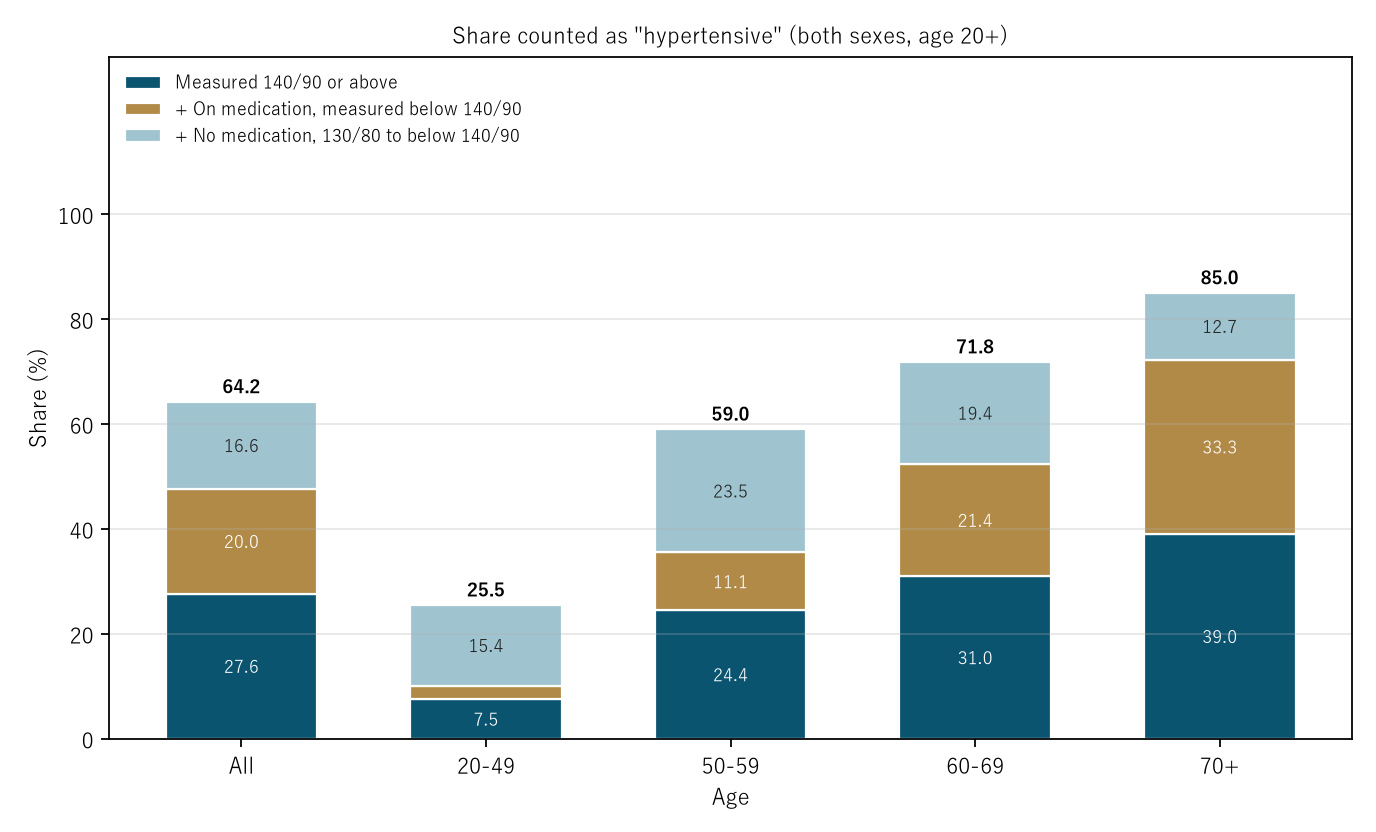
Figure 1: Navy: measured 140/90 or above; gold: on medication and measured below 140/90 (counting medication); light blue: not on medication and 130/80 to below 140/90 (lowering the line). The number above each bar is the share for 130/80 or medication. Light blue is thick at younger ages and gold at older ages.
6. Measured values of people on medication
Calculation 6.1 People on medication measured below 140/90 (both sexes)
| Age | On medication | Measured below 140/90 | Share of those on medication (%) |
|---|---|---|---|
| All ages | 774 | 469–473 | 60.6–61.1 |
| 20–49 | 20 | 14–15 | 70.0–75.0 |
| 50–59 | 74 | 44–45 | 59.5–60.8 |
| 60–69 | 170 | 108 | 63.5 |
| 70+ | 510 | 303–305 | 59.4–59.8 |
Cells with a range reflect the people who did not answer the medication question (present only in Table 22-1), whose side cannot be determined.
Observation 6.2: 60.6–61.1% of people on medication measure below 140/90 (59.4–70.0% across age groups). A definition that counts only measured values does not include these people among "people with hypertension." This share within people on medication changes relatively little with age, while the share on medication itself rises from 3.7% at 20–49 to 55.9% at 70+. That is why counting medication adds more at older ages.
7. Which value crossed 140/90
Calculation 7.1 Breakdown of people measured at 140/90 or above (both sexes)
| Age | Measured 140/90 or above (people) | Systolic only | Both | Diastolic only |
|---|---|---|---|---|
| All ages | 651 | 439 (67.4%) | 143 (22.0%) | 69 (10.6%) |
| 20–49 | 40 | 10 (25.0%) | 14 (35.0%) | 16 (40.0%) |
| 50–59 | 98 | 29 (29.6%) | 42 (42.9%) | 27 (27.6%) |
| 60–69 | 156 | 101 (64.7%) | 40 (25.6%) | 15 (9.6%) |
| 70+ | 357 | 299 (83.8%) | 47 (13.2%) | 11 (3.1%) |
Observation 7.2: The share crossing on the systolic value alone is larger at older ages, and the share crossing on the diastolic value alone is smaller. At 20–49, diastolic only (40.0%) exceeds systolic only (25.0%); at 70+, systolic only is 83.8% and diastolic only 3.1%. "140/90" is two lines: at younger ages the diastolic line, at older ages the systolic line, does the counting.
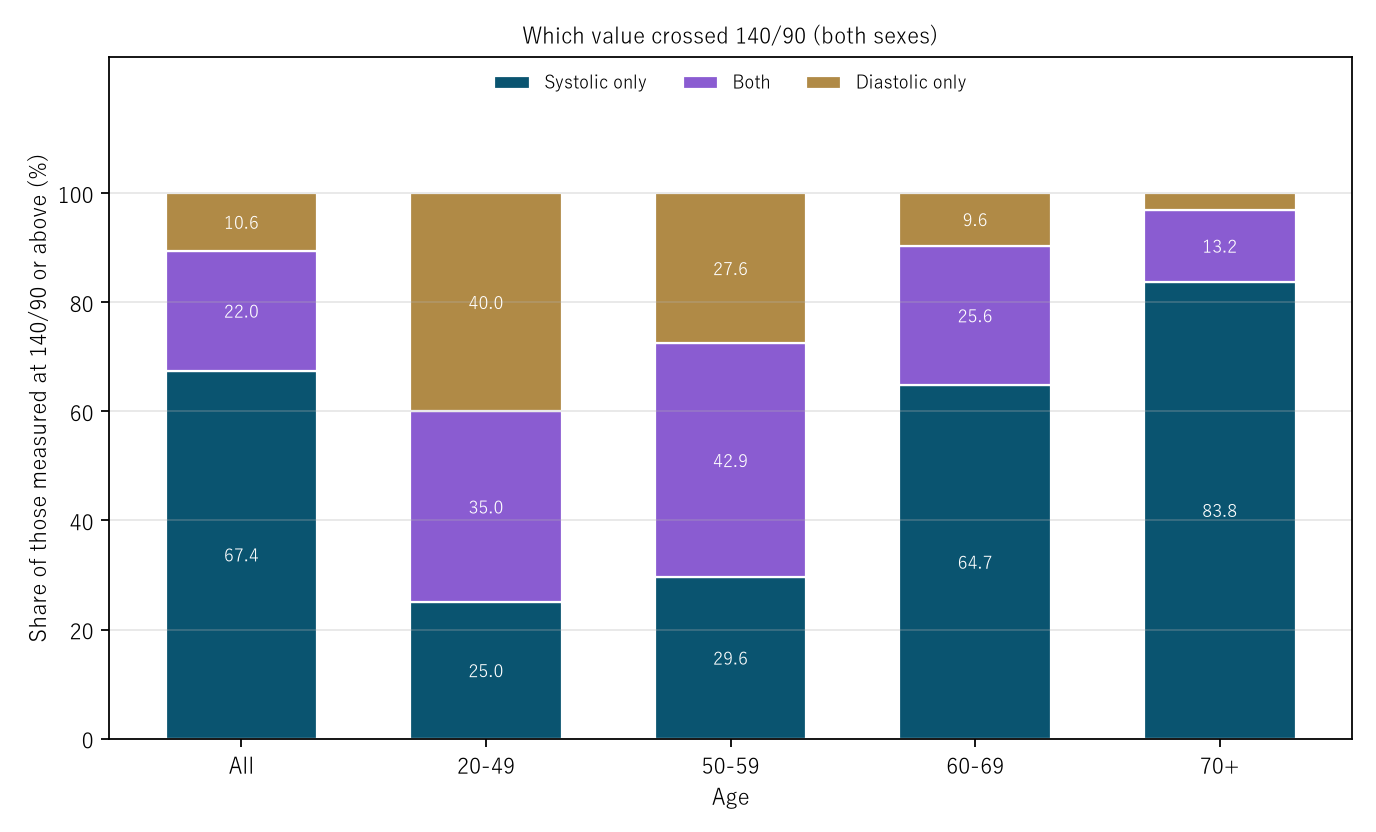
Figure 2: People measured at 140/90 or above, split into systolic only (navy), both (purple), and diastolic only (gold).
8. Limitations
- The shares are those of the survey participants and are not aligned to the national age composition (the overall share depends on the participants' age composition).
- The rough ranges treat the survey as a simple random sample; the true range for a survey that samples districts can be wider.
- The mean of two readings on one day differs from diagnostic procedure (such as readings on different days). Medication is an answer to an interview question.
- Only one survey, 2023, is examined. Changes over years are not covered.
- It does not argue which definition is right. It is not one person's likelihood.
Conclusion
Among adults aged 20 and over in the 2023 survey, the share of "people with hypertension" moves 2.32-fold, from 27.6% measured at 140/90 or above to 64.2% for 130/80 or medication. What lowering the line adds and what counting people on medication adds swap sizes: 15.4 against 2.6 at 20–49, and 12.7 against 33.3 at 70+.
One thing separates them — the height of the line, or how medication is counted.
When hearing that "X in 10 people have hypertension," check together where the line is drawn, whether people on medication are counted, and which ages are meant.
Data and reproduction
| Data | 2023 National Health and Nutrition Survey, Tables 22-1, 22-2, 23-1, 23-3, and 56 (e-Stat, retrieved 26 September 2026) |
| Terms of use | e-Stat follows the Public Data License (Version 2.0). This paper's shares, differences, and rough ranges were produced by processing these and are not figures produced by the government |
| Scope | Japan; survey participants aged 20 and over whose blood pressure was measured |
| Verification | 検算/M039.py (--zu also writes the figures). Every number in the text is taken from 検算/M039_output.txt |
| Raw data | The 5 retrieved files and SOURCES.md (URLs, retrieval dates, SHA-256, terms of use, definitions and calculation) in data/ |
| Figures | 図/M039_zu1, 図/M039_zu2 (png, svg, English versions) |
References
- Ministry of Health, Labour and Welfare. National Health and Nutrition Survey 2023, Tables 22-1, 22-2, 23-1, 23-3, and 56 (in Japanese). e-Stat (accessed 26 September 2026). https://www.e-stat.go.jp/
- Yamagishi, Y. (2026). "5-Year Survival" Is One Phrase for Three Different Numbers [M007]. Zenodo. https://doi.org/10.5281/zenodo.22964570
Reference
Yamagishi, Y. (2026). The Share of "People with Hypertension" Moves 2.32-Fold with the Height of the Line and How Medication Is Counted [M039]. Zenodo.
DOI: 10.5281/zenodo.22974218
YOI: https://www.yamagishiyuuki.com/yoi/M039
ORCID: 0009-0006-8587-3450
PDF (English) · PDF (Japanese) · Date proof of the English PDF (OpenTimestamps .ots) · SHA256SUMS
The record page for this paper (in Japanese, with the PDFs in each language and the date proof): YOI M039. This paper is a preprint and has not been peer reviewed.