Abstract
In 2017, pneumonia deaths fell from 119,346 in 2016 to 96,859. This paper checks how much of this fall is accounted for by the change in the classification of causes of death (application of the 2013 version of ICD-10 and the clarification of how the underlying cause is selected), and where the lost deaths went, using Table 5.13 of the Vital Statistics (short list of causes × year) and the Ministry of Health, Labour and Welfare's comparison that recoded the same death records under the new and old classifications (about 1/7 of the 2016 deaths, 186,820 records). It claims no new mathematical theorem and no new law.
First, the comparison table is internally consistent: new/old ratio = new ÷ old, parent items = sum of children, and the total is 186,820 records under both (Section 3).
Second, this is the core of the paper. The actual step in 2017 for each cause (2017 ÷ 2016, divided by the growth in the neighbouring years) is nearly predicted by the ratio from counting the same death records under the new and old classifications. Across 65 causes without subdivisions, the correlation of the logarithms is 0.969 and the slope of the fitted line is 0.992; the spread of step ÷ ratio, 0.033, is about the same as the year-to-year variation of causes with almost no classification change (0.030) (Section 4).
Third, for pneumonia, the actual step is 0.826 against a new/old ratio of 0.810. Of the fall of 22,487 deaths from 2016 to 2017, 2,151 are due to the neighbouring growth and 22,267 to the classification change (0.990) (Section 5).
Fourth, even combining pneumonia, aspiration pneumonia, and senility, the sum does not continue. On the same death records, the sum of the three goes from 35,763 to 31,334 (new/old ratio 0.876), and the actual step in 2017 of the sum of the three is 0.900 (Section 6).
Fifth, the lost deaths moved to other causes. On the same death records, pneumonia lost 3,283 and aspiration pneumonia 891, while vascular and unspecified dementia (+874), Alzheimer's disease (+506), heart failure (+486), chronic obstructive pulmonary disease (+451), and others gained. That pneumonia deaths fell below senility and cerebrovascular diseases in 2017 also does not happen when converted back with the ratios (Section 7).
Sixth, what separates them is whether the classification changed, or the disease changed. The fall in pneumonia in 2017 is nearly accounted for not by fewer people dying of pneumonia but by a change in which cause the same deaths, written on the same death certificates, are counted under.
Scope note: This paper claims no new mathematical theorem and no new law — the effect of the classification change was compared on the same death records and published by the Ministry of Health, Labour and Welfare, and the 2017 overview states that the main factor in the fall in pneumonia was the clarification of the rules for selecting the underlying cause. The paper only matches those ratios against the actual year-to-year steps by cause. This paper is a structural interpretation of the shape of numbers in published aggregate data, and is not medical advice, diagnosis, or a treatment recommendation. The author is not a physician. For decisions about individual health, consult a physician or medical institution. It is a preprint that has not been peer reviewed. It does not argue which classification is right. It does not evaluate those who write death certificates or those who set the classification — it only lays out the movement of the numbers in the year the rules changed. It does not go into the fall in pneumonia from 2020 on. The new/old ratios come from a comparison of about 1/7 of the 2016 deaths and need not be the same across years or ages. Prefectures and regions are not compared. About the data: the Vital Statistics on e-Stat are used under the Public Data License (Version 2.0), and the Ministry's documents under the Public Data License (Version 1.0); this paper's steps, correlations, and breakdowns were produced by processing them. What the paper adds: showing that the new/old ratios on the same death records predict the actual 2017 steps of 65 causes one to one, and splitting the fall in pneumonia into the part due to the neighbouring growth and the part due to the classification change, and laying out where the lost deaths went.
1. Notation and question
- New/old ratio: the number counted on the same death records under the classification based on ICD-10 (2013 version) ÷ the number under the (2003 version). From Table 3 of the Ministry's comparison (about 1/7 of the 2016 death records, 186,820 records).
- Step in 2017: (2017 ÷ 2016) ÷ √(2016 ÷ 2015 × 2018 ÷ 2017). Dividing by the growth in the neighbouring years, it comes near 1 if the classification did not change.
- Causes compared: items of the short list of causes of death without subdivisions, with 3,000 or more deaths in 2016 (65 items).
Question: how much of the fall in pneumonia in 2017 is accounted for by the classification change? Where did the lost deaths go?
Observation 1.1: M035 showed that the step in heart disease deaths in 1994 and 1995 coincided with the years of an instruction on the death certificate, and that only heart failure fell. This paper measures a step of the same type, for pneumonia in 2017, with the ratios from recoding the same death records. M020 showed that the ranking of causes of death swaps with age structure and classification. Section 7 of this paper is one example on the classification side.
2. Survey and design
Stated honestly: the design was set after seeing the tables.
| Content | |
|---|---|
| Deaths | Vital Statistics 2024, Volume 1, Table 5.13 (short list of causes × year; every year from 2014 to 2024) |
| Ratio of the classification change | Table 3 (deaths by the short list before and after the revision) of the Ministry's "Effects of the partial revision of ICD-10 on cause-of-death statistics" |
| Official explanation | Note in the "Summary of results" of the 2017 overview of monthly vital statistics annual estimates |
| Yardsticks | Step in 2017, new/old ratio, correlation and slope of the logarithms, breakdown of the fall in pneumonia |
| Expectation and what was measured | At the inventory stage, the year of application and the content of the change were written from memory, and it was decided to check them against the original sources before writing. The original sources contained a comparison recoding the same death records under the new and old classifications. Seeing that this could serve as a yardstick, the cause-by-cause matching was designed |
3. Data and checks
Calculation 3.1 The 3 retrieved files were fixed by SHA-256, and the following was checked.
- The text of the effects document states that the revised classification has been applied to cause-of-death statistics from 2017, that the comparison used 1/7 of the 2016 deaths (1,307,748), 186,820 records, and, as a main effect of the revision, that pneumonia and aspiration pneumonia deaths decreased because conditions considered to cause pneumonia and aspiration pneumonia were added to the way the underlying cause is selected.
- The total of Table 3 is 186,820 under both. New/old ratio = new ÷ old × 100 (one decimal, all items). Parent items = sum of child items.
- The note in the 2017 overview states that the main factor in the fall in "pneumonia" in 2017 is considered to be the clarification of the rules for selecting the underlying cause under ICD-10 (2013 version), applied from January 2017.
- In Table 5.13, aspiration pneumonia in 2016 and earlier is the number for basic code "J69 pneumonitis due to solids and liquids" (table note). Aspiration pneumonia + interstitial lung disease + others = other diseases of the respiratory system (15 years).
4. Core — the 2017 step is nearly predicted by the new/old ratio
Calculation 4.1 Causes with a new/old ratio outside 0.90–1.10, and senility (2016 deaths of 3,000 or more)
| Cause | 2016 | 2017 | Neighbouring growth | Step in 2017 | New/old ratio |
|---|---|---|---|---|---|
| Acute renal failure | 3,401 | 2,621 | 0.998 | 0.772 | 0.786 |
| Pneumonia | 119,346 | 96,859 | 0.982 | 0.826 | 0.810 |
| Aspiration pneumonia | 38,660 | 35,791 | 1.068 | 0.867 | 0.836 |
| Unspecified renal failure | 5,227 | 4,504 | 1.001 | 0.861 | 0.851 |
| Other diseases of the genitourinary system | 8,957 | 8,251 | 1.082 | 0.851 | 0.878 |
| Sepsis | 11,512 | 10,213 | 1.012 | 0.877 | 0.887 |
| Arrhythmia and conduction disorders | 31,053 | 30,150 | 1.024 | 0.948 | 0.887 |
| Senility | 92,836 | 101,411 | 1.088 | 1.004 | 0.980 |
| Other neoplasms (excluding central nervous system) | 9,005 | 10,316 | 1.017 | 1.127 | 1.134 |
| Falls | 8,030 | 9,673 | 1.001 | 1.203 | 1.171 |
| Other external causes | 6,237 | 7,498 | 1.012 | 1.188 | 1.192 |
| Chronic obstructive pulmonary disease | 15,692 | 18,528 | 0.999 | 1.182 | 1.206 |
| Other infectious and parasitic diseases | 5,234 | 6,102 | 1.025 | 1.138 | 1.209 |
| Other diseases of the nervous system | 10,896 | 14,811 | 1.036 | 1.312 | 1.244 |
| Diseases of the musculoskeletal system and connective tissue | 6,448 | 8,338 | 1.057 | 1.224 | 1.252 |
| Alzheimer's disease | 11,972 | 17,239 | 1.121 | 1.284 | 1.296 |
| Parkinson's disease | 7,546 | 10,123 | 1.061 | 1.264 | 1.301 |
| Vascular and unspecified dementia | 11,898 | 19,551 | 1.060 | 1.551 | 1.509 |
| Hypertensive heart and renal disease | 3,099 | 5,683 | 0.990 | 1.852 | 1.793 |
Observation 4.2: Across 65 causes, the correlation between log(step in 2017) and log(new/old ratio) is 0.969, and the slope of the fitted line is 0.992, close to one to one. The spread of step ÷ ratio, 0.033, is about the same as the year-to-year variation of the 31 items with a ratio of 0.98–1.02 (0.030): what the ratio does not explain is of the size of year-to-year variation. Using only the preceding year or only the following year as the neighbouring growth, the correlation is 0.965 and 0.946.
Observation 4.3: All 18 items with a new/old ratio outside 0.90–1.10 have a 2017 step on the same side of 1. Outside 0.95–1.05, only one item has a step on the opposite side: other hypertensive diseases (ratio 0.945, step 1.017).
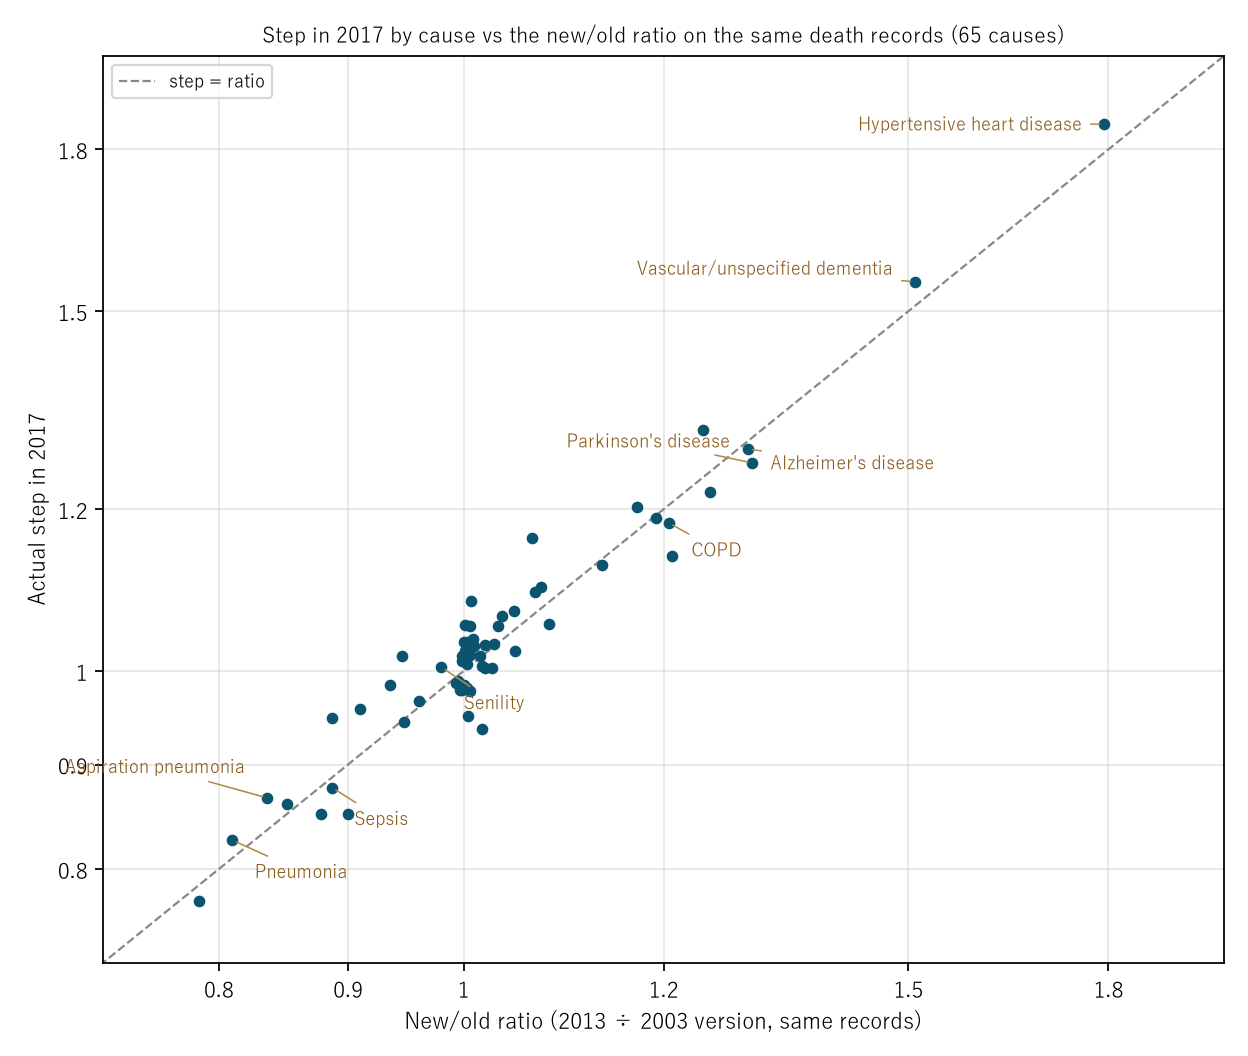
Figure 1: Horizontal: new/old ratio (the same death records counted under the 2013 and 2003 versions); vertical: actual step in 2017 (both on log scales). The points line up along the diagonal (step = ratio).
5. Breakdown of the fall in pneumonia
Calculation 5.1 Pneumonia, 2016 → 2017
| Deaths | |
|---|---|
| 2016 (actual) | 119,346 |
| 2017 with the neighbouring growth 0.982 only | 117,195 |
| 2017 with that times the new/old ratio 0.810 | 94,928 |
| 2017 (actual) | 96,859 |
| Fall (2016 − 2017) | 22,487 |
| of which neighbouring growth | 2,151 |
| of which classification change | 22,267 |
| Remainder | -1,931 |
Observation 5.2: Of the fall of 22,487 pneumonia deaths from 2016 to 2017, 2,151 are due to the neighbouring growth (0.982) and 22,267 to the classification change (new/old ratio 0.810); the classification change accounts for 0.990 of the fall. The difference between the expectation of 94,928 (neighbouring growth times the ratio) and the actual 96,859 is 0.0199 of the 2017 deaths.
6. The sum of pneumonia, aspiration pneumonia, and senility
Observation 6.1: Even combining the three, the sum does not continue. On the same death records, the sum of the three is 35,763 under the old and 31,334 under the new (ratio 0.876). The actual sum of the three is 242,202 in 2015, 250,842 in 2016, 234,061 in 2017, and 242,726 in 2018, and the step in 2017 is 0.900. The deaths removed from pneumonia did not go into senility or aspiration pneumonia (ratio for senility 0.980, aspiration pneumonia 0.836).
7. Where did the lost deaths go?
Calculation 7.1 Causes with large differences between new and old on the same death records (items without subdivisions; the comparison is about 1/7 of the 2016 deaths)
| Cause | New (2013 version) | Old (2003 version) | Difference | New/old ratio (old = 100) |
|---|---|---|---|---|
| Pneumonia | 13,993 | 17,276 | -3,283 | 81.0 |
| Aspiration pneumonia | 4,541 | 5,432 | -891 | 83.6 |
| Arrhythmia and conduction disorders | 3,957 | 4,459 | -502 | 88.7 |
| Senility | 12,800 | 13,055 | -255 | 98.0 |
| Sepsis | 1,529 | 1,723 | -194 | 88.7 |
| Vascular and unspecified dementia | 2,592 | 1,718 | +874 | 150.9 |
| Alzheimer's disease | 2,215 | 1,709 | +506 | 129.6 |
| Heart failure | 10,919 | 10,433 | +486 | 104.7 |
| Chronic obstructive pulmonary disease | 2,641 | 2,190 | +451 | 120.6 |
| Other diseases of the nervous system | 1,961 | 1,576 | +385 | 124.4 |
| Hypertensive heart and renal disease | 814 | 454 | +360 | 179.3 |
| Parkinson's disease | 1,379 | 1,060 | +319 | 130.1 |
| Diseases of the musculoskeletal system and connective tissue | 1,179 | 942 | +237 | 125.2 |
| Other symptoms, signs and abnormal findings, not elsewhere classified | 2,905 | 2,688 | +217 | 108.1 |
| Falls | 1,331 | 1,137 | +194 | 117.1 |
Observation 7.2: The largest loss is pneumonia (−3,283), and the largest gain is vascular and unspecified dementia (+874). The loss of pneumonia and aspiration pneumonia (−4,174) is 0.677 of the sum of losses (−6,168). Of the gains, dementia, Alzheimer's disease, Parkinson's disease, and other diseases of the nervous system account for +2,084 (0.338 of the sum of gains), heart failure and hypertensive heart disease for +846 (0.137), and chronic obstructive pulmonary disease for +451 (0.073). The effects document gives, as the reason for this movement, that conditions considered to cause pneumonia and aspiration pneumonia were added to the way the underlying cause is selected.
Calculation 7.3 Pneumonia, senility, and cerebrovascular diseases in 2017
| Cause | 2016 | 2017 | 2017 ÷ new/old ratio (expectation as if counted under the 2003 version) |
|---|---|---|---|
| Pneumonia | 119,346 | 96,859 | 119,579 |
| Senility | 92,836 | 101,411 | 103,481 |
| Cerebrovascular diseases | 109,353 | 109,896 | 107,953 |
Observation 7.4: In the actual 2017 deaths, pneumonia fell below senility and cerebrovascular diseases. In the expectation converted back to the 2003 version with the ratios, pneumonia still exceeds both in 2017. The swap in the order of causes, too, is nearly accounted for by the classification change in this year.
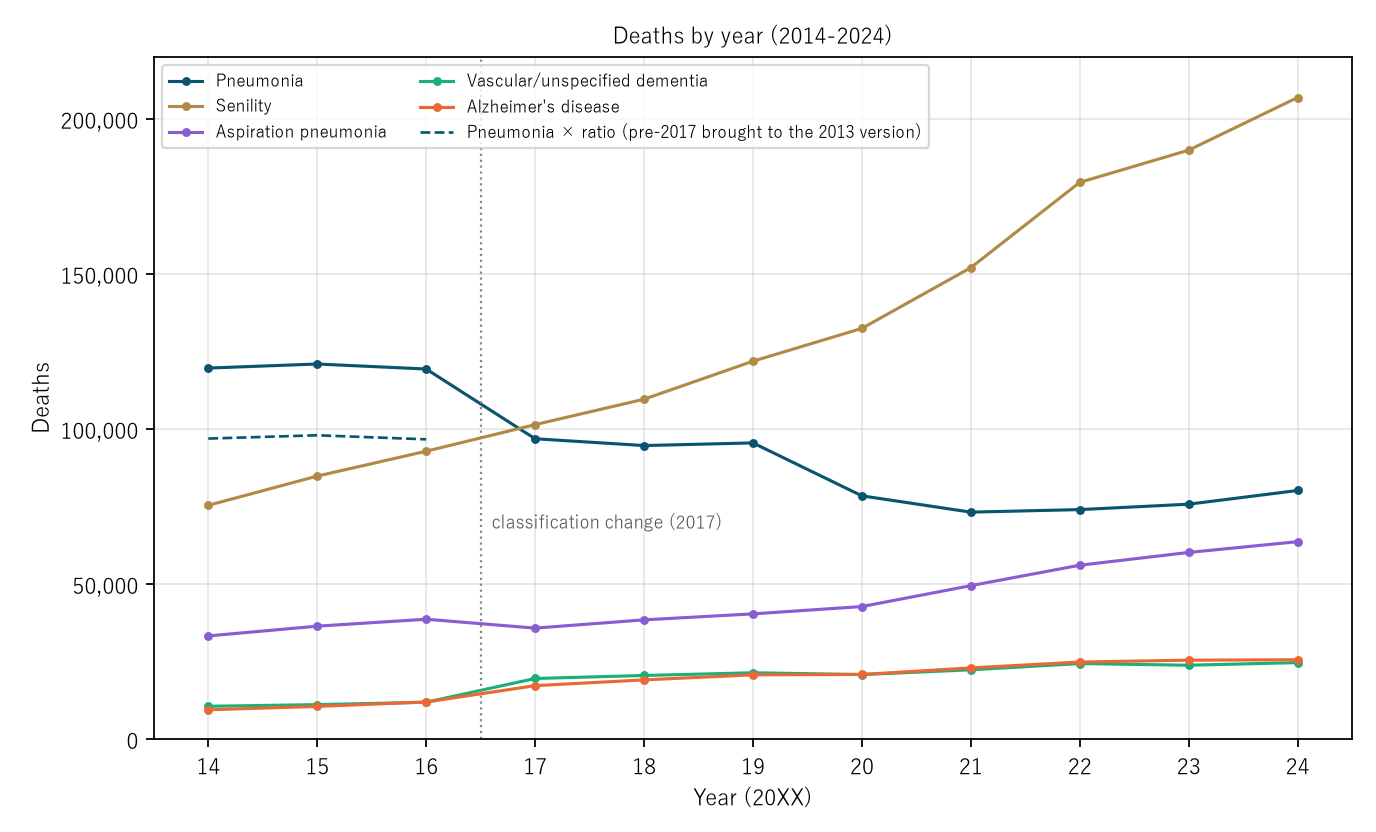
Figure 2: Deaths from pneumonia, senility, aspiration pneumonia, vascular and unspecified dementia, and Alzheimer's disease (2014–2024). The dashed line is pneumonia in 2016 and earlier times the ratio 0.810; it comes to almost the same level as the actual 2017 value.
8. Limitations
- The new/old ratio is one ratio from a comparison of about 1/7 of the 2016 deaths, and need not be the same across years, sexes, or ages.
- The neighbouring growth is taken from three years, 2015, 2016, and 2018, so their year-to-year variation enters the step (spread of 0.030 for causes with almost no classification change).
- The fall in pneumonia from 2020 on is not covered.
- It does not argue which classification is right. It is not one person's likelihood.
Conclusion
The fall in pneumonia deaths in 2017 (119,346 → 96,859) is nearly predicted by the ratio 0.810 from recoding the same death records under the new and old classifications. Across 65 causes, the actual 2017 steps and the new/old ratios line up with a correlation of 0.969 and a slope of 0.992, and the lost deaths moved to dementia, Alzheimer's disease, heart failure, chronic obstructive pulmonary disease, and others.
One thing separates them — whether the classification changed, or the disease changed.
When hearing that "the number for a cause of death moved sharply in some year," check together whether the rules for counting causes of death changed that year.
Data and reproduction
| Data | Vital Statistics 2024 (final data), Volume 1, Table 5.13 (e-Stat, retrieved 26 September 2026); the Ministry of Health, Labour and Welfare's "Effects of the partial revision of ICD-10 on cause-of-death statistics" and the "Summary of results" of the 2017 overview of monthly vital statistics annual estimates (retrieved the same day) |
| Terms of use | e-Stat follows the Public Data License (Version 2.0), and the Ministry's pages the Public Data License (Version 1.0). This paper's steps, correlations, and breakdowns were produced by processing these and are not figures produced by the government |
| Scope | Japan; 2015–2018 (steps) and 2014–2024 (figure); short list of causes of death |
| Verification | 検算/M041.py (--zu also writes the figures). Every number in the text is taken from 検算/M041_output.txt |
| Raw data | The 3 retrieved files and SOURCES.md (URLs, retrieval dates, SHA-256, terms of use, definitions and calculation) in data/ |
| Figures | 図/M041_zu1, 図/M041_zu2 (png, svg, English versions) |
References
- Ministry of Health, Labour and Welfare. Effects of the partial revision of ICD-10 on cause-of-death statistics (in Japanese) (accessed 26 September 2026). https://www.mhlw.go.jp/toukei/list/dl/icd_2013_eikyo.pdf
- Ministry of Health, Labour and Welfare. Overview of the 2017 monthly vital statistics annual estimates: Summary of results (in Japanese) (accessed 26 September 2026). https://www.mhlw.go.jp/toukei/saikin/hw/jinkou/geppo/nengai17/dl/kekka.pdf
- Ministry of Health, Labour and Welfare. Vital Statistics 2024 (final data), Volume 1, Table 5.13 (in Japanese). e-Stat (accessed 26 September 2026). https://www.e-stat.go.jp/
- Yamagishi, Y. (2026). In 1950 the Leading Cause of Death Was Tuberculosis, but Adjusted to Today's Age Structure It Is Old Age, and Tuberculosis Is Fifth [M020]. Zenodo. https://doi.org/10.5281/zenodo.22968057
- Yamagishi, Y. (2026). Heart Disease Deaths Fell by More Than a Tenth in Each of Two Years, 1994 and 1995 — The Years of an Instruction on the Death Certificate; Only Heart Failure Fell (0.377-Fold from 1990 to 1995), While Acute Myocardial Infarction Rose 1.645-Fold [M035]. Zenodo. https://doi.org/10.5281/zenodo.22973433
Reference
Yamagishi, Y. (2026). The Fall in Pneumonia Deaths in 2017 Is Nearly Predicted by the Ratio from Recoding the Same Death Records under the New and Old Classifications [M041]. Zenodo.
DOI: 10.5281/zenodo.22974374
YOI: https://www.yamagishiyuuki.com/yoi/M041
ORCID: 0009-0006-8587-3450
PDF (English) · PDF (Japanese) · Date proof of the English PDF (OpenTimestamps .ots) · SHA256SUMS
The record page for this paper (in Japanese, with the PDFs in each language and the date proof): YOI M041. This paper is a preprint and has not been peer reviewed.