Abstract
The share with obesity (BMI 25 or above) in the National Health and Nutrition Survey was lined up by sex and 6 age groups at ages 20+, joining the trend table for 2004–2017 with the tables of BMI status for 2017–2023 (18 years). When the yearly shape of the total differs between men and women, the paper checks how it differs by age. It claims no new mathematical theorem and no new law.
First, the tables are consistent. The shares in the 2017 table of BMI status agree with 2017 in the trend table, and when the age-adjustment weights (6 groups of the 2010 census standard population) are recovered from the 28 age-adjusted values in the trend table, they reproduce the 28 values with a largest difference of 0.0406 (Section 3).
Second, for men all 6 age groups rose. Compared with the first 5 years (2004–2008), the last 5 rounds (2017, 2018, 2019, 2022, 2023) are higher by +1.76 to +4.32 points in every group, +2.68 in the total, and +2.82 in the age-adjusted share (Section 4).
Third, this is the core of the paper. Women's age-adjusted share is flat at −0.09 points, but it is not flat by age. Ages 20–29 +2.80, 30–39 +2.46, and 40–49 +0.14, against 50–59 −2.00, 60–69 −2.36, and 70+ −0.92: ages that rise and ages that fall cancel out (Section 4).
Fourth, the difference for one age group alone is only about 1–2 times the guide to its standard error (0.72–1.78 for a 5-round average). Fitting a straight line to all 18 years, the slope exceeds twice its standard error for men's total (+1.69 points per 10 years), age-adjusted share (+1.80), and ages 50–59, 60–69, and 70+, and for women aged 20–29 (+2.37), 60–69 (−2.11), and 70+ (−1.28). The slopes of women's total and age-adjusted share are smaller than their standard errors (Section 5).
Fifth, women's total (ages 20+) is +0.68 points, appearing to rise more than the age-adjusted share (−0.09). It is the widening of the gap total − age-adjusted from 1.36 to 2.14, because the age line-up of respondents shifted toward ages with higher obesity (M049). The ministry's summary also reports no significant change for women over 10 years and a significant increase for men in 2013–2019 (Section 6).
Sixth, what separates them is whether no age moved or rising ages and falling ages cancelled out. Under the single answer "flat," there can be movements in opposite directions by age.
Scope note: This paper claims no new mathematical theorem and no new law — the shares and age-adjusted values are in public tables; the paper only compares averages of two periods and slopes of straight lines, and recovers the age-adjustment weights. This paper is a structural interpretation of the shape of numbers in published aggregate data, and is not medical advice, diagnosis, or a treatment recommendation. The author is not a physician. For decisions about individual health, consult a physician or medical institution. It is a preprint that has not been peer reviewed. It does not judge body shapes as good or bad. It does not go into why the age-specific shares moved (diet, exercise, birth year, and so on). The number of people per age group in 2023 is 138–618 for men and 119–717 for women, and the yearly shares swing widely (women aged 60–69 fell from 29.9% in 2004 to 21.5% in 2013 and were back at 28.1% in 2019). The standard error is a guide assuming simple sampling, without the effect of the survey design. 2012 and 2016 are national-correction years, and 2024 is not used. Prefectures are not compared. It is not one person's outlook. About the data: the National Health and Nutrition Survey (e-Stat) is used under the Public Data License (Version 2.0), and the ministry's summary under the Public Data License (Version 1.0); this paper's averages, differences, slopes, and weights were produced by processing them. What the paper adds: showing, with 18 years of age-specific tables, that the flatness of women's age-adjusted share with obesity is the result of a rise at young ages cancelling a fall at ages 50+.
1. Notation and question
- Share with obesity: the share of people with BMI 25 or above (pregnant women excluded).
- First 5 years: 2004–2008. Last 5 rounds: 2017, 2018, 2019, 2022, and 2023. The yearly shares are averaged simply.
- Age adjustment: the 6 age-group shares weighted by the 2010 census standard population and added. Values up to 2017 are from the table; from 2018 they are computed with the recovered weights.
- Slope: points per 10 years of a straight line fitted to all 18 years.
Question: Is the yearly shape of the share with obesity the same for men and women? When the total is flat, is it because every age is flat?
Observation 1.1: M049 showed that, of the movement in means at ages 20+, the part due to respondents' age composition differs in direction and size by indicator. With the share with obesity in the same survey, this paper looks at age-specific movements in opposite directions that remain after age adjustment.
2. Survey and design
To be honest: the design was decided after seeing the tables.
| Content | |
|---|---|
| Tables | National Health and Nutrition Survey 2017, Table 94-2 (trend in the share with obesity, 2004–2017); 2017 Table 18-1 and 2018–2023 Table 17-1 (BMI status) |
| Years | 18 years: 2004–2019, 2022, and 2023 (the 2020 and 2021 surveys were cancelled) |
| Yardsticks | Difference between the averages of the first 5 years and last 5 rounds, the slope over 18 years, and age-adjusted values |
| Noticed while surveying | Women's total was nearly flat, yet ages 20–29 and 60–69 moved in opposite directions |
| Expected and measured | One age group's difference alone reached only about 1–2 times the guide to its standard error. So the slope over 18 years was also measured, and only those exceeding twice the standard error are stated strongly |
3. Data and checks
Calculation 3.1 The 7 retrieved files (6 tables and the 2023 summary) were fixed by SHA-256, and the following was checked.
- The trend table is Table 94-2, with the total, age-adjusted value, and 6 age groups for each sex over the 14 years 2004–2017. Its notes state that "2012 and 2016 are national correction values that take the sampling rate into account" and that the age-adjusted values use the 2010 census standard population (6 groups).
- The 2017–2023 tables of BMI status have the counts and shares with obesity for the 6 age groups and ages 20+ for each sex, with share = count ÷ total. The 2017 shares agree with 2017 in the trend table within 0.05.
- The 2023 summary states that the share with obesity "over these 10 years shows no significant change for women, whereas for men it increased significantly between 2013 and 2019 and shows no significant change after that."
Calculation 3.2 Age-adjustment weights (recovered by least squares from the 28 values in the trend table)
| Age | Weight |
|---|---|
| 20–29 | 0.1324 |
| 30–39 | 0.1722 |
| 40–49 | 0.1621 |
| 50–59 | 0.1570 |
| 60–69 | 0.1740 |
| 70+ | 0.2023 |
The 28 age-adjusted values are reproduced by these weights with a largest difference of 0.0406.
4. First 5 years and last 5 rounds
Calculation 4.1 Average share with obesity (%) and difference (points)
| Age | Men: first | Men: last | Men: difference | Women: first | Women: last | Women: difference |
|---|---|---|---|---|---|---|
| 20–29 | 19.04 | 22.00 | +2.96 | 6.46 | 9.26 | +2.80 |
| 30–39 | 29.54 | 31.30 | +1.76 | 11.62 | 14.08 | +2.46 |
| 40–49 | 33.88 | 35.88 | +2.00 | 17.58 | 17.72 | +0.14 |
| 50–59 | 32.28 | 36.60 | +4.32 | 23.20 | 21.20 | -2.00 |
| 60–69 | 31.10 | 34.58 | +3.48 | 28.20 | 25.84 | -2.36 |
| 70+ | 25.52 | 28.06 | +2.54 | 26.40 | 25.48 | -0.92 |
| Total (20+) | 29.14 | 31.82 | +2.68 | 20.96 | 21.64 | +0.68 |
| Age-adjusted | 28.74 | 31.56 | +2.82 | 19.60 | 19.50 | -0.09 |
Observation 4.2: For men, the last 5 rounds are higher in all 6 age groups (+1.76 to +4.32 points). For women, ages 20–29 (+2.80) and 30–39 (+2.46) rise, ages 50–59 (−2.00), 60–69 (−2.36), and 70+ (−0.92) fall, and the age-adjusted share is flat at −0.09 points.
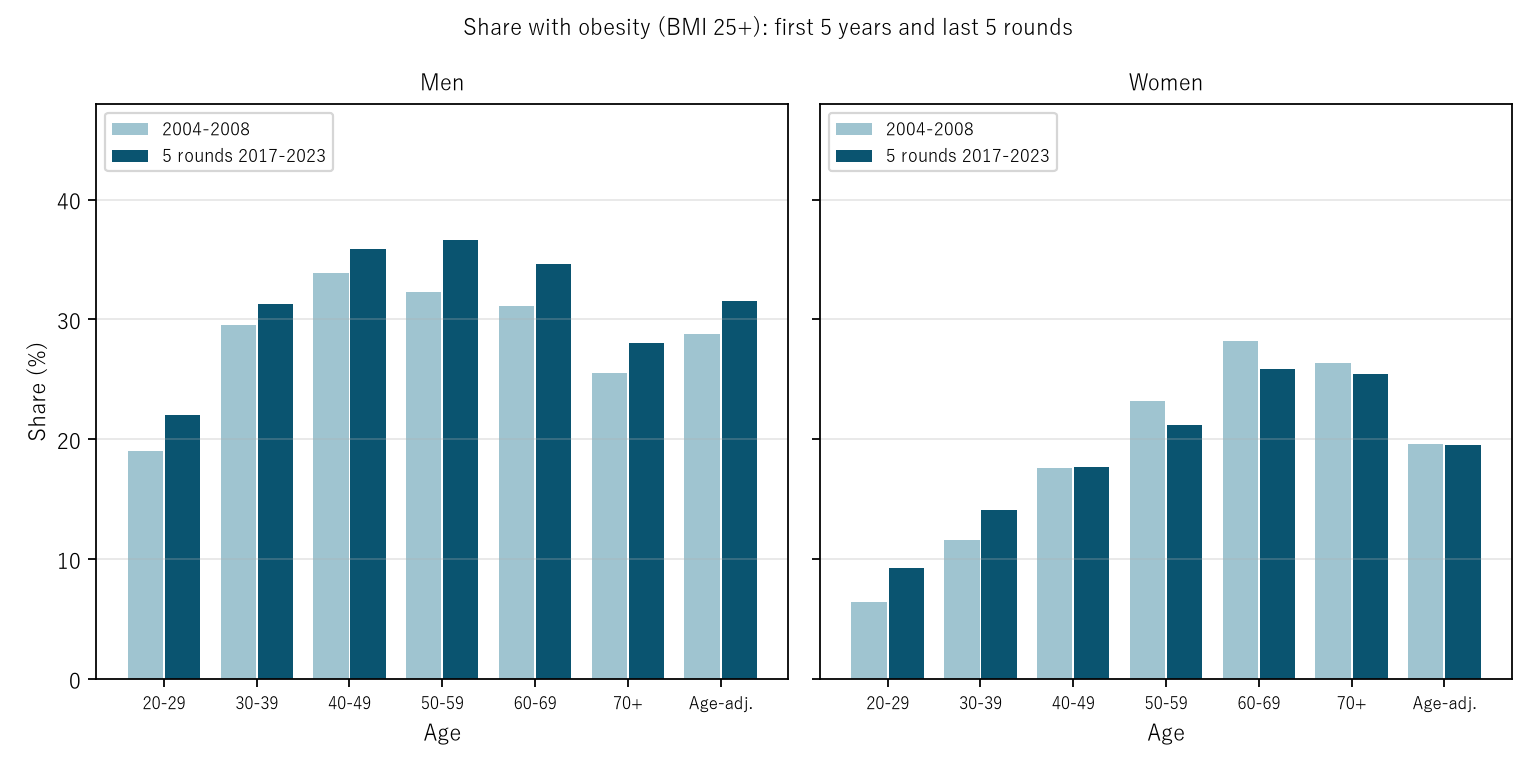
Figure 1: Share with obesity by age group. Light blue is the average of 2004–2008 and navy the average of the 5 rounds of 2017–2023.
5. Core — weak one by one, in opposite directions when lined up
Calculation 5.1 Slope of a straight line fitted to all 18 years (points per 10 years) and slope ÷ standard error
| Age | Men: slope | Men: slope ÷ SE | Women: slope | Women: slope ÷ SE |
|---|---|---|---|---|
| 20–29 | +2.31 | +1.68 | +2.37 | +3.65 |
| 30–39 | +0.58 | +0.51 | +1.43 | +1.35 |
| 40–49 | +0.95 | +1.19 | -0.02 | -0.04 |
| 50–59 | +3.08 | +3.20 | -1.02 | -1.23 |
| 60–69 | +2.37 | +3.20 | -2.11 | -2.04 |
| 70+ | +1.71 | +2.68 | -1.28 | -2.28 |
| Total (20+) | +1.69 | +3.90 | +0.23 | +0.63 |
| Age-adjusted | +1.80 | +4.36 | -0.23 | -0.71 |
Observation 5.2: The difference between the first 5 years and last 5 rounds is about 1–2 times the guide to the standard error of each age group (for a 5-round average, 0.78–1.65 for men and 0.72–1.78 for women), so one by one it cannot be stated strongly. Looking at the slope over 18 years, it exceeds twice its standard error for men's total, age-adjusted share, and ages 50–59, 60–69, and 70+, and for women aged 20–29 (+2.37 points per 10 years), 60–69 (−2.11), and 70+ (−1.28). The slopes of women's total (+0.23) and age-adjusted share (−0.23) are smaller than their standard errors. For women only the whole is flat; young ages and older ages move in opposite directions.
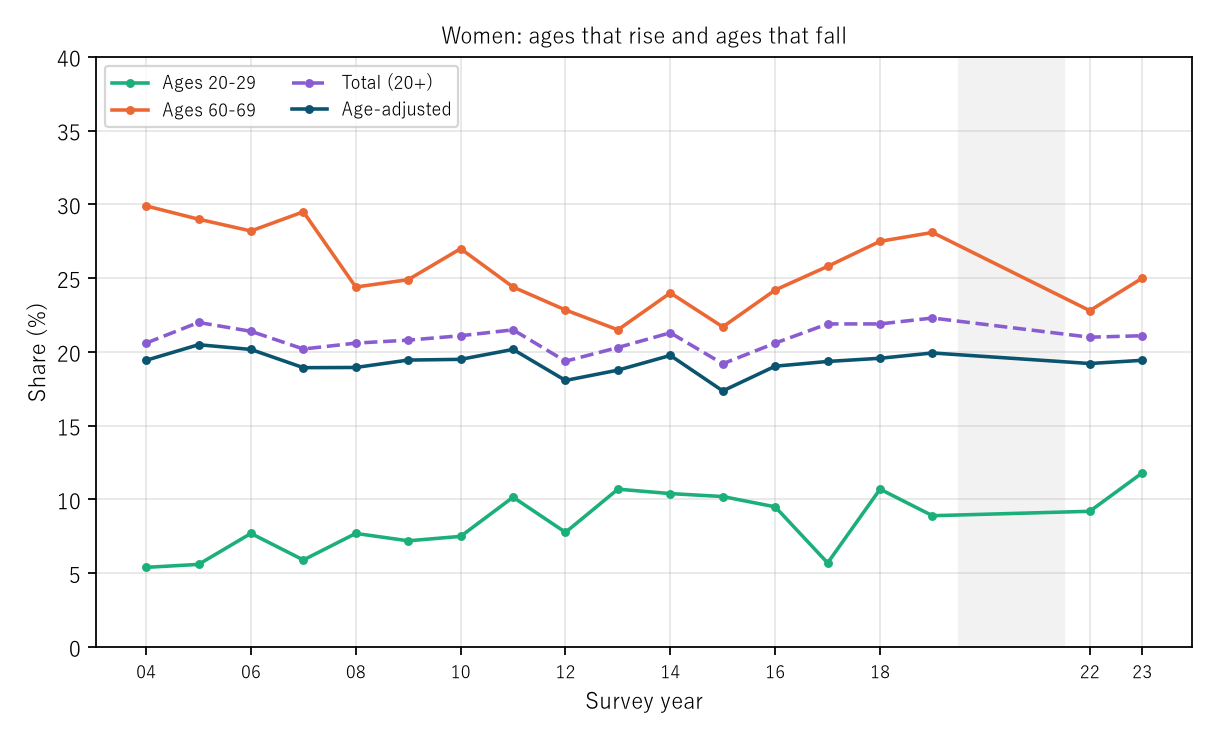
Figure 2: Women's share with obesity at ages 20–29 and 60–69, with the total and the age-adjusted share. The horizontal axis shows the last two digits of the survey year. Grey marks the cancelled years 2020 and 2021.
6. Total and age-adjusted share
Observation 6.1: Women's total (ages 20+) is +0.68 points above the first 5 years, appearing to rise more than the age-adjusted value (−0.09). The gap total − age-adjusted widened by +0.77, from 1.36 in the first 5 years to 2.14 in the last 5 rounds. The total is weighted by the age line-up of respondents and the age-adjusted value by that of the standard population, so this widening is the part due to the respondents' line-up shifting toward ages with higher obesity (the same form as M049). For men the gap went from 0.40 to 0.26 (−0.14), and the total (+2.68) and age-adjusted share (+2.82) were nearly the same. The ministry's test (on age-adjusted values) also reports no significant change for women and a significant increase for men in 2013–2019, agreeing in direction with this paper's slopes.
7. Limitations
- The number of people per age group in 2023 is 138–618 for men and 119–717 for women, and the yearly shares swing widely (for women aged 60–69, the 21.5% of 2013 is the lowest). One group's difference between two periods reaches only about 1–2 times the guide to its standard error.
- The standard error is a guide assuming simple sampling, without the effect of the survey design (choosing areas and surveying the households in them).
- Age-adjusted values from 2018 on are computed with the recovered weights (the 28 values up to 2017 are reproduced with a largest difference of 0.0406).
- 2012 and 2016 are national-correction years (used as in the trend table).
- It does not go into why the age-specific shares moved, or into whether body shapes are good or bad. Prefectures are not compared. It is not one person's outlook.
Conclusion
Over 18 years of the National Health and Nutrition Survey, the share with obesity rose in all 6 age groups for men. For women it was flat at −0.09 points after age adjustment, but ages 20–29 rose by +2.80 points and ages 60–69 fell by −2.36 points.
One thing separates them — whether no age moved or rising ages and falling ages cancelled out.
When you hear that "the share has not changed," check together whether it has not changed at each age too, or whether movements in opposite directions are cancelling out.
Data and reproduction
| Data | National Health and Nutrition Survey (Ministry of Health, Labour and Welfare, e-Stat), 2017 Tables 94-2 and 18-1, and Table 17-1 for 2018, 2019, 2022, and 2023; Summary of Results of the 2023 National Health and Nutrition Survey (retrieved 26 September 2026) |
| Terms of use | e-Stat follows the Public Data License (Version 2.0), and the ministry's pages follow the Public Data License (Version 1.0). This paper's averages, differences, slopes, and weights were produced by processing these and are not figures produced by the government |
| Scope | Japan; ages 20+; 2004–2019, 2022, and 2023 |
| Verification | 検算/M050.py (--zu also writes the figures). Every number in the text is taken from 検算/M050_output.txt |
| Raw data | The 7 retrieved files and SOURCES.md (URLs, retrieval dates, SHA-256, terms of use, definitions and calculation) in data/ |
| Figures | 図/M050_zu1 and 図/M050_zu2 (png, svg, English version) |
References
- Ministry of Health, Labour and Welfare. National Health and Nutrition Survey 2017, Tables 94-2 and 18-1; 2018, 2019, 2022, and 2023, Table 17-1 (in Japanese). e-Stat (accessed 26 September 2026). https://www.e-stat.go.jp/
- Ministry of Health, Labour and Welfare. Summary of Results of the 2023 National Health and Nutrition Survey (in Japanese) (accessed 26 September 2026). https://www.mhlw.go.jp/content/10900000/001338334.pdf
- Yamagishi, Y. (2026). Of the Movement in Means at Ages 20+, the Part Due to Respondents' Age Composition Differs in Direction and Size by Indicator — From 2013 to 2023 It Is 0.077 of Women's BMI Rise of 0.103 and 0.140–0.151 of the Fall in Steps, Nearly 0 for Men's Salt, and for Potassium It Offsets 0.375–0.682 of the Age-Specific Fall [M049]. Zenodo. https://doi.org/10.5281/zenodo.22974769
Reference
Yamagishi, Y. (2026). The Share with Obesity Rose in All 6 Age Groups for Men, While Women's Age-Adjusted Share Is Flat at −0.09 Points [M050]. Zenodo.
DOI: 10.5281/zenodo.22974804
YOI: https://www.yamagishiyuuki.com/yoi/M050
ORCID: 0009-0006-8587-3450
PDF (English) · PDF (Japanese) · Date proof of the English PDF (OpenTimestamps .ots) · SHA256SUMS
The record page for this paper (in Japanese, with the PDFs in each language and the date proof): YOI M050. This paper is a preprint and has not been peer reviewed.