Abstract
For 2013 and 2023 of the National Health and Nutrition Survey, the differences in the means at ages 20+ (by sex) of steps, BMI, salt, potassium, and energy were split into "the difference in age-specific values" and "the difference in respondents' age composition" (Kitagawa's method). Age has 6 groups, from 20–29 to 70+. It claims no new mathematical theorem and no new law.
First, the tables are consistent. Built from the age-group means weighted by the number of respondents, the mean at ages 20+ agrees with the table's value within one unit of the table's last digit in every table, and the two parts add up exactly to the original difference (Section 3).
Second, the respondents grew older. In every table the share aged 70+ is larger in 2023 than in 2013; in the steps table it went from 0.262 to 0.296 for men and from 0.261 to 0.302 for women (Section 4).
Third, this is the core of the paper. The same aging moves the means in different directions and by different amounts, depending on the indicator. For steps, of the men's difference of −471.241 the age-composition part is −70.970 (0.151), and 0.140 for women, deepening the fall by more than a tenth. For women's BMI, of the rise of +0.103, +0.077 (0.752) is the age-composition part, while for men's BMI (0.013) and men's salt (−0.002) it is nearly 0 (Section 5).
Fourth, for potassium the direction reverses. The age-specific part falls, −47.002 for men and −31.552 for women, yet the age-composition part is +17.621 and +21.528, offsetting 0.375 and 0.682 of the fall. The direction of the age-composition part agrees in all 10 pairs with whether the 2013 ratio of 70+ ÷ 20–29 exceeds 1 (Section 5).
Fifth, the age-specific part of women's BMI, +0.026, is smaller than the ±0.055 the table's rounding alone can move it. It cannot be said that age-specific BMI rose. The ministry's test uses age-adjusted values, and the age-adjusted value for men in the note of the 2023 steps table is 6,914 steps, different from the table's mean of 6,628 steps (Section 6).
Sixth, what separates them is whether the age-specific values moved or the age line-up of respondents moved. The headline mean carries a part due to the age line-up of respondents, and its direction is set by the shape of the indicator over age.
Scope note: This paper claims no new mathematical theorem and no new law — the age-group means and counts are in public tables; the paper only splits the difference in two by Kitagawa's method. This paper is a structural interpretation of the shape of numbers in published aggregate data, and is not medical advice, diagnosis, or a treatment recommendation. The author is not a physician. For decisions about individual health, consult a physician or medical institution. It is a preprint that has not been peer reviewed. The age composition here is that of the people who answered the survey, not that of the national population — it does not go into why the respondents grew older. It does not go into why the age-specific values moved (eating, living, or how things were measured). It is a different split from the ministry's test (on age-adjusted values) and does not replace that conclusion. Changes in the age line-up within the 6 groups are not separated. Nutrition figures come from one arbitrary day's diet, and the version of the food composition table can differ by year. Prefectures are not compared. It is not one person's outlook. About the data: the National Health and Nutrition Survey (e-Stat) is used under the Public Data License (Version 2.0), and the ministry's summary under the Public Data License (Version 1.0); this paper's shares, differences, and splits were produced by processing them. What the paper adds: showing, in 10 pairs of five indicators by sex, that the part of the difference in means at ages 20+ due to respondents' age composition differs in direction and size by indicator, and confirming that its direction is set by the shape over age.
1. Notation and question
- Respondents' age composition: the share of each age group among the people aged 20+ in that table. Respondents differ by table, so it is computed for each table.
- Mean at ages 20+: the age-group means weighted by respondents' age composition.
- Kitagawa's method: the difference from 2013 to 2023 is split into "difference in age-specific values × average age composition of the two years" (the age-specific part) and "difference in age composition × average age-specific values of the two years" (the age-composition part). The two add up exactly to the original difference.
- Shape over age: the 2013 value at 70+ ÷ the value at 20–29.
Question: When the mean at ages 20+ moves, is it the age-specific values that moved, or the age line-up of respondents? Does this differ by indicator?
Observation 1.1: M001 showed that "the death rate rose" names the movement of the age composition and the movement of age-specific rates in one phrase. M048 showed that the standard deviation of salt moves with how the table is made. This paper applies the same split to health means and shows that the answer differs by indicator.
2. Survey and design
To be honest: the design was decided after seeing the tables.
| Content | |
|---|---|
| Tables | National Health and Nutrition Survey 2013 and 2023: Table 62 (steps), Table 19 / Table 15 (BMI), Tables 1-2 and 1-3 (salt, potassium, energy) |
| Years | 2013 and 2023 (neither is a national-correction year) |
| Age | 20–29, 30–39, 40–49, 50–59, 60–69, 70+. In 2023, Table 1 splits 70–79 and 80+, which were combined weighted by counts |
| Noticed while surveying | With nutrients alone the age-composition part was small (men's salt +0.001). Adding steps and BMI, which differ strongly by age, made the differences in direction and size clear |
| Expected and measured | Before writing, the tolerance for the rebuilt mean at ages 20+ was set at half the last digit. It failed for women's BMI in 2013 (22.3534 vs 22.36), and since the age-group values are also rounded it was changed to one unit of the last digit |
3. Data and checks
Calculation 3.1 The 9 retrieved files (8 tables and the 2023 summary) were fixed by SHA-256, and the following was checked.
- The table titles match the year and table number (Table 62, Table 19 / Table 15, Tables 1-2 / 1-3), and all 6 age groups are present for every indicator, sex, and year.
- The mean at ages 20+ rebuilt from the age groups agrees with the table's value at ages 20+ (the total for steps) within one unit of the table's last digit.
- For every indicator and sex, the age-specific part + the age-composition part = the difference.
- The 2023 summary states that steps "over these 10 years have decreased significantly for both men and women," that "from 2012 on, people with fewer than 100 or 50,000 or more steps are excluded," and that the test of the trend over years uses age-adjusted values. Steps in 2013 and 2023 are excluded in the same way.
4. Respondents' age composition
Calculation 4.1 Respondents' age composition in the steps table (share of those aged 20+)
| Age | Men: 2013 | Men: 2023 | Women: 2013 | Women: 2023 |
|---|---|---|---|---|
| 20–29 | 0.093 | 0.080 | 0.083 | 0.064 |
| 30–39 | 0.123 | 0.116 | 0.124 | 0.108 |
| 40–49 | 0.148 | 0.129 | 0.151 | 0.134 |
| 50–59 | 0.155 | 0.186 | 0.151 | 0.195 |
| 60–69 | 0.218 | 0.192 | 0.231 | 0.197 |
| 70+ | 0.262 | 0.296 | 0.261 | 0.302 |
Observation 4.2: In every table and sex, the share of respondents aged 70+ is larger in 2023 than in 2013 (in the steps table men 0.262 → 0.296, women 0.261 → 0.302; in the BMI table men 0.277 → 0.329, women 0.279 → 0.336). Those aged 20–29 fell from 0.093 to 0.080 for men and from 0.083 to 0.064 for women.
5. Core — the same aging works in different directions
Calculation 5.1 Splitting the 2013 → 2023 difference
| Indicator, sex | 2013 | 2023 | Difference | Age-specific part | Age-composition part | Composition ÷ difference |
|---|---|---|---|---|---|---|
| Steps, men | 7099.051 | 6627.811 | -471.241 | -400.271 | -70.970 | +0.151 |
| Steps, women | 6249.291 | 5659.042 | -590.249 | -507.405 | -82.844 | +0.140 |
| BMI, men | 23.508 | 23.724 | +0.215 | +0.212 | +0.003 | +0.013 |
| BMI, women | 22.353 | 22.456 | +0.103 | +0.026 | +0.077 | +0.752 |
| Salt (g), men | 11.133 | 10.652 | -0.481 | -0.482 | +0.001 | -0.002 |
| Salt (g), women | 9.370 | 9.051 | -0.319 | -0.347 | +0.029 | -0.090 |
| Potassium (mg), men | 2399.843 | 2370.462 | -29.381 | -47.002 | +17.621 | -0.600 |
| Potassium (mg), women | 2200.128 | 2190.104 | -10.024 | -31.552 | +21.528 | -2.148 |
| Energy (kcal), men | 2128.998 | 2108.378 | -20.620 | -15.425 | -5.195 | +0.252 |
| Energy (kcal), women | 1678.966 | 1702.962 | +23.996 | +23.010 | +0.986 | +0.041 |
Calculation 5.2 Shape over age (2013 value at 70+ ÷ value at 20–29)
| Indicator | Men | Women |
|---|---|---|
| Steps | 0.653 | 0.624 |
| BMI | 1.030 | 1.097 |
| Salt | 1.064 | 1.108 |
| Potassium | 1.355 | 1.340 |
| Energy | 0.951 | 1.009 |
Observation 5.3: For steps, the age-composition part deepens the fall by more than a tenth (men 0.151, women 0.140). For women's BMI, 0.077 (0.752) of the rise of 0.103 is the age-composition part, while for men's BMI (0.013) and men's salt (−0.002) it is nearly 0. For potassium the direction reverses: the age-specific values fall, yet the age-composition part raises the mean, offsetting 0.375 (men) and 0.682 (women) of the fall. The age-composition part raises the mean in 7 of the 10 pairs and lowers it in 3. The direction agrees in all 10 pairs with whether the shape over age (70+ ÷ 20–29) is above 1 (potassium 1.355 and 1.340, salt 1.064 and 1.108, and so on) or below it (steps 0.653 and 0.624, men's energy 0.951).
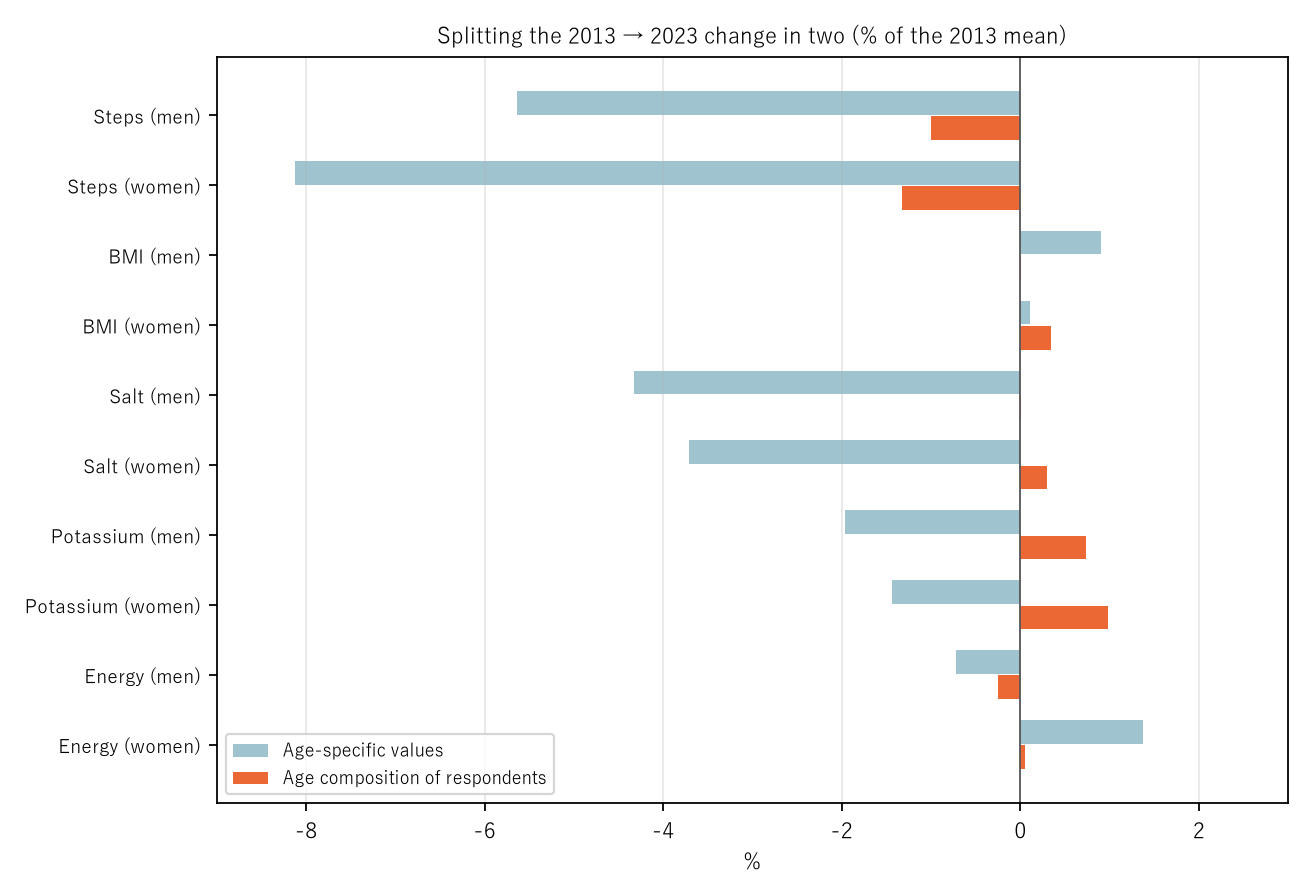
Figure 1: The age-specific part (light blue) and the part due to respondents' age composition (orange), as a percentage of the 2013 mean.
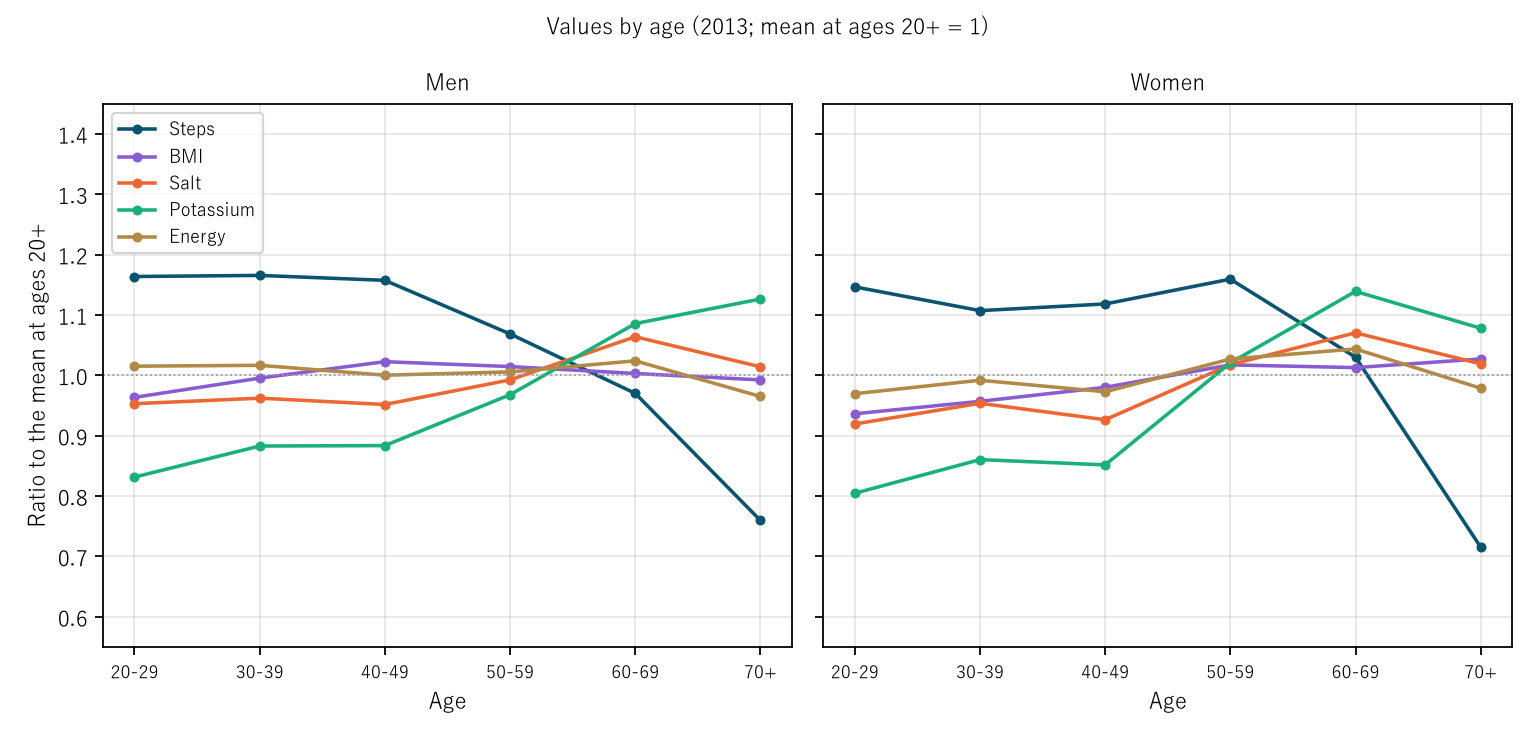
Figure 2: The 2013 values by age divided by the mean at ages 20+. Steps fall with age and potassium rises. When more older people are among the respondents, the mean of the former falls and that of the latter rises.
6. Rounding and age-adjusted values
Calculation 6.1 The 2023 BMI table gives one decimal and the 2013 table two, so rounding alone can move the age-specific part by up to ±0.055. For women the age-specific part is +0.026, smaller than this range.
Observation 6.2: The rise in women's mean BMI at ages 20+ is accounted for by the age-composition part, and the tables do not show that age-specific BMI rose. The note of the 2023 steps table also gives the age-adjusted steps for men, 6,914, different from the table's mean of 6,628. The ministry's test uses age-adjusted values, so the headline mean and the test's subject are different numbers.
7. Limitations
- The age composition here is that of respondents, not that of the national population. It does not go into why the respondents changed.
- Changes in the age line-up within the 6 groups (for example, the share aged 80+ within 70+) fall into the age-specific part.
- It compares two years; the years in between are not looked at. It does not replace the ministry's test (on age-adjusted values).
- Nutrition figures come from one arbitrary day's diet, and the version of the food composition table can differ by year (M048).
- It does not go into why the age-specific values moved. Prefectures are not compared. It is not one person's outlook.
Conclusion
Between 2013 and 2023 in the National Health and Nutrition Survey, the share of respondents aged 70+ grew in every table. That same aging deepened the fall in mean steps by more than a tenth, covered 0.752 of the rise in women's mean BMI, hardly affected men's salt, and offset the age-specific fall in potassium. The direction was set by the shape of each indicator over age.
One thing separates them — whether the age-specific values moved or the age line-up of respondents moved.
When you hear that "the mean rose (or fell)," check together whether the age line-up of respondents stayed the same, and how that indicator changes with age.
Data and reproduction
| Data | National Health and Nutrition Survey (Ministry of Health, Labour and Welfare, e-Stat), Tables 62, 19, 15, 1-2, and 1-3 for 2013 and 2023, and the Summary of Results of the 2023 National Health and Nutrition Survey (retrieved 26 September 2026) |
| Terms of use | e-Stat follows the Public Data License (Version 2.0), and the ministry's pages follow the Public Data License (Version 1.0). This paper's shares, differences, and splits were produced by processing these and are not figures produced by the government |
| Scope | Japan; ages 20+; 2013 and 2023 |
| Verification | 検算/M049.py (--zu also writes the figures). Every number in the text is taken from 検算/M049_output.txt |
| Raw data | The 9 retrieved files and SOURCES.md (URLs, retrieval dates, SHA-256, terms of use, definitions and calculation) in data/ |
| Figures | 図/M049_zu1 and 図/M049_zu2 (png, svg, English version) |
References
- Ministry of Health, Labour and Welfare. National Health and Nutrition Survey 2013, Tables 19, 62, 1-2, and 1-3; 2023, Tables 15, 62, 1-2, and 1-3 (in Japanese). e-Stat (accessed 26 September 2026). https://www.e-stat.go.jp/
- Ministry of Health, Labour and Welfare. Summary of Results of the 2023 National Health and Nutrition Survey (in Japanese) (accessed 26 September 2026). https://www.mhlw.go.jp/content/10900000/001338334.pdf
- Yamagishi, Y. (2026). "The Death Rate Rose" Names Two Movements at Once, the Age Composition and the Age-Specific Rates [M001]. Zenodo. https://doi.org/10.5281/zenodo.22963112
- Yamagishi, Y. (2026). The Mean and Median of Salt Intake Move Side by Side, Always 0.31–0.57 g Apart, Across 10 Surveys, Yet Only in the 2024 Table Is the Standard Deviation 0.732 Times the Previous Year — the SD of 35 Nutrients Is Also 0.748 Times, While the Mean Stays at 1.002 Times [M048]. Zenodo. https://doi.org/10.5281/zenodo.22974707
Reference
Yamagishi, Y. (2026). Of the Movement in Means at Ages 20+, the Part Due to Respondents' Age Composition Differs in Direction and Size by Indicator [M049]. Zenodo.
DOI: 10.5281/zenodo.22974769
YOI: https://www.yamagishiyuuki.com/yoi/M049
ORCID: 0009-0006-8587-3450
PDF (English) · PDF (Japanese) · Date proof of the English PDF (OpenTimestamps .ots) · SHA256SUMS
The record page for this paper (in Japanese, with the PDFs in each language and the date proof): YOI M049. This paper is a preprint and has not been peer reviewed.