Abstract
For 16 items of the Specific Health Checkups (fiscal 2022), the national means by 5-year age group from 40 to 74 were lined up for men and women, and the differences between adjacent groups (steps) were compared, using the "national" row of the "mean of each item" table and the distribution of "LDL cholesterol" in the 10th NDB Open Data. The paper checks whether the shape over age is the same for men and women, or whether only women bend at one step. It claims no new mathematical theorem and no new law.
First, the tables are consistent. The table of means has a "national" block after the 48 prefectural blocks; the national HbA1c agrees within 0.0001 with the prefectural means weighted by the counts in the HbA1c table, and the national LDL agrees with the means weighted by the counts in the LDL table (Section 3).
Second, this is the core of the paper. For women, in 9 of the 16 items the step from 45–49 to 50–54 is larger than any of the 6 age steps (HbA1c, triglycerides, LDL, AST, ALT, γ-GTP, hemoglobin, serum creatinine, eGFR). For men it is 3 items (fasting glucose, HbA1c, serum creatinine) (Section 4).
Third, how far that step stands out also differs. Dividing the size of this step by the average size of the other 5 steps gives, for women, AST 3.75, hemoglobin 3.66, ALT 3.26, serum creatinine 3.20, LDL 2.65, and γ-GTP 2.44, while for men every item is 1.80 or less (Section 4).
Fourth, for LDL, women go up 111.49 → 116.96 → 126.37 → 131.09 (a step of +9.41 from 45–49 to 50–54), while men go down from 126.99. Women first overtake men in the mean at 50–54 (126.37 vs 126.15) and in the share at 140 or above at 55–59. Women's share at 140 or above goes from 20.67% at 45–49 to 31.23% at 50–54 (1.51 times) (Section 5).
Fifth, this is a comparison between people of different ages in one fiscal year. It is not how the same people change as they age; it includes differences between birth years and the values of people on medication (Section 6).
Sixth, what separates them is whether a value changes smoothly with age or bends at one step. Even when both are described as "rising with age," men and women bend at different places.
Scope note: This paper claims no new mathematical theorem and no new law — the means and counts are in the NDB Open Data; the paper only lines up and compares the differences between adjacent ages. This paper is a structural interpretation of the shape of numbers in published aggregate data, and is not medical advice, diagnosis, or a treatment recommendation. The author is not a physician. For decisions about individual health, consult a physician or medical institution. It is a preprint that has not been peer reviewed. It does not go into why values change at that step (bodily change, way of life, medication, and so on). It compares people of different ages in one fiscal year, not how the same people change. These are values of attendees of the Specific Health Checkups aged 40–74, including people on medication. It does not touch on whether values are good or bad, or on reference ranges. Prefectures are not compared. It is not one person's outlook. About the data: the 10th NDB Open Data (Ministry of Health, Labour and Welfare) is used under the Public Data License (Version 1.0); this paper's steps, ratios, and shares were produced by processing it. What the paper adds: lining up the shapes over age of 16 checkup items for men and women, and showing, by the size of the step and how far it stands out, that only for women is the step from 45–49 to 50–54 the largest in many items.
1. Notation and question
- Step: the difference between the national means of adjacent 5-year groups (later group − earlier group). Six steps, from 40–44 → 45–49 to 65–69 → 70–74.
- Largest step: of the 6 steps, the one with the largest size (absolute value).
- How far the step stands out: the size of the step from 45–49 to 50–54 ÷ the average size of the other 5 steps.
- Share of LDL at 140 or above: the counts at 140–160, 160–180, and 180 or above in the LDL table ÷ the total.
Question: Is the shape of checkup values over age the same for men and women? Do only women change greatly at one age step?
Observation 1.1: M046 separated, with HbA1c in the same NDB Open Data, the shift of the mean from the change in the shape of the distribution. This paper lines up the means of 16 items for men and women and looks at the age step where each changes most.
2. Survey and design
To be honest: the design was decided after seeing the tables.
| Content | |
|---|---|
| Tables | 10th NDB Open Data, Specific Health Checkups, "mean of each item," "LDL cholesterol," and "HbA1c" distributions by prefecture, sex, and age group (fiscal 2022) |
| Items | The 16: BMI, waist, fasting glucose, HbA1c, systolic BP, diastolic BP, triglycerides, HDL, LDL, AST (GOT), ALT (GPT), γ-GTP, hemoglobin, casual glucose, serum creatinine, and eGFR |
| Yardsticks | Largest step, how far the step stands out, the LDL mean and share at 140 or above, and the age at which men and women swap order |
| Noticed while surveying | The table of means has a "national" block. There was no need to weight the prefectures to obtain the national figure |
| Expected and measured | I expected at most 1 item for men with the largest step at 45–49 → 50–54, but it measured 3. I expected the LDL mean and share at 140 or above to swap between men and women at the same 50–54, but the share swapped at 55–59 |
3. Data and checks
Calculation 3.1 The 4 retrieved files (a copy of the page and three tables) were fixed by SHA-256, and the following was checked.
- The copy of the page has the locations of the three tables. The table of means is headed "特定健診 平均値:2022年度", with 7 age groups and a subtotal for both sexes.
- The table of means has 16 items and 48 prefectural blocks followed by a "national" block. Every item, sex, and age has a mean in at least 47 blocks.
- The largest difference between the table's national value and the prefectural means weighted by counts is 0.00000 for HbA1c (weighted by the HbA1c table's counts) and 0.0000 for LDL (by the LDL table's counts). Weighting triglycerides by the HbA1c table's counts as a stand-in gives a difference of 0.4314, so the paper uses the table's national values as they are.
- The LDL table has 48 blocks, with subtotal = sum of the 5-year groups.
4. Core — women bend at the step from 45–49 to 50–54
Calculation 4.1 Largest step for each item and how far the step from 45–49 to 50–54 stands out
| Item | Women: largest step | Women: stands out | Men: largest step | Men: stands out |
|---|---|---|---|---|
| BMI | 40–44 → 45–49 | 0.69 | 40–44 → 45–49 | 0.23 |
| Waist | 40–44 → 45–49 | 1.54 | 40–44 → 45–49 | 1.78 |
| Fasting glucose | 50–54 → 55–59 | 1.28 | 45–49 → 50–54 | 1.80 |
| HbA1c | 45–49 → 50–54 | 1.78 | 45–49 → 50–54 | 1.47 |
| Systolic BP | 60–64 → 65–69 | 0.94 | 40–44 → 45–49 | 0.99 |
| Diastolic BP | 40–44 → 45–49 | 2.17 | 40–44 → 45–49 | 1.04 |
| Triglycerides | 45–49 → 50–54 | 1.59 | 40–44 → 45–49 | 0.31 |
| HDL | 60–64 → 65–69 | 1.58 | 50–54 → 55–59 | 1.07 |
| LDL | 45–49 → 50–54 | 2.65 | 55–59 → 60–64 | 0.31 |
| AST (GOT) | 45–49 → 50–54 | 3.75 | 65–69 → 70–74 | 0.27 |
| ALT (GPT) | 45–49 → 50–54 | 3.26 | 50–54 → 55–59 | 1.07 |
| γ-GTP | 45–49 → 50–54 | 2.44 | 65–69 → 70–74 | 0.44 |
| Hemoglobin | 45–49 → 50–54 | 3.66 | 65–69 → 70–74 | 0.17 |
| Casual glucose | 65–69 → 70–74 | 0.76 | 60–64 → 65–69 | 1.02 |
| Serum creatinine | 45–49 → 50–54 | 3.20 | 45–49 → 50–54 | 1.42 |
| eGFR | 45–49 → 50–54 | 1.67 | 40–44 → 45–49 | 1.12 |
Observation 4.2: For women, in 9 of the 16 items the step from 45–49 to 50–54 is larger than any of the 6 steps. For men, 3 items. How far the step stands out is, for the top 6 items in women, AST 3.75, hemoglobin 3.66, ALT 3.26, serum creatinine 3.20, LDL 2.65, and γ-GTP 2.44, while the largest for men is 1.80 for fasting glucose. Many of women's items bend at this step and then level off or fall from 55–59 on.
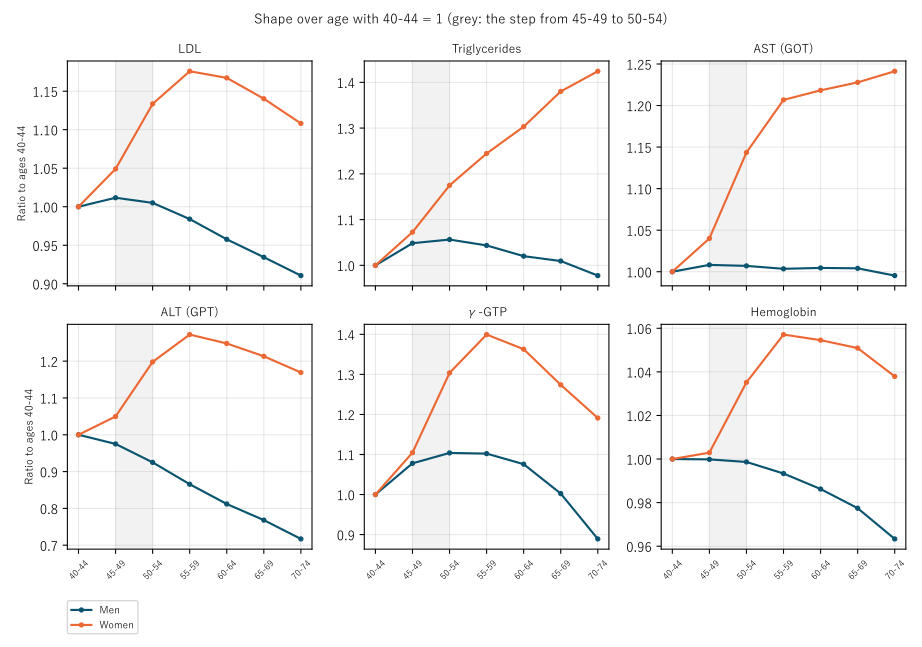
Figure 2: Shape over age of LDL, triglycerides, AST, ALT, γ-GTP, and hemoglobin, with the mean at 40–44 set to 1. Orange is women and navy men. Grey marks the step from 45–49 to 50–54.
5. LDL: mean and share at 140 or above
Calculation 5.1 LDL mean (mg/dL) and shares at 140 or above and 160 or above (%)
| Age | Men: mean | Women: mean | Men: 140+ | Women: 140+ | Men: 160+ | Women: 160+ |
|---|---|---|---|---|---|---|
| 40–44 | 125.52 | 111.49 | 30.79 | 15.35 | 13.60 | 5.49 |
| 45–49 | 126.99 | 116.96 | 32.71 | 20.67 | 14.64 | 8.00 |
| 50–54 | 126.15 | 126.37 | 32.00 | 31.23 | 14.10 | 13.91 |
| 55–59 | 123.51 | 131.09 | 29.09 | 36.88 | 12.16 | 17.21 |
| 60–64 | 120.21 | 130.13 | 25.47 | 35.72 | 10.01 | 16.33 |
| 65–69 | 117.30 | 127.12 | 22.10 | 31.86 | 8.14 | 13.82 |
| 70–74 | 114.30 | 123.54 | 18.74 | 27.41 | 6.39 | 11.14 |
Observation 5.2: Women's mean LDL rises by +9.41 from 45–49 to 50–54, the largest of the 6 steps, and goes on up to 131.09 at 55–59. Men's falls from 126.99 at 45–49. Women first overtake men in the mean at 50–54 (126.37 vs 126.15) and in the share at 140 or above at 55–59. At 50–54 women's mean is higher, yet the share at 140 or above is still higher for men (31.23% vs 32.00%): the mean alone does not show the difference in the shape of the distributions.
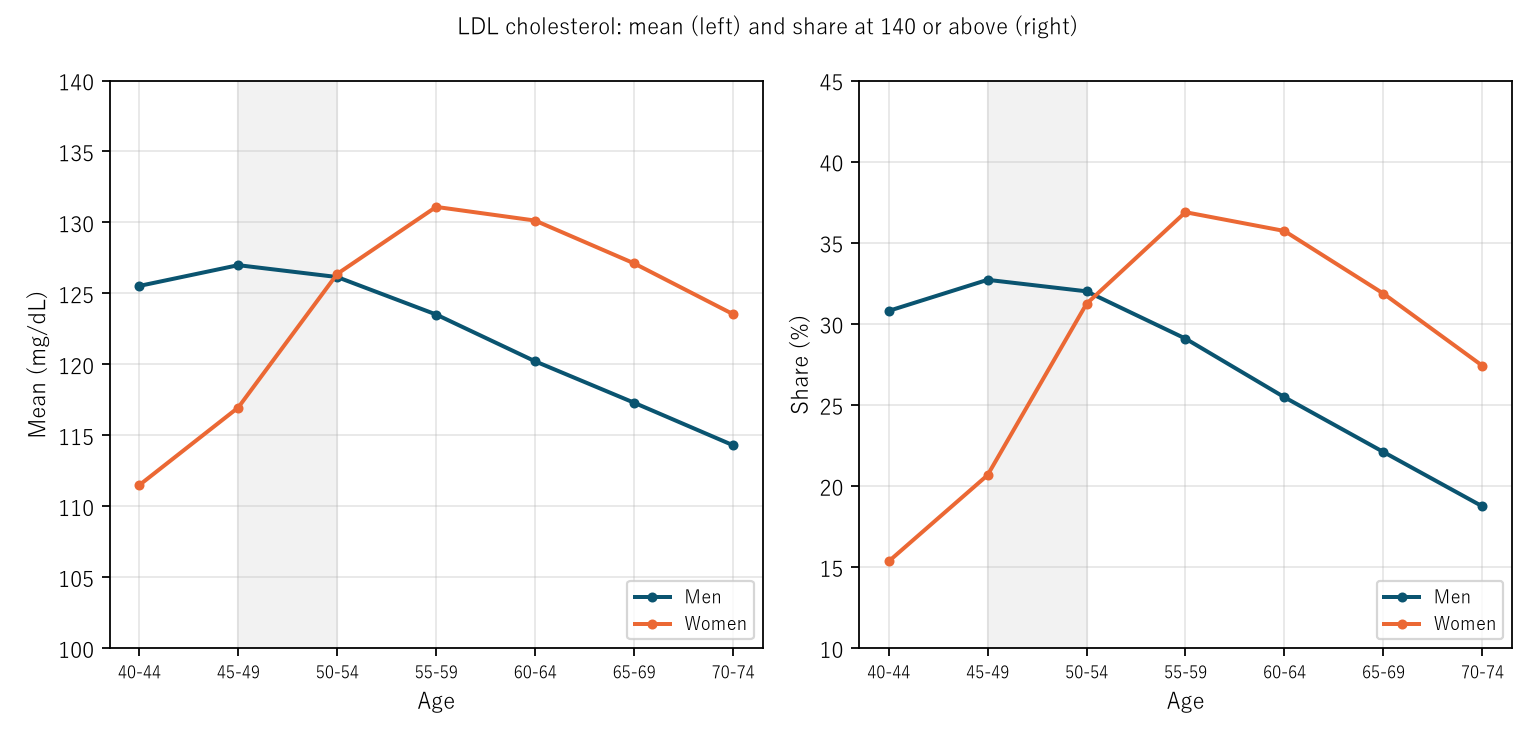
Figure 1: LDL mean (left) and share at 140 or above (right). Grey marks the step from 45–49 to 50–54.
6. People of different ages in one fiscal year
Observation 6.1: The "step" in this paper is the difference between the means of people who were 45–49 and those who were 50–54 in fiscal 2022. It is not how much the same people changed over 5 years; it also contains differences between birth years (the form that M044 separated for death rates). The Specific Health Checkups values also include those of people on medication as they are (this paper does not use tables split by medication). The paper states only the shape of where the step is large and does not go into the reasons.
7. Limitations
- It compares people of different ages in one fiscal year, not how the same people change.
- The values of people on medication are included (tables split by medication are not used).
- These are values of attendees of the Specific Health Checkups aged 40–74, and who attends differs by age.
- It looks at steps between 5-year groups; the shape year by year is not known.
- It does not go into why values change at that step, or touch on whether values are good or bad or on reference ranges. Prefectures are not compared. It is not one person's outlook.
Conclusion
Across 16 checkup items of the Specific Health Checkups (fiscal 2022), for women the step from 45–49 to 50–54 was larger than any other age step in 9 items. For men it was 3 items, and how far the step stood out was 1.80 or less. For LDL, women's mean rose +9.41 at this step and overtook men's at 50–54.
One thing separates them — whether a value changes smoothly with age or bends at one step.
When you hear "it rises with age," check together at which age step it changes most, and whether that is the same for men and women.
Data and reproduction
| Data | 10th NDB Open Data (Ministry of Health, Labour and Welfare), Specific Health Checkups, "mean of each item," "LDL cholesterol," and "HbA1c" distributions by prefecture, sex, and age group (fiscal 2022, retrieved 26 September 2026) |
| Terms of use | The Ministry of Health, Labour and Welfare pages follow the Public Data License (Version 1.0). This paper's steps, ratios, and shares were produced by processing these and are not figures produced by the government |
| Scope | Japan (the table's national values); attendees of the Specific Health Checkups aged 40–74; fiscal 2022 |
| Verification | 検算/M052.py (--zu also writes the figures). Every number in the text is taken from 検算/M052_output.txt |
| Raw data | The 4 retrieved files and SOURCES.md (URLs, retrieval dates, SHA-256, terms of use, definitions and calculation) in data/ |
| Figures | 図/M052_zu1 and 図/M052_zu2 (png, svg, English version) |
References
- Ministry of Health, Labour and Welfare. 10th NDB Open Data, Specific Health Checkups (mean of each item, LDL cholesterol, and HbA1c distribution by prefecture, sex, and age group) (in Japanese) (accessed 26 September 2026). https://www.mhlw.go.jp/stf/seisakunitsuite/bunya/0000177221_00016.html
- Yamagishi, Y. (2026). COPD Death Rates Line Up by Birth Year for Men but Hardly for Women — Across Age × Year in 1995–2015, Aligning by Birth Year Cuts the Remainder to 1/3.24 for Men and 1/1.25 for Women, and the Men-to-Women Ratio of Age-Standardized Rates Widened from 4.33 to 7.44 [M044]. Zenodo. https://doi.org/10.5281/zenodo.22974498
- Yamagishi, Y. (2026). The Mean HbA1c Rises Only 0.426 from Ages 40–44 to 70–74, Yet People at 6.5 or Above Increase 5.11-Fold — Shifting by the Mean Alone Predicts 6.67%, the Actual Is 16.34% (Men, Specific Health Checkups 2022), and People at 8.4 or Above Are Most Common at 55–59 [M046]. Zenodo. https://doi.org/10.5281/zenodo.22974590
Reference
Yamagishi, Y. (2026). Women's Checkup Values Change Most at the Step from Ages 45–49 to 50–54 [M052]. Zenodo.
DOI: 10.5281/zenodo.22974950
YOI: https://www.yamagishiyuuki.com/yoi/M052
ORCID: 0009-0006-8587-3450
PDF (English) · PDF (Japanese) · Date proof of the English PDF (OpenTimestamps .ots) · SHA256SUMS
The record page for this paper (in Japanese, with the PDFs in each language and the date proof): YOI M052. This paper is a preprint and has not been peer reviewed.