Abstract
Using the "smoking status" tables of the National Health and Nutrition Survey for 2013 and 2023 (the same 4 answer choices, 10-year age groups), the fall in the share smoking now was lined up in two ways: "comparing at the same age" (the same age group in 2013 and 2023) and "following the same birth years" (an age group in 2013 and the group 10 years older in 2023). It claims no new mathematical theorem and no new law.
First, the tables are consistent. Both years have the same 4 answer choices, the totals equal the sums of the choices, and the 2023 shares smoking now (men 25.60%, women 6.95%, total 15.73%) agree with the summary's 25.6%, 6.9%, and 15.7%. The summary states that "over these 10 years it has decreased significantly for both men and women" (Section 3).
Second, compared at the same age, the fall was larger at younger ages. Men aged 20–29 went from 36.3% to 20.6% (−15.8 points, 4.00 times the standard error) and 30–39 from 44.0% to 29.9% (−14.2, 3.94 times). Women aged 20–29 went from 12.7% to 5.2% (−7.5) (Section 4).
Third, this is the core of the paper. Following the same birth years, the fall of the young generations is small. Men who were 20–29 in 2013 were at 29.9% in 2023 (at 30–39), −6.5, and men who were 30–39 fell −10.6. For those who ever smoked, the difference is −17.5 and −20.2 points at the same age but −4.4 and −4.6 following the same birth years: much of the fall at young ages comes from later-born people having fewer who ever smoked at all (Section 5).
Fourth, on the older side, the fall following the same birth years is larger. Men who were 40–49 and 50–59 in 2013 fell −7.9 and −13.0 when followed, against −6.0 and −10.0 at the same age. Women aged 50–59 fell −4.7 when followed and −0.1 at the same age (Section 5).
Fifth, with only two years, the effects of age, period, and birth year cannot be fully separated. The share of the same birth years who ever smoked fell by 4.4–11.2 points for men after 10 years; since someone who once smoked does not become someone who never did, differences in how people answered, or in who answered, are included (Section 6).
Sixth, what separates them is whether we compare at the same age or follow the same birth years. "The smoking rate fell" mixes two forms: people newly reaching adulthood not starting, and the same people smoking less as they age.
Scope note: This paper claims no new mathematical theorem and no new law — the counts and shares are in public tables; the paper only takes the difference between two years in two ways and lines them up. This paper is a structural interpretation of the shape of numbers in published aggregate data, and is not medical advice, diagnosis, or a treatment recommendation. The author is not a physician. For decisions about individual health, consult a physician or medical institution. It is a preprint that has not been peer reviewed. It does not go into why smoking fell (prices, regulation, awareness of health, and so on). It does not judge people who smoke or do not smoke. It compares only two years (2013 and 2023) and cannot fully separate the effects of age, period, and birth year. "The same birth years" is an approximation shifting the 10-year age groups by 10 years, and ages 70+ are not followed because the group is open-ended. The standard error is a guide assuming simple sampling. Prefectures are not compared. It is not one person's outlook. About the data: the National Health and Nutrition Survey (e-Stat) is used under the Public Data License (Version 2.0), and the ministry's summary under the Public Data License (Version 1.0); this paper's shares, differences, and ratios were produced by processing them. What the paper adds: taking the fall in the share smoking now in two ways, "same age" and "same birth years," in the tables of the same question for 2013 and 2023, and showing that younger generations have fewer people who ever smoked while on the older side the fall of the same people is larger.
1. Notation and question
- Smoking now: "smoke every day" + "smoke on some days." The same as the summary's "current habitual smokers."
- Ever smoked: smoking now + "used to smoke but have not smoked for a month or more."
- Comparing at the same age: the difference between an age group in 2013 and the same age group in 2023.
- Following the same birth years: the difference between an age group in 2013 and the group 10 years older in 2023 (people born in about the same years).
- Guide to the standard error: the square root of the sum over the two years of √(p(1−p)/n) squared.
Question: Is the fall in the share smoking a replacement of birth years (generations), or a change in the same people as they age?
Observation 1.1: M044 showed that COPD death rates line up by birth year for men but hardly for women. This paper compares smoking itself, which is related to that, in two ways: at the same age and for the same birth years.
2. Survey and design
To be honest: the design was decided after seeing the tables.
| Content | |
|---|---|
| Tables | National Health and Nutrition Survey 2013, Table 75, and 2023, Table 73 (smoking status; counts and shares by sex and age group) |
| Years | 2013 and 2023 (exactly 10 years apart, so the 10-year age groups can be shifted by exactly one) |
| Noticed while surveying | As the summary's note says, the definition of "current habitual smokers" differs only in 2011 and 2012. 2013 and 2023 have the same 4 answer choices, so only these two years were used |
| Yardsticks | The differences at the same age and for the same birth years in the shares smoking now and ever smoked |
3. Data and checks
Calculation 3.1 The 3 retrieved files (2 tables and the 2023 summary) were fixed by SHA-256, and the following was checked.
- The 2013 table is "National Health and Nutrition Survey 2013, Table 75, smoking status," and the 2023 table is "2023, Table 73, smoking status." Both have 4 answer choices and 6 age groups for men, women, and the total, with total count = sum of the 4 choices.
- The summary's note states that 2011 and 2012 used a different definition, "among those who had ever smoked habitually" (from 2013 on the definition is the same).
- The 2023 summary states that "the share of current habitual smokers is 15.7%, men 25.6% and women 6.9%; over these 10 years it has decreased significantly for both men and women," with the definition "smoke every day" or "smoke on some days." Men 25.60%, women 6.95%, and total 15.73% from the 2023 table agree when rounded.
4. Shares by age
Calculation 4.1 Shares smoking now and ever smoked (%)
| Age | Men: 2013 now | Men: 2023 now | Women: 2013 now | Women: 2023 now | Men: 2013 ever | Men: 2023 ever |
|---|---|---|---|---|---|---|
| 20–29 | 36.3 | 20.6 | 12.7 | 5.2 | 39.0 | 21.5 |
| 30–39 | 44.0 | 29.9 | 12.0 | 8.7 | 54.8 | 34.6 |
| 40–49 | 39.5 | 33.4 | 12.4 | 10.1 | 53.2 | 50.1 |
| 50–59 | 41.5 | 31.5 | 11.8 | 11.7 | 53.9 | 42.0 |
| 60–69 | 33.2 | 28.5 | 6.4 | 7.1 | 47.2 | 48.0 |
| 70+ | 14.5 | 16.2 | 2.3 | 2.3 | 27.8 | 31.2 |
Observation 4.2: Compared at the same age, the fall was larger at younger ages. Men aged 20–29 went from 36.3% to 20.6% and 30–39 from 44.0% to 29.9%. At 70+, men went from 14.5% to 16.2%, and women stayed at 2.3%. The count per group is 300–1,058 people in 2013 and 193–909 in 2023.
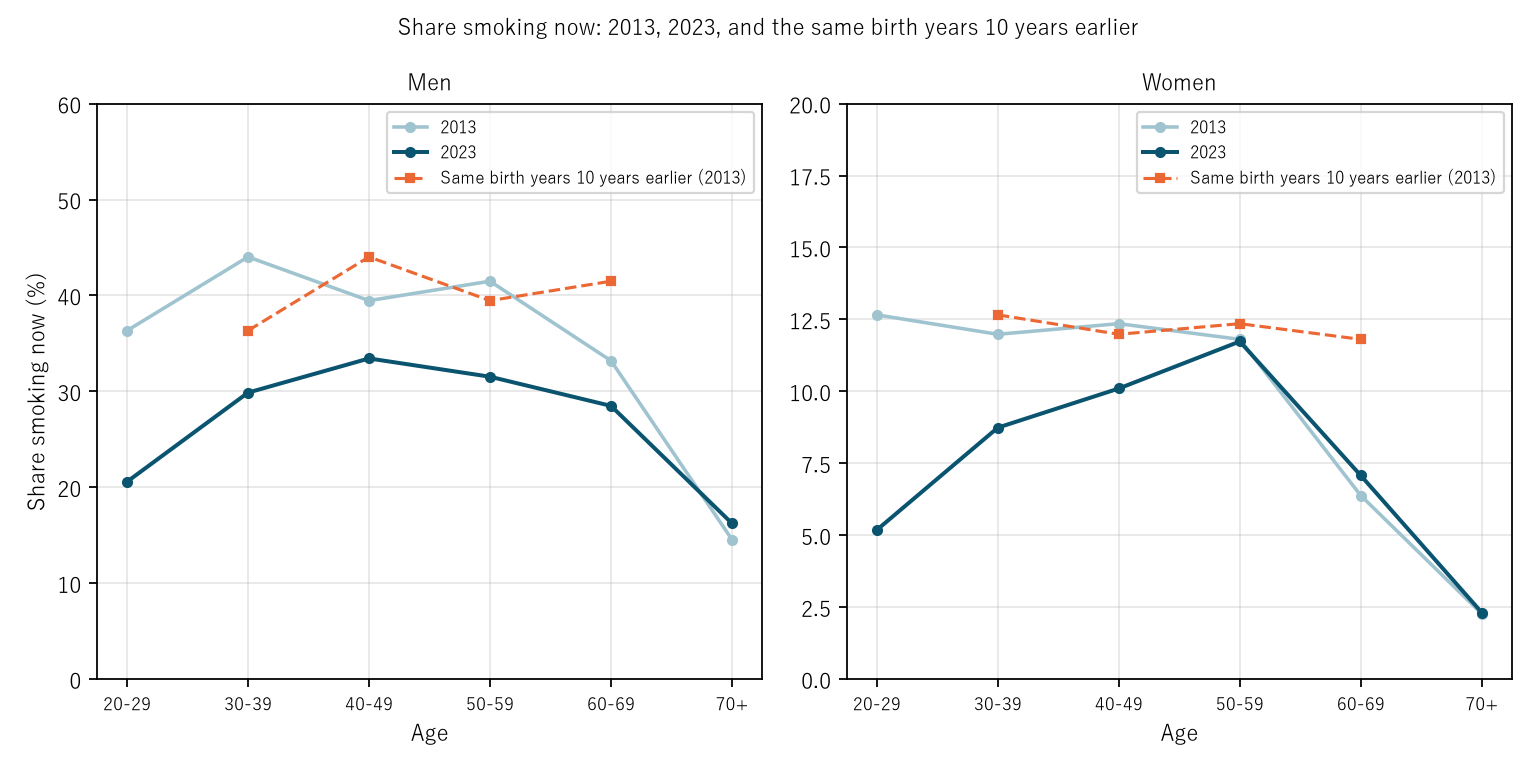
Figure 1: Share smoking now. Light blue is 2013, navy 2023, and the orange dashed line is the 2013 values shifted 10 years to the right (how much the people of that age in 2023 smoked 10 years earlier). The gap between navy and light blue is "same age," and between navy and orange "same birth years."
5. Core — same age or same birth years
Calculation 5.1 Difference in the share smoking now, 2013 → 2023 (points; guide to the standard error in parentheses)
| Age in 2013 | Men: same age | Men: same birth years | Women: same age | Women: same birth years |
|---|---|---|---|---|
| 20–29 | -15.8 (3.9) | -6.5 (3.8) | -7.5 (2.5) | -3.9 (2.5) |
| 30–39 | -14.2 (3.6) | -10.6 (3.5) | -3.2 (2.2) | -1.9 (2.1) |
| 40–49 | -6.0 (3.3) | -7.9 (3.0) | -2.3 (2.0) | -0.6 (1.9) |
| 50–59 | -10.0 (3.1) | -13.0 (3.0) | -0.1 (1.9) | -4.7 (1.8) |
Calculation 5.2 Difference in the share who ever smoked, 2013 → 2023 (points)
| Age in 2013 | Men: same age | Men: same birth years | Women: same age | Women: same birth years |
|---|---|---|---|---|
| 20–29 | -17.5 | -4.4 | -9.9 | -2.2 |
| 30–39 | -20.2 | -4.6 | -5.3 | -4.1 |
| 40–49 | -3.0 | -11.2 | -1.7 | -0.1 |
| 50–59 | -11.9 | -5.9 | +0.9 | -5.4 |
Observation 5.3: For people who were 20–29 and 30–39 in 2013, for both men and women, the fall compared at the same age is larger than the fall following the same birth years (men −15.8 vs −6.5, −14.2 vs −10.6). For those who ever smoked the difference is clear: for men −17.5 and −20.2 at the same age, −4.4 and −4.6 for the same birth years. Much of the fall at young ages comes from later-born people having fewer who ever smoked at all. Meanwhile, for men who were 40–49 and 50–59 in 2013, the fall following the same birth years (−7.9, −13.0) is larger, and for women aged 50–59 the followed fall of −4.7 is larger than the −0.1 at the same age. This is the form of the same people smoking less as they age.
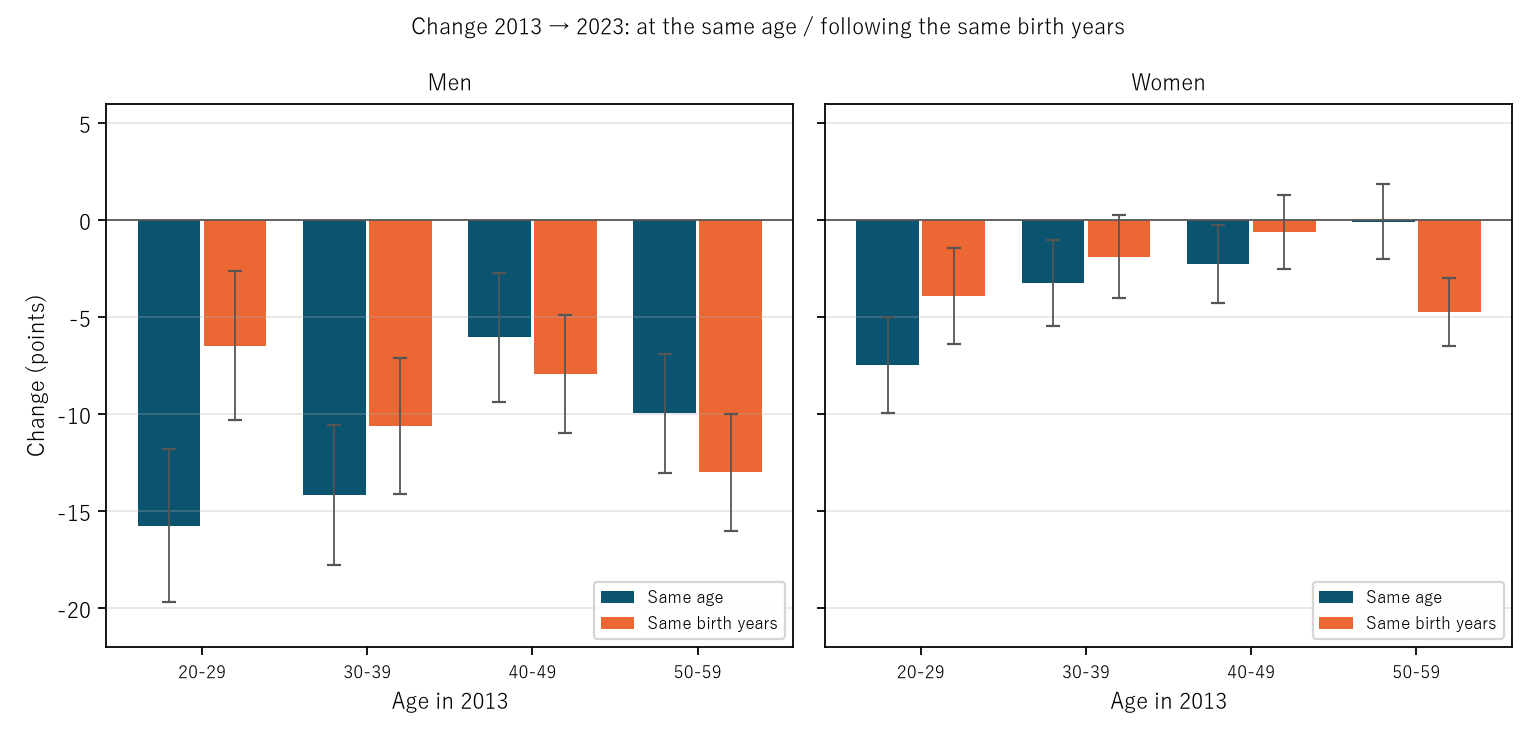
Figure 2: For each age in 2013, the difference at the same age (navy) and following the same birth years (orange). Vertical lines show the range of the guide to the standard error.
6. What two years cannot separate
Observation 6.1: The difference following the same birth years includes both growing older (age) and 10 years passing (period), and the difference at the same age includes both the replacement of birth years (generation) and period. With only two years, these three cannot be fully separated. Also, the share of the same birth years who ever smoked fell by 4.4–11.2 points for men after 10 years (−11.2 for men who were 40–49 in 2013). Since someone who once smoked does not become someone who never did, this includes differences in how people answered, such as former smokers answering "do not smoke," or a change over 10 years in who answered. The guide to the standard error is 1.8–3.9 points, and each difference should be read with this range in mind.
7. Limitations
- Only two years (2013 and 2023) are compared, and age, period, and birth year cannot be fully separated.
- "The same birth years" is an approximation shifting the 10-year groups by 10 years, and ages 70+ are not followed because the group is open-ended.
- The share of the same birth years who ever smoked falls (4.4–11.2 points for men), so differences in how people answered, or in who answered, are included.
- The standard error is a guide assuming simple sampling, without the effect of the survey design.
- It does not go into why smoking fell or judge people who smoke or do not smoke. Prefectures are not compared. It is not one person's outlook.
Conclusion
From 2013 to 2023, the share of men aged 20–29 who smoke now fell 15.8 points compared at the same age but 6.5 points following the same birth years. Much of the fall at young ages came from later-born people having fewer who ever smoked at all, while for men aged 40–59 the fall following the same people was larger.
One thing separates them — whether we compare at the same age or follow the same birth years.
When you hear that "the smoking rate fell," check together whether it compares people of the same age or follows the same people.
Data and reproduction
| Data | National Health and Nutrition Survey (Ministry of Health, Labour and Welfare, e-Stat), 2013 Table 75 and 2023 Table 73; Summary of Results of the 2023 National Health and Nutrition Survey (retrieved 26 September 2026) |
| Terms of use | e-Stat follows the Public Data License (Version 2.0), and the ministry's pages follow the Public Data License (Version 1.0). This paper's shares, differences, and ratios were produced by processing these and are not figures produced by the government |
| Scope | Japan; ages 20+; 2013 and 2023 |
| Verification | 検算/M053.py (--zu also writes the figures). Every number in the text is taken from 検算/M053_output.txt |
| Raw data | The 3 retrieved files and SOURCES.md (URLs, retrieval dates, SHA-256, terms of use, definitions and calculation) in data/ |
| Figures | 図/M053_zu1 and 図/M053_zu2 (png, svg, English version) |
References
- Ministry of Health, Labour and Welfare. National Health and Nutrition Survey 2013, Table 75; 2023, Table 73 (in Japanese). e-Stat (accessed 26 September 2026). https://www.e-stat.go.jp/
- Ministry of Health, Labour and Welfare. Summary of Results of the 2023 National Health and Nutrition Survey (in Japanese) (accessed 26 September 2026). https://www.mhlw.go.jp/content/10900000/001338334.pdf
- Yamagishi, Y. (2026). COPD Death Rates Line Up by Birth Year for Men but Hardly for Women — Across Age × Year in 1995–2015, Aligning by Birth Year Cuts the Remainder to 1/3.24 for Men and 1/1.25 for Women, and the Men-to-Women Ratio of Age-Standardized Rates Widened from 4.33 to 7.44 [M044]. Zenodo. https://doi.org/10.5281/zenodo.22974498
Reference
Yamagishi, Y. (2026). From 2013 to 2023 the Share of Men Aged 20–29 Who Smoke Now Fell 15.8 Points at the Same Age but 6.5 Points Following the Same Birth Years [M053]. Zenodo.
DOI: 10.5281/zenodo.22975134
YOI: https://www.yamagishiyuuki.com/yoi/M053
ORCID: 0009-0006-8587-3450
PDF (English) · PDF (Japanese) · Date proof of the English PDF (OpenTimestamps .ots) · SHA256SUMS
The record page for this paper (in Japanese, with the PDFs in each language and the date proof): YOI M053. This paper is a preprint and has not been peer reviewed.