Abstract
Using the National Police Agency's "30-day road traffic deaths" statistics (1993–2025; by age group 2015–2025) and the Vital Statistics (transport accidents by type and year, and road traffic accidents by age in 2024), three ways of counting road traffic deaths were lined up. It claims no new mathematical theorem and no new law.
First, the tables are consistent. In the police tables, in every year and age group, 30-day deaths = 24-hour deaths + later deaths, the age groups sum to the total, and the yearly table matches the totals of the age tables. In the Vital Statistics road table, the ages and the types of road user each sum to the total. The definitions of 24-hour and 30-day deaths were checked against the text of the police document (Section 3).
Second, deaths in 2024 line up as police 24-hour deaths 2,663 < Vital Statistics road traffic 3,100 < police 30-day deaths 3,221 < Vital Statistics transport accidents (V01-V98) 3,511. V01-V98 includes water and air and is not limited to roads, so it differs from the road count by 411 (Section 4).
Third, the police ratio of 30-day to 24-hour deaths stays within 1.144–1.232 from 1993 to 2025. Over that time 24-hour deaths fell from 10,945 to 2,663 (0.243-fold), but the ratio between the two time limits hardly moved (Section 5).
Fourth, this is the core of the paper. Among six age groups in 2024, Vital Statistics road deaths exceed police 30-day deaths only at 80+ (955 vs 945), and the ratio to 24-hour deaths is largest at 80+ both for the 30-day count (1.289) and for Vital Statistics road deaths (1.303). The share aged 65+ grows in the order 24 hours 0.568 < 30 days 0.589 < Vital Statistics road 0.600 (Section 6).
Fifth, the share of later deaths (those dying after 24 hours but within 30 days), summed over 2015–2025, is smallest at 25–44 (0.114) and rises through 45–64 (0.143) and 65–79 (0.195) to 80+ (0.203). In every one of the 11 years, the share for 65+ is larger than for under 65 (Section 7).
Sixth, what separates them is the time limit from accident to death (24 hours, 30 days, or none) and who counts what as a traffic accident. The longer the time limit, the more deaths of older people are counted, and which number is used changes how the age pattern looks.
Scope note: This paper claims no new mathematical theorem and no new law — the three numbers are in public tables, and this paper only aligned them to common age groups and computed ratios. This paper is a structural interpretation of the shape of numbers in public aggregate data; it is not medical advice, not a diagnosis, and not a treatment recommendation. The author is not a physician. Decisions about individual health should be discussed with a physician or a medical institution. This is a preprint that has not been peer reviewed. It does not go into how to prevent accidents, whether driving is good or bad, or the evaluation of traffic policy. It does not blame those involved in accidents or those who lost family members in them. The police numbers and the Vital Statistics numbers are counted by different people under different rules, and this paper cannot separate what makes up the difference (time limit, scope of "road," how the cause is determined, and so on) with these tables. The Vital Statistics tables have no category for the time from accident to death. Prefectures and countries are not compared. Considering that people who lost family in accidents may read it, it is not written as an outlook for any one person. About the data: the Road Traffic Statistics (National Police Agency) and the Vital Statistics (Ministry of Health, Labour and Welfare) were taken from e-Stat and used under the Government Standard Terms of Use (Version 2.0), and the ratios in this paper were created by processing them. What this paper adds: aligning three ways of counting road traffic deaths to common age groups, and showing that the increase from lengthening the time limit is largest at 80+, that Vital Statistics road deaths exceed the police 30-day count only at 80+, and that the share of later deaths bottoms out at 25–44.
1. Notation and question
- 24-hour deaths: persons who died within 24 hours of a traffic accident (police).
- Later deaths: persons who died after 24 hours but within 30 days of a traffic accident (police; "30-day deaths" in the Japanese term).
- 30-day deaths: 24-hour deaths + later deaths (police).
- Road traffic accidents: the number in Vital Statistics Stored Table, Deaths, Table 11 (2024). The table has no category for the time from accident to death.
- V01-V98: the total of transport accidents in Vital Statistics Table 5.33, including land, water, and air.
- Six age groups: 0–14, 15–24, 25–44, 45–64, 65–79, and 80+ (the police 5-year groups aligned to the Vital Statistics groups).
Question: How much do "road traffic deaths" differ depending on which number is used? Is the difference the same across ages?
Observation 1.1: M045 showed that the number of "people with diabetes" changes by orders of magnitude with what is counted. This paper shows that the same "road traffic deaths" have three ways of counting, and that their differences are not the same across ages.
2. Survey and design
To be honest: the design was decided after seeing the tables.
| Content | |
|---|---|
| Tables | Police "30-day road traffic deaths" 2-1 (yearly), 2-2, 2-4, 2-6 (by age group) and the full PDF; Vital Statistics Table 5.33 (transport accidents × year) and Stored Table, Deaths, Table 11 (road traffic × age, 2024) |
| Noticed in the survey | Summing the police 5-year groups fits exactly into the Vital Statistics road age groups (15–24, 25–44, 45–64, 65–79, 80+) |
| Years compared | 2024, when all three numbers exist. The police ratio over 1993–2025, and the share of later deaths summed over the 11 years 2015–2025 |
| Measures | The ratio to 24-hour deaths, the share aged 65+, and the share of later deaths |
3. Data and checks
Calculation 3.1 The 7 retrieved files were fixed by SHA-256, and the following was checked.
- The police PDF contains the definition sentences for 30-day, 24-hour, and later deaths (the definitions in Section 1 follow them).
- Table 2-1 has the 33 years 1993–2025; in every year 30-day = 24-hour + later, and the ratio column = 30-day ÷ 24-hour (to 2 decimals).
- The three age tables (2015–2025): the 18 age groups sum to the total, under 65 + 65 and over = total, and in every age group 30-day = 24-hour + later. The numbers in 2-1 match the totals of the age tables.
- Table 5.33: the 15 years are 1995, 2000, 2005, 2010, and 2014–2024, and in every year the total = the sum of 12 types.
- Table 11: total = sum of ages (unknown is 0), men + women = total, and total = the sum of 9 types of road user.
4. The three numbers in 2024
Calculation 4.1 Road traffic deaths in 2024
| Way of counting | Deaths | Ratio to 24-hour deaths |
|---|---|---|
| Police 24-hour deaths | 2,663 | 1 |
| Vital Statistics road traffic accidents | 3,100 | 1.164 |
| Police 30-day deaths | 3,221 | 1.210 |
| Vital Statistics transport accidents (V01-V98) | 3,511 | 1.318 |
Observation 4.2: Deaths in 2024 line up as 24-hour 2,663 < Vital Statistics road 3,100 < 30-day 3,221 < V01-V98 3,511. Vital Statistics road deaths are 0.962 times the police 30-day count. V01-V98 is not limited to roads, and its difference from the road count, 411, includes water 80 and air 11. For 2025 only the police numbers exist: 24-hour 2,547 and 30-day 3,089.
5. The ratio between time limits has hardly moved
Calculation 5.1 Yearly numbers and ratios
| Year | Police 24-hour | Police 30-day | Vital Statistics V01-V98 | V01-V98 ÷ 24-hour | V01-V98 ÷ 30-day |
|---|---|---|---|---|---|
| 1995 | 10,684 | 12,675 | 15,147 | 1.418 | 1.195 |
| 2005 | 6,937 | 7,997 | 10,028 | 1.446 | 1.254 |
| 2015 | 4,117 | 4,885 | 5,646 | 1.371 | 1.156 |
| 2024 | 2,663 | 3,221 | 3,511 | 1.318 | 1.090 |
Observation 5.2: The police ratio of 30-day to 24-hour deaths stays within 1.144 (2006) to 1.232 (2022) over 1993–2025. From 1993 to 2024, 24-hour deaths became 0.243 times, 30-day deaths 0.243 times, and later deaths 0.240 times, falling at nearly the same rate. Vital Statistics V01-V98 exceeds the police 30-day count in every one of the 15 years in the table, with ratios of 1.088–1.254.
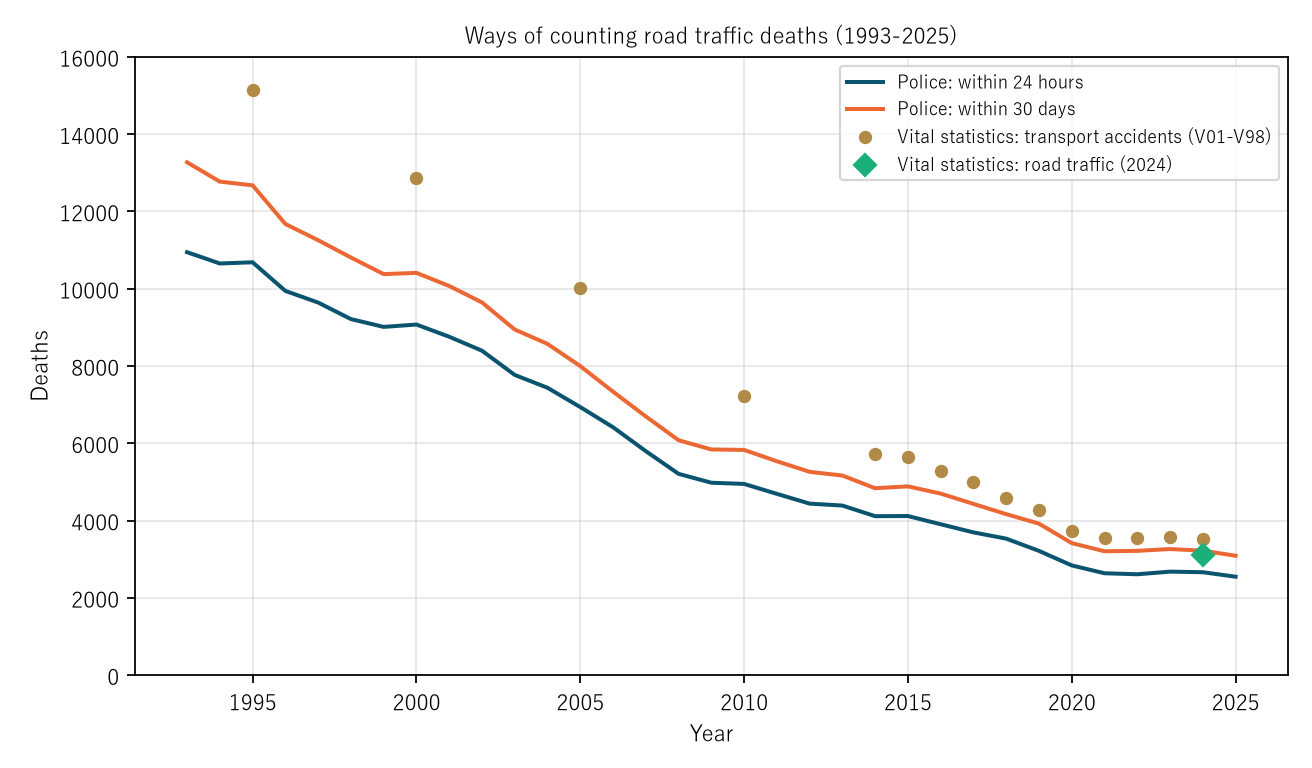
Figure 1: Road traffic deaths, 1993–2025. Navy is police 24-hour deaths, orange is police 30-day deaths, gold dots are Vital Statistics transport accidents (V01-V98, not limited to roads), and the green diamond is Vital Statistics road traffic accidents (2024).
6. Core — the increase from lengthening the time limit is not the same across ages
Calculation 6.1 Six age groups in 2024
| Age | 24-hour | 30-day | VS road | 30-day ÷ 24-hour | Road ÷ 24-hour | Road ÷ 30-day |
|---|---|---|---|---|---|---|
| 0–14 | 38 | 42 | 40 | 1.105 | 1.053 | 0.952 |
| 15–24 | 189 | 216 | 210 | 1.143 | 1.111 | 0.972 |
| 25–44 | 316 | 355 | 329 | 1.123 | 1.041 | 0.927 |
| 45–64 | 607 | 711 | 661 | 1.171 | 1.089 | 0.930 |
| 65–79 | 780 | 952 | 905 | 1.221 | 1.160 | 0.951 |
| 80+ | 733 | 945 | 955 | 1.289 | 1.303 | 1.011 |
Observation 6.2: Of the six groups, Vital Statistics road deaths exceed the police 30-day count only at 80+ (955 vs 945). In the other five groups they are 0.927–0.972 times, below the 30-day count. The ratio to 24-hour deaths is largest at 80+ both for the 30-day count (1.289) and for Vital Statistics road deaths (1.303). The six groups sum to the police total and to the Vital Statistics total.
Observation 6.3: The share aged 65+ is 0.568 for 24-hour deaths, 0.589 for 30-day deaths, and 0.600 for Vital Statistics road deaths — larger the longer the time limit (or with no limit). A number like "what share of road traffic deaths are older people" changes with the way of counting. The pattern that Vital Statistics road deaths exceed the 30-day count only at 80+ fits with more older people dying after 30 days, but since the police and the Vital Statistics are counted by different people under different rules, what makes up the difference cannot be separated with these tables.
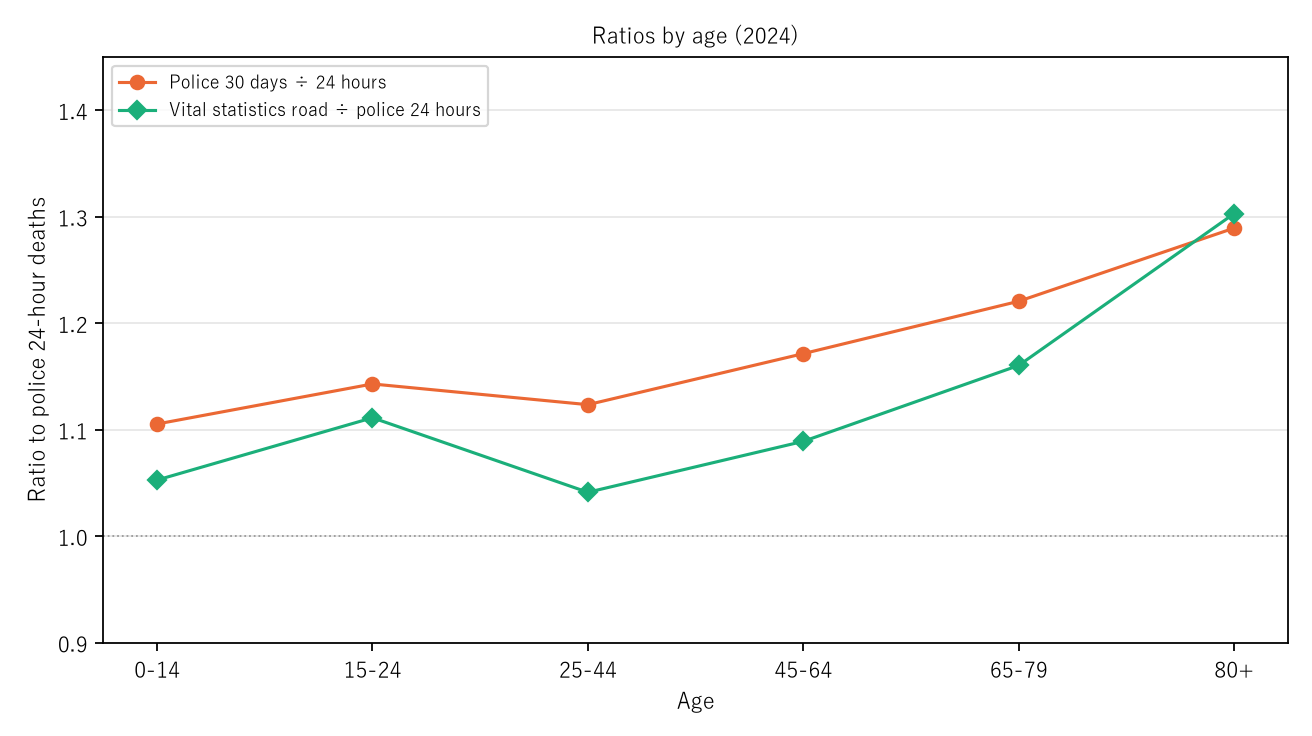
Figure 2: For each of the six age groups in 2024, the ratio to police 24-hour deaths. Orange is police 30-day ÷ 24-hour, green is Vital Statistics road ÷ police 24-hour. The dotted line is 1.
7. The share of later deaths bottoms out at 25–44
Calculation 7.1 Later deaths ÷ 30-day deaths (summed over the 11 years 2015–2025)
| Age | Later deaths | 30-day deaths | Share of later deaths |
|---|---|---|---|
| 0–14 | 110 | 623 | 0.177 |
| 15–24 | 379 | 3,169 | 0.120 |
| 25–44 | 565 | 4,940 | 0.114 |
| 45–64 | 1,272 | 8,887 | 0.143 |
| 65–79 | 2,513 | 12,898 | 0.195 |
| 80+ | 2,236 | 10,993 | 0.203 |
Observation 7.2: The share of later deaths is smallest at 25–44 (0.114) and grows with age from there: 45–64 0.143, 65–79 0.195, 80+ 0.203. Ages 0–14 (0.177) and 15–24 (0.120) are larger than 25–44. To be honest: I expected it to keep rising from 15–24, and that expectation missed. In every one of the 11 years, the share for 65+ (0.176–0.231) is larger than for under 65 (0.120–0.141).
8. Limitations
- The police numbers and the Vital Statistics numbers are counted by different people under different rules. Which of the time limit, the scope of "road," how the cause is determined, and so on makes the difference cannot be separated with these tables. The Vital Statistics tables have no category for the time from accident to death.
- Vital Statistics road traffic deaths were used only for 2024. Yearly comparisons used V01-V98, which is not limited to roads.
- The age groups follow the Vital Statistics boundaries. Ages 0–14 have small numbers, so yearly ratios are unstable; the share of later deaths was computed after summing 11 years.
- It does not go into how to prevent accidents, whether driving is good or bad, or policy evaluation. Prefectures and countries are not compared. It is not an outlook for any one person.
Conclusion
Road traffic deaths in 2024 differed with the way of counting: police 24-hour deaths 2,663, Vital Statistics road traffic 3,100, and police 30-day deaths 3,221. The police ratio between the two time limits hardly moved over 1993–2025, staying at 1.144–1.232, but by age group in 2024 the ratio to 24-hour deaths was largest at 80+, at 1.289 (30-day) and 1.303 (Vital Statistics road), and Vital Statistics road deaths exceeded the 30-day count only at 80+. The share of later deaths rose from a bottom of 0.114 at 25–44 to 0.203 at 80+.
Two things separate them — the time limit from accident to death (24 hours, 30 days, or none) and who counts what as a traffic accident.
On hearing "so many people died in traffic accidents" or "so much of them were older people," check together whether it is 24 hours or 30 days, a police number or a Vital Statistics number, and whether it is limited to roads.
Data and reproduction
| Data | Road Traffic Statistics, "30-day road traffic deaths," Tables 2-1, 2-2, 2-4, 2-6 and the full document (National Police Agency; e-Stat), and Vital Statistics 2024, Volume 1 Table 5.33 and Stored Table, Deaths, Table 11 (Ministry of Health, Labour and Welfare; e-Stat) (retrieved 26 September 2026) |
| Terms of use | e-Stat follows the Government Standard Terms of Use (Version 2.0). The ratios in this paper were created by processing them and are not figures produced by the government |
| Scope | Japan, 1993–2025 (Vital Statistics road deaths for 2024) |
| Checker | 検算/M066.py (--zu also draws the figures). Every number in the text is taken from 検算/M066_output.txt |
| Raw data | The retrieved files and SOURCES.md in data/ (URL, retrieval date, SHA-256, terms of use, definitions and how calculations are set up) |
| Figures | 図/M066_zu1, 図/M066_zu2 (png, svg, English versions) |
References
- National Police Agency. Road Traffic Statistics, 30-day road traffic deaths, Tables 2-1, 2-2, 2-4, and 2-6, and the full document "30-day road traffic deaths in 2025" (in Japanese). e-Stat (accessed 26 September 2026). https://www.e-stat.go.jp/
- Ministry of Health, Labour and Welfare. Vital Statistics 2024 (final figures), Volume 1 Table 5.33 and Stored Table, Deaths, Table 11 (in Japanese). e-Stat (accessed 26 September 2026). https://www.e-stat.go.jp/
- Yamagishi, Y. (2026). The Number of "People with Diabetes" Changes by Orders of Magnitude with What Is Counted — Per 100,000 at 70+, 19,500 Strongly Suspected by Test, 12,130 Visiting a Clinic, 449–1,948 in Care on the Survey Day, and 44.8 Deaths a Year; the Rise from 40–49 Also Ranges from 3.1-Fold to 29.4-Fold [M045]. Zenodo. https://doi.org/10.5281/zenodo.22974556
Reference
Yamagishi, Y. (2026). Road Traffic Deaths in 2024 Were 2,663 by the Police 24-Hour Count, 3,221 by the Police 30-Day Count, and 3,100 by Vital Statistics [M066]. Zenodo.
DOI: 10.5281/zenodo.22977686
YOI: https://www.yamagishiyuuki.com/yoi/M066
ORCID: 0009-0006-8587-3450
PDF (English) · PDF (Japanese) · Date proof of the English PDF (OpenTimestamps .ots) · SHA256SUMS
The record page for this paper (in Japanese, with the PDFs in each language and the date proof): YOI M066. This paper is a preprint and has not been peer reviewed.