Abstract
Using the Vital Statistics tables on unintentional injuries (yearly by type, 1995–2024; by place of occurrence and, for home accidents, by cause in 2024) and the table of road traffic deaths by age, deaths from accidents in the home and deaths from traffic accidents were lined up. It claims no new mathematical theorem and no new law.
First, the tables are consistent. The total of unintentional injuries equals the sum of 14 major groups in every year, and the 2024 total excluding transport accidents, 42,232, matches the total of the place-of-occurrence table. The total of the home-accident cause table matches the "home" row of the place table, also for combined ages (Section 3).
Second, the largest major group of unintentional injury changed from transport accidents in 1995 (15,147) to falls in 2024 (11,935). Transport accidents fell to 0.232 times, falls rose 2.019-fold, and drowning in a bathtub 2.438-fold. By the table years, falls and other accidental suffocation have exceeded transport accidents since 2010, and drowning in a bathtub since 2016 (Section 4).
Third, of the 42,232 non-transport unintentional-injury deaths in 2024, the place of occurrence was home for 17,320 (0.410) and unspecified for 17,625 (0.417); unspecified is larger. At 80+, unspecified is 0.508 and home 0.357 (Section 5).
Fourth, this is the core of the paper. Among five age groups in 2024, home accidents are fewer than road traffic deaths only at 15–44 (389 vs 539), and home ÷ road grows with age from 0.72 at 15–44 to 2.19 at 45–64, 6.01 at 65–79, and 10.39 at 80+. Over all ages, home accidents are 5.59 times road traffic deaths (Section 6).
Fifth, the leading cause of home-accident deaths is accidental drowning (7,775; 0.449), of which drowning in a bathtub is 7,166 (0.414 of home accidents), 0.948 of them aged 65+. Among home-accident groups, the share under 65 is largest for accidental poisoning (0.768), the opposite age pattern to home accidents as a whole (0.112) (Section 7).
Sixth, what separates them is where the death was recorded as occurring, age, and the type of accident. "Accidents at home outnumber traffic accidents" holds for all ages and for older people, but not at 15–44, and deaths with an unspecified place are as many as those at home.
Scope note: This paper claims no new mathematical theorem and no new law — the death counts are in public tables, and this paper only aligned them to common age groups and computed ratios. This paper is a structural interpretation of the shape of numbers in public aggregate data; it is not medical advice, not a diagnosis, and not a treatment recommendation. The author is not a physician. Decisions about individual health should be discussed with a physician or a medical institution. This is a preprint that has not been peer reviewed. It does not go into how to prevent accidents, how to bathe or eat, or whether homes are good or bad. The place of occurrence is the place written on the death record, and whether an "unspecified place" was inside a home cannot be known from these tables. If some deaths with an unspecified place occurred at home, home accidents could be more than counted. Road traffic deaths are counted differently from the police numbers (M066). The age groups are of unequal width, so comparisons between groups are of death counts, not rates. It does not blame those who lost family members in accidents. Prefectures are not compared. It is not written as an outlook for any one person. About the data: the Vital Statistics (e-Stat) are used under the Government Standard Terms of Use (Version 2.0), and the ratios in this paper were created by processing them. What this paper adds: lining up home accidents and road traffic deaths in common age groups, and showing that home accidents are fewer only at 15–44, that deaths with an unspecified place are as many as those at home and exceed them at 80+, and in which table year the largest type of unintentional injury changed from transport accidents to falls.
1. Notation and question
- Unintentional injuries: causes V01-X59 (transport accidents V01-V98 and non-transport W00-X59).
- Home accidents: non-transport unintentional injuries whose place of occurrence is "home" (Tables 5.34 and 5.35).
- Place unspecified: those whose place of occurrence is "unspecified place" (Table 5.34).
- Road traffic accidents: the number in Stored Table, Deaths, Table 11 (2024; M066).
- Five age groups: 0–14, 15–44, 45–64, 65–79, and 80+ (aligning the boundaries of the two tables; the groups are of unequal width).
Question: How many deaths from accidents in the home are there compared with traffic accidents? Is that the same across ages?
Observation 1.1: M066 showed that road traffic deaths have three ways of counting and that their differences are not the same across ages. This paper lines up, in the same age groups, the accidents next to traffic accidents: those in the home.
2. Survey and design
To be honest: the design was decided after seeing the tables.
| Content | |
|---|---|
| Tables | Vital Statistics 2024, Volume 1 Table 5.30 (unintentional injuries × year), Table 5.34 (non-transport place of occurrence × age, 2024), Table 5.35 (home-accident causes × age, 2024), and Stored Table, Deaths, Table 11 (road traffic × age, 2024) |
| Noticed in the survey | "Unspecified place" was about as common as "home." Counting only home accidents would miss how the place is recorded |
| Years compared | For the yearly series, the table years (1995, 2000, 2005, 2010, 2014–2024); place and age for 2024 only |
| Measures | The table year a type first exceeded transport accidents, shares by place, home ÷ road, and the share of each cause within home accidents |
3. Data and checks
Calculation 3.1 The 4 retrieved files were fixed by SHA-256, and the following was checked.
- Table 5.30: 15 years, and in every year total = the sum of 14 major groups.
- Table 5.34: ages are total, 0, 1–4, 5–14, 15–44, 45–64, 65–79, and 80+. The 10 places sum to the total (at every age); unknown age is 25. The total 42,232 = the 2024 total in Table 5.30 minus transport accidents.
- Table 5.35: the home total and ages (also when combined) match the home row of Table 5.34.
- Table 11: total 3,100 = sum of ages.
4. Yearly deaths by type of unintentional injury
Calculation 4.1 Deaths by type (Table 5.30)
| Group | 1995 | 2005 | 2010 | 2016 | 2024 | 2024 ÷ 1995 |
|---|---|---|---|---|---|---|
| Transport accidents | 15,147 | 10,028 | 7,222 | 5,280 | 3,511 | 0.232 |
| Falls | 5,911 | 6,702 | 7,517 | 8,030 | 11,935 | 2.019 |
| Drowning in a bathtub | 3,190 | 3,756 | 4,467 | 5,673 | 7,776 | 2.438 |
| Other accidental suffocation | 7,104 | 9,319 | 9,879 | 9,488 | 8,186 | 1.152 |
| All unintentional injuries | 45,323 | 39,863 | 40,732 | 38,314 | 45,743 | 1.009 |
Observation 4.2: The largest major group was transport accidents in 1995 and falls in 2024. The share of transport accidents among unintentional injuries went from 0.334 to 0.077. By the table years, falls exceeded transport accidents from 2010 (transport was larger up to 2005), and drowning in a bathtub from 2016 (transport was larger up to 2015), and have stayed above in every later table year. To be honest: I expected other accidental suffocation to have exceeded transport accidents by 2005, but in 2005 it was 9,319 vs 10,028; it exceeded them from 2010.
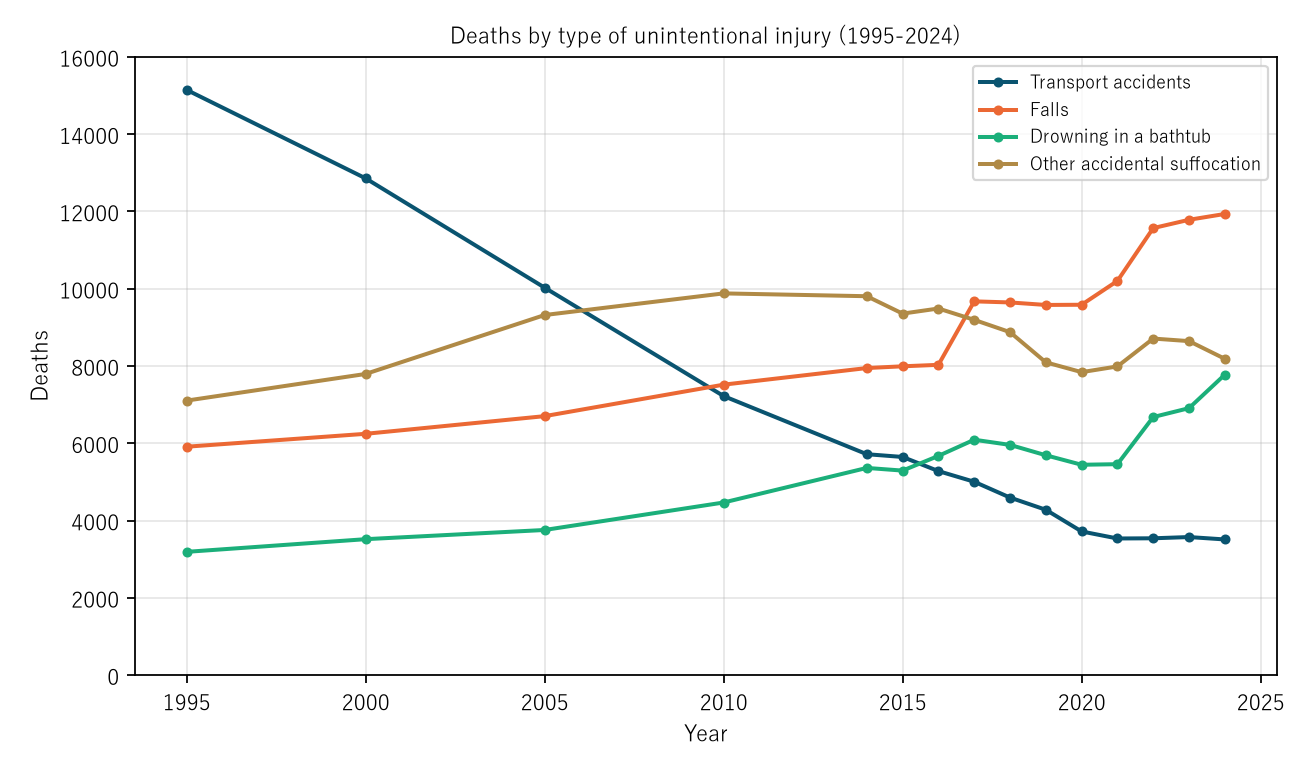
Figure 1: Deaths by type of unintentional injury, 1995–2024 (table years). Navy is transport accidents, orange falls, green drowning in a bathtub, and gold other accidental suffocation.
5. Place of occurrence — home and unspecified are about equal
Calculation 5.1 Place of occurrence of non-transport unintentional injuries in 2024 (Table 5.34)
| Age | Share at home | Share at unspecified place |
|---|---|---|
| All ages | 0.410 | 0.417 |
| 0 | 0.915 | 0.043 |
| 1–4 | 0.794 | 0.088 |
| 5–14 | 0.529 | 0.143 |
| 15–44 | 0.437 | 0.153 |
| 45–64 | 0.484 | 0.183 |
| 65–79 | 0.526 | 0.270 |
| 80+ | 0.357 | 0.508 |
Observation 5.2: Over all ages, home (17,320) and unspecified place (17,625) together exceed 0.8 of the total, and unspecified is larger. The unspecified share grows with age, and at 80+ it is 0.508, above home at 0.357. Residential institutions account for 1,745 (0.041) and other specified places for 2,323 (0.055).
6. Core — home accidents are fewer than traffic accidents only at 15–44
Calculation 6.1 Five age groups in 2024
| Age | Home accidents | Place unspecified | Road traffic | Home ÷ road |
|---|---|---|---|---|
| 0–14 | 107 | 15 | 40 | 2.67 |
| 15–44 | 389 | 136 | 539 | 0.72 |
| 45–64 | 1,450 | 548 | 661 | 2.19 |
| 65–79 | 5,437 | 2,794 | 905 | 6.01 |
| 80+ | 9,926 | 14,127 | 955 | 10.39 |
| All ages | 17,320 | 17,625 | 3,100 | 5.59 |
Observation 6.2: Of the five groups, home accidents are fewer than road traffic deaths only at 15–44. Home ÷ road grows with age from 0.72 at 15–44 to 2.19 at 45–64, 6.01 at 65–79, and 10.39 at 80+. Over all ages, home accidents are 5.59 times road traffic deaths and 4.93 times transport accidents (V01-V98).
Observation 6.3: If some deaths with an unspecified place occurred at home, home ÷ road could be larger. At 80+ in particular, there are 14,127 with an unspecified place, more than the 9,926 at home. "Accidents at home outnumber traffic accidents" holds, on the home-recorded deaths alone, for all ages and for every group except 15–44, but not at 15–44.
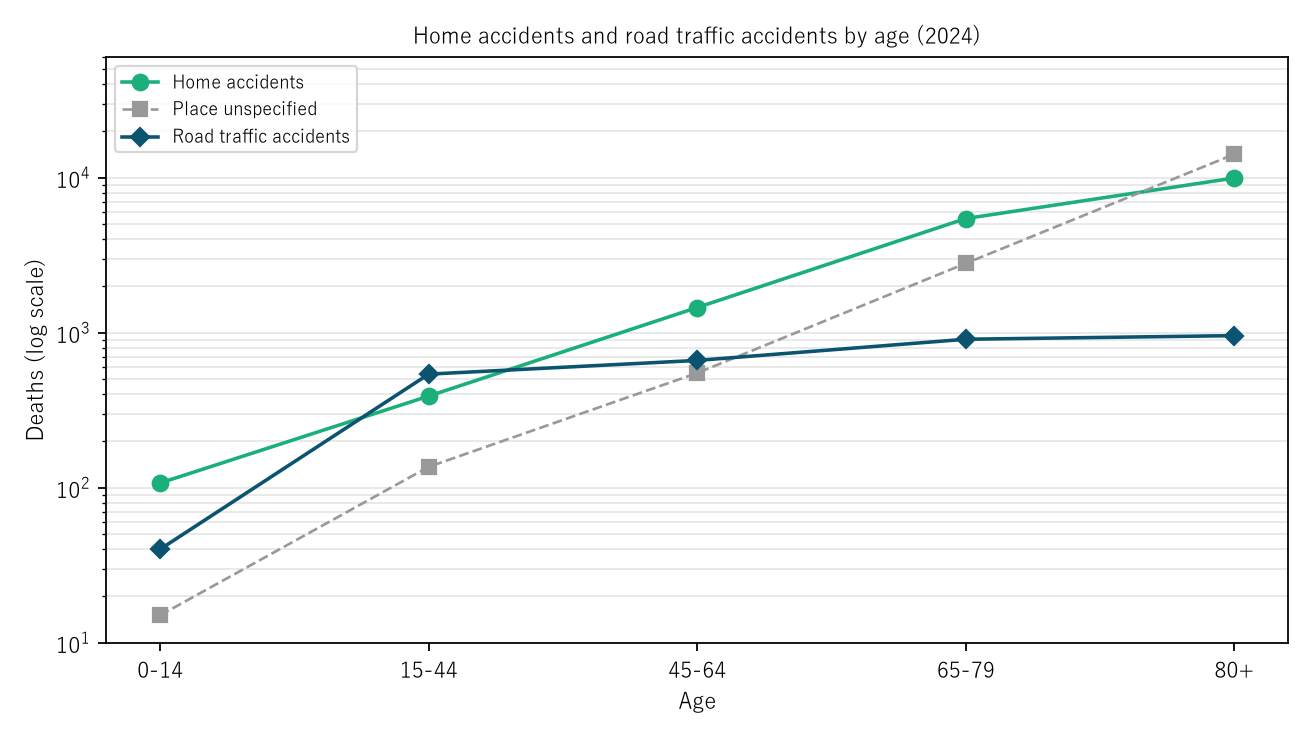
Figure 2: Deaths in 2024 by the five age groups (log scale). Green is home accidents, gray dashed is accidents with an unspecified place, and navy is road traffic accidents. The groups are of unequal width.
7. What home accidents consist of
Calculation 7.1 Causes of home-accident deaths (Table 5.35, 2024)
| Group | Deaths | Share of home accidents | Share under 65 |
|---|---|---|---|
| Accidental drowning | 7,775 | 0.449 | 0.052 |
| Other accidental suffocation | 3,285 | 0.190 | 0.131 |
| Falls | 2,700 | 0.156 | 0.114 |
| Smoke, fire, and flames | 778 | 0.045 | 0.195 |
| Accidental poisoning | 332 | 0.019 | 0.768 |
| All home accidents | 17,320 | 1 | 0.112 |
Observation 7.2: The leading cause of home-accident deaths is accidental drowning, of which drowning in a bathtub is 7,166 (0.414 of home accidents), and 0.948 of those (6,792) are aged 65+. Of all bathtub drownings (W65, W66), 7,776, 0.925 occurred at home. By contrast, of all 11,935 falls only 0.226 were recorded at home, and of other accidental suffocation 0.401.
Observation 7.3: Among home-accident groups, the share under 65 is largest for accidental poisoning (0.768). Of the 332, 136 were aged 45–64, 59 aged 15–29, and 60 aged 30–44, while those aged 65+ total 77. This is the opposite age pattern to home accidents as a whole (0.112 under 65).
8. Limitations
- The place of occurrence is the place written on the death record, and what "unspecified place" contains is unknown. Home accidents are only those recorded as such.
- The place and age tables are for 2024 only, and the yearly movement of home accidents is not treated; the yearly series was by type.
- The age groups are of unequal width, so comparisons between groups are of death counts. Rates per population are not treated.
- Road traffic deaths are Vital Statistics numbers, different from the police numbers (M066). It does not go into accident prevention. Prefectures are not compared. It is not an outlook for any one person.
Conclusion
The largest type of unintentional injury changed from transport accidents in 1995 to falls in 2024, and drowning in a bathtub has exceeded transport accidents since 2016. In 2024, unintentional-injury deaths recorded as occurring at home were 17,320, 5.59 times road traffic deaths (3,100), but deaths with an unspecified place were 17,625. Home accidents were fewer than road traffic deaths only at 15–44 (389 vs 539), and 10.39 times at 80+. Of home-accident deaths, 0.414 were drowning in a bathtub.
Three things separate them — where the death was recorded as occurring, age, and the type of accident.
On hearing "accidents at home outnumber traffic accidents," check together which ages are meant, how deaths with no recorded place were counted, and which type of accident it is.
Data and reproduction
| Data | Vital Statistics 2024 (final figures), Volume 1 Tables 5.30, 5.34, and 5.35, and Stored Table, Deaths, Table 11 (Ministry of Health, Labour and Welfare; e-Stat) (retrieved 26 September 2026) |
| Terms of use | e-Stat follows the Government Standard Terms of Use (Version 2.0). The ratios in this paper were created by processing it and are not figures produced by the government |
| Scope | Japan, 1995–2024 (place and age for 2024) |
| Checker | 検算/M068.py (--zu also draws the figures). Every number in the text is taken from 検算/M068_output.txt |
| Raw data | The retrieved files and SOURCES.md in data/ (URL, retrieval date, SHA-256, terms of use, definitions and how calculations are set up) |
| Figures | 図/M068_zu1, 図/M068_zu2 (png, svg, English versions) |
References
- Ministry of Health, Labour and Welfare. Vital Statistics 2024 (final figures), Volume 1 Tables 5.30, 5.34, and 5.35, and Stored Table, Deaths, Table 11 (in Japanese). e-Stat (accessed 26 September 2026). https://www.e-stat.go.jp/
- Yamagishi, Y. (2026). Road Traffic Deaths in 2024 Were 2,663 by the Police 24-Hour Count, 3,221 by the Police 30-Day Count, and 3,100 by Vital Statistics — Vital Statistics Exceeds the 30-Day Count Only at 80+ (955 vs 945), and the Ratio to 24-Hour Deaths Is Largest at 80+, at 1.303 [M066]. Zenodo. https://doi.org/10.5281/zenodo.22977686
Reference
Yamagishi, Y. (2026). In 2024, Unintentional-Injury Deaths Recorded as Occurring at Home Were 17,320, 5.59 Times Road Traffic Deaths (3,100), but 17,625 Had an Unspecified Place [M068]. Zenodo.
DOI: 10.5281/zenodo.22977842
YOI: https://www.yamagishiyuuki.com/yoi/M068
ORCID: 0009-0006-8587-3450
PDF (English) · PDF (Japanese) · Date proof of the English PDF (OpenTimestamps .ots) · SHA256SUMS
The record page for this paper (in Japanese, with the PDFs in each language and the date proof): YOI M068. This paper is a preprint and has not been peer reviewed.