Abstract
Using the National Police Agency's deaths and deaths per 100,000 population by age group and type of road user (2015–2025; deaths within 24 hours), the fall in road traffic deaths by age and type of road user was divided into an age-composition part and an age-specific-rate part and lined up. It claims no new mathematical theorem and no new law.
First, the tables are consistent. In every year, the total = the sum of seven road-user types, the grand total = the sum of 18 age groups, and 65+ = the sum of the five groups from 65, and the grand total equals the 24-hour deaths used in M066 (4,117 in 2015 and 2,547 in 2025). In cells with 50 or more deaths, the population back-calculated from a road-user row and from the total row agree to within a relative 0.0078 (Section 3).
Second, 24-hour deaths fell from 4,117 in 2015 to 2,547 in 2025 (0.619-fold). Among road-user types, the ratio is smallest for cyclists (0.535) and largest for motorcyclists (0.765). Of the 1,570 fewer deaths, pedestrians account for 644 (0.410) and car occupants for 453 (0.289) (Section 4).
Third, of the 26 cells of six age groups × five road-user types with 10 or more deaths in both years, only two had more deaths in 2025: motorcyclists aged 15–24 (94 → 95) and motorcyclists aged 65–74. The share of motorcycle deaths aged 15–24 went from 0.210 to 0.278 (Section 5).
Fourth, this is the core of the paper. The overall 0.619-fold divides into 1.077-fold when the rates are kept at 2015 and only the age composition moves to 2025, and 0.583-fold when the population is kept at 2015 and only the age-specific rates move to 2025. The age-composition part is largest for pedestrians (1.130); the rate part is smallest for cyclists (0.493) and pedestrians (0.520) and largest for motorcyclists (0.790). Only for motorcyclists is the age-composition part also below 1 (0.963) (Section 6).
Fifth, the pedestrian death rate at 65+ fell in every age group, but the ratio at 85+ (0.614) is closest to 1. Pedestrian deaths at 85+ went from 239 to 207, falling less than in the other groups (Section 7).
Sixth, what separates them is the age composition of the population, the age-specific rates, or the type of road user. The fall in deaths is the result of falling rates outweighing the push from the age composition, and the balance differs by type of road user.
Scope note: This paper claims no new mathematical theorem and no new law — the deaths and rates are in public tables, and the method of dividing into age composition and rates is long established. This paper applied it to each type of road user and lined up the results. This paper is a structural interpretation of the shape of numbers in public aggregate data; it is not medical advice, not a diagnosis, and not a treatment recommendation. The author is not a physician. Decisions about individual health should be discussed with a physician or a medical institution. This is a preprint that has not been peer reviewed. It does not go into how to prevent accidents, whether driving or travel is good or bad, or the evaluation of traffic policy. Why the rates fell (vehicles, roads, medical care, changes in the amount of travel, and so on) cannot be separated with these tables. The rates are per population, not per amount of travel (distance or time). It does not blame those involved in accidents or those who lost family members in them. Prefectures are not compared. It is not written as an outlook for any one person. About the data: the Road Traffic Statistics (National Police Agency; e-Stat) are used under the Government Standard Terms of Use (Version 2.0), and the ratios in this paper were created by processing them. What this paper adds: dividing the fall in road traffic deaths into an age-composition part and a rate part for each type of road user, and showing that overall the rates fell to 0.583 while the age composition pushed deaths up 1.077-fold, that the age-composition push is largest for pedestrians, and that the rate fall is smallest for motorcyclists.
1. Notation and question
- Deaths: deaths within 24 hours (persons who died within 24 hours of a traffic accident; M066).
- Five road-user types: car occupants, motorcyclists, moped riders (general plus specified small mopeds), cyclists, and pedestrians. "Other" has small numbers, so it is left out of comparisons by type but included in totals.
- Rate: deaths per 100,000 population (Table 2-3-1, 2 decimals).
- Age-composition part, rate part: for each type, over 18 age groups, the deaths with rates kept at 2015 and only the population moved to 2025, and the deaths with the population kept at 2015 and only the rates moved to 2025, each divided by the 2015 deaths. The population is not brought in from outside; for each age group it is back-calculated as total deaths ÷ total rate × 100,000.
- Six age groups: 0–14, 15–24, 25–44, 45–64, 65–74, and 75+.
Question: In which ages and types of road user did road traffic deaths fall? Did population aging push the number of deaths up?
Observation 1.1: M001 showed that "the death rate rose" names two movements at once, the age composition and the age-specific rates. M066 showed that road traffic deaths have three ways of counting, and that their differences are not the same across ages. This paper divides the fall in one of them, 24-hour deaths, into age composition, rates, and type of road user.
2. Survey and design
To be honest: the design was decided after seeing the tables.
| Content | |
|---|---|
| Tables | Road Traffic Statistics, "fatal road traffic accidents and traffic law enforcement," Table 2-3-2 (deaths by age group and road-user type) and Table 2-3-1 (the same per 100,000 population) |
| Noticed in the survey | The grand total was the same number as the 24-hour deaths in M066. There is no population table, but the population ratio can be back-calculated from deaths and rates, and the road-user rows and the total rows gave matching results |
| Years compared | 2015 and 2025, the first and last years in the tables |
| Measures | The ratio and the fall by type, the ratio in cells of age group × type (only cells with 10 or more in both years), and the age-composition and rate parts |
3. Data and checks
Calculation 3.1 The 2 retrieved files were fixed by SHA-256, and the following was checked.
- The titles of the two tables, the years (the 11 years 2015–2025), the 18 age groups plus total and 65+, and the seven types plus total.
- Table 2-3-2: in every age group and year, total = the sum of seven types. In every type and year, grand total = the sum of 18 age groups, and 65+ = the sum of the five groups from 65–69. The grand total is 4,117 in 2015 and 2,547 in 2025, the same as the 24-hour deaths in M066.
- Back-calculating the population: in the 43 cells with 50 or more deaths, the relative difference between the population back-calculated from the type row and from the total row is at most 0.0078 (the rounding of the rates). The 2015 deaths recovered as rate × population match the table's deaths to within a relative 0.0047.
4. Deaths by type of road user
Calculation 4.1 24-hour deaths by type (all ages)
| Type | 2015 | 2025 | Ratio | Fall | Share of total fall |
|---|---|---|---|---|---|
| Car occupants | 1,322 | 869 | 0.657 | 453 | 0.289 |
| Motorcyclists | 447 | 342 | 0.765 | 105 | 0.067 |
| Moped riders | 230 | 135 | 0.587 | 95 | 0.061 |
| Cyclists | 572 | 306 | 0.535 | 266 | 0.169 |
| Pedestrians | 1,534 | 890 | 0.580 | 644 | 0.410 |
| Total | 4,117 | 2,547 | 0.619 | 1,570 | 1 |
Observation 4.2: Of the 1,570 fewer deaths, pedestrians account for 644 (0.410) and car occupants for 453 (0.289). The ratio is smallest for cyclists (0.535) and largest for motorcyclists (0.765). The overall rate (per 100,000) went from 3.24 to 2.06.
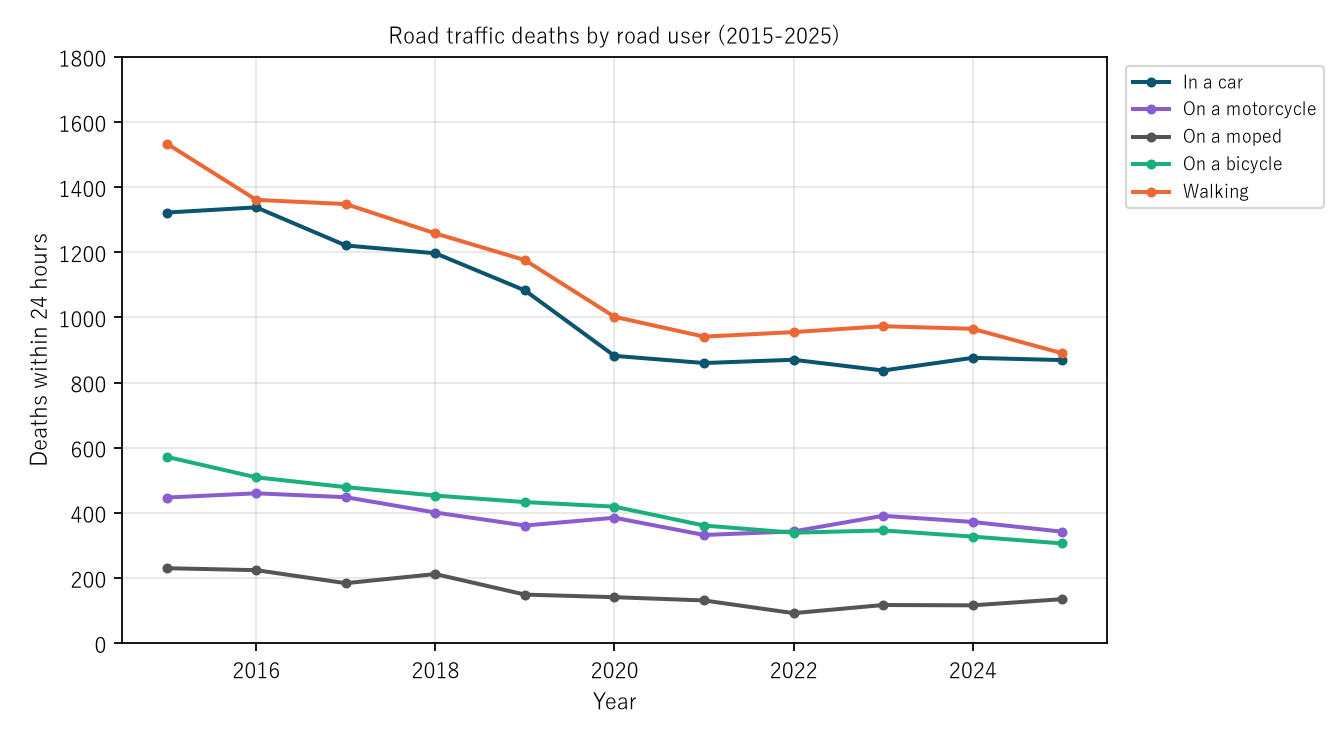
Figure 1: 24-hour deaths by type of road user, 2015–2025. Navy is car occupants, purple motorcyclists, gray moped riders, green cyclists, and orange pedestrians.
5. Age group × type — only motorcycles have cells that did not fall
Calculation 5.1 Ratio by six age groups × five types (2025 ÷ 2015; only cells with 10 or more in both years)
| Age | Car | Motorcycle | Moped | Bicycle | Pedestrian |
|---|---|---|---|---|---|
| 0–14 | – | – | – | – | 0.314 |
| 15–24 | 0.412 | 1.011 | 0.731 | 0.333 | 0.561 |
| 25–44 | 0.541 | 0.457 | 0.645 | 0.604 | 0.659 |
| 45–64 | 0.654 | 0.801 | 0.660 | 0.565 | 0.575 |
| 65–74 | 0.676 | 1.714 | 0.411 | 0.348 | 0.450 |
| 75+ | 0.814 | 0.812 | 0.606 | 0.642 | 0.632 |
(– marks cells with fewer than 10 in either year.)
Observation 5.2: Of the 26 cells with 10 or more in both years, only two had more deaths in 2025: motorcyclists aged 15–24 (94 → 95) and motorcyclists aged 65–74 (21 → 36). Motorcycle deaths at 15–24 moved up and down within 72–110 over the 11 years and were 95 in 2025. The share of motorcycle deaths aged 15–24 went from 0.210 in 2015 to 0.278 in 2025.
6. Core — the age composition pushed up, the rates pulled down
Calculation 6.1 Age-composition and rate parts by type (18 age groups, 2015 to 2025)
| Type | Actual ratio | Age composition only | Rates only | Product |
|---|---|---|---|---|
| Car occupants | 0.657 | 1.055 | 0.628 | 0.662 |
| Motorcyclists | 0.765 | 0.963 | 0.790 | 0.761 |
| Moped riders | 0.587 | 1.043 | 0.580 | 0.605 |
| Cyclists | 0.535 | 1.091 | 0.493 | 0.538 |
| Pedestrians | 0.580 | 1.130 | 0.520 | 0.588 |
| All | 0.619 | 1.077 | 0.583 | 0.628 |
Observation 6.2: The overall 0.619-fold divides into an age-composition part of 1.077 and a rate part of 0.583. Had only the age composition changed to 2025, deaths would have risen. The relative difference between the product and the actual ratio is within 0.031 for every type.
Observation 6.3: The age-composition part is largest for pedestrians (1.130); pedestrian deaths fell with a rate part of 0.520 while being pushed up by the age composition. The rate part is smallest for cyclists (0.493) and largest for motorcyclists (0.790). To be honest: I expected the age-composition part to exceed 1 for all five types, but for motorcyclists it was 0.963, below 1. Which combination of age groups makes it so is not laid out in this paper.
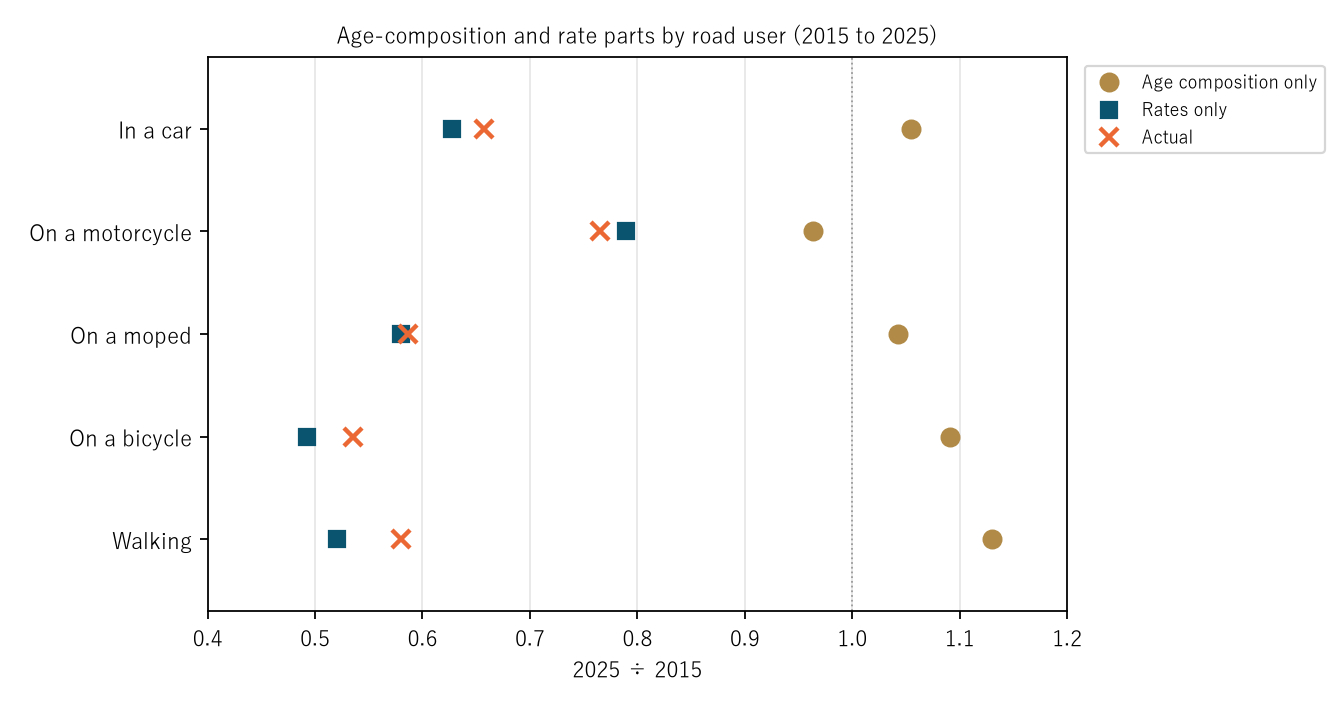
Figure 2: For each type, the ratio from age composition only (gold circle), from rates only (navy square), and the actual ratio (orange ×). The dotted line is 1 (no change).
7. Pedestrians at 65+ — the rate fell least at 85+
Calculation 7.1 Pedestrian death rates (per 100,000) and deaths at 65+
| Age group | Rate 2015 | Rate 2025 | Rate ratio | Deaths 2015 | Deaths 2025 |
|---|---|---|---|---|---|
| 65–69 | 1.32 | 0.63 | 0.477 | 121 | 46 |
| 70–74 | 2.26 | 1.09 | 0.482 | 179 | 89 |
| 75–79 | 3.89 | 1.55 | 0.398 | 244 | 122 |
| 80–84 | 5.90 | 2.57 | 0.436 | 287 | 158 |
| 85+ | 5.00 | 3.07 | 0.614 | 239 | 207 |
Observation 7.2: The pedestrian death rate at 65+ fell in every group, but the ratio at 85+ (0.614) is closest to 1. The population ratio at 85+ (back-calculated) is 1.413, the largest of the 18 age groups. So pedestrian deaths at 85+ went from 239 to 207, falling less than in the other groups.
8. Limitations
- The deaths are 24-hour deaths, not 30-day deaths or Vital Statistics numbers (M066). A different way of counting would give a slightly different age pattern.
- The rates are per population, not per amount of travel. Why the rates fell (vehicles, roads, medical care, changes in the amount of travel, and so on) cannot be separated with these tables.
- The population was back-calculated from deaths and rates (2 decimals), so rounding error enters (within a relative 0.0078 in cells with 50 or more deaths). In age groups with few deaths, the back-calculation error can be larger.
- This compares two years, 2015 and 2025, and does not treat the ups and downs in between (except for motorcyclists at 15–24). It does not go into accident prevention or policy evaluation. Prefectures are not compared. It is not an outlook for any one person.
Conclusion
Road traffic deaths within 24 hours went from 4,117 in 2015 to 2,547 in 2025, 0.619 times. The fall was the result of the age-specific rates falling to 0.583 while the population's age composition pushed deaths up 1.077-fold. The age-composition push was largest for pedestrians (1.130), the rate fall was large for cyclists (0.493) and pedestrians (0.520), and small for motorcyclists (0.790). Motorcycle deaths at 15–24 did not fall, from 94 to 95.
Three things separate them — the age composition of the population, the age-specific rates, or the type of road user.
On hearing "road traffic deaths fell," check together how much they fell while the number of older people grew, how the age-specific rates moved, and for which type of road user they fell.
Data and reproduction
| Data | Road Traffic Statistics, "fatal road traffic accidents and traffic law enforcement," Tables 2-3-2 and 2-3-1 (National Police Agency; e-Stat) (retrieved 26 September 2026) |
| Terms of use | e-Stat follows the Government Standard Terms of Use (Version 2.0). The ratios in this paper were created by processing it and are not figures produced by the government |
| Scope | Japan, 2015–2025 |
| Checker | 検算/M067.py (--zu also draws the figures). Every number in the text is taken from 検算/M067_output.txt |
| Raw data | The retrieved files and SOURCES.md in data/ (URL, retrieval date, SHA-256, terms of use, definitions and how calculations are set up) |
| Figures | 図/M067_zu1, 図/M067_zu2 (png, svg, English versions) |
References
- National Police Agency. Road Traffic Statistics, fatal road traffic accidents and traffic law enforcement, Tables 2-3-2 and 2-3-1 (in Japanese). e-Stat (accessed 26 September 2026). https://www.e-stat.go.jp/
- Yamagishi, Y. (2026). "The Death Rate Rose" Names Two Movements at Once, the Age Composition and the Age-Specific Rates [M001]. Zenodo. https://doi.org/10.5281/zenodo.22963112
- Yamagishi, Y. (2026). Road Traffic Deaths in 2024 Were 2,663 by the Police 24-Hour Count, 3,221 by the Police 30-Day Count, and 3,100 by Vital Statistics — Vital Statistics Exceeds the 30-Day Count Only at 80+ (955 vs 945), and the Ratio to 24-Hour Deaths Is Largest at 80+, at 1.303 [M066]. Zenodo. https://doi.org/10.5281/zenodo.22977686
Reference
Yamagishi, Y. (2026). Road Traffic Deaths Within 24 Hours Fell to 0.619 Times from 2015 to 2025, Though the Age Composition Alone Would Have Raised Them 1.077-Fold [M067]. Zenodo.
DOI: 10.5281/zenodo.22977762
YOI: https://www.yamagishiyuuki.com/yoi/M067
ORCID: 0009-0006-8587-3450
PDF (English) · PDF (Japanese) · Date proof of the English PDF (OpenTimestamps .ots) · SHA256SUMS
The record page for this paper (in Japanese, with the PDFs in each language and the date proof): YOI M067. This paper is a preprint and has not been peer reviewed.