Abstract
Using the Fire and Disaster Management Agency's fire reports (2024, and the 2015–2024 series) and Vital Statistics' "exposure to smoke, fire and flames" (2024 three-character, monthly, and yearly tables), two ways of counting fire deaths were lined up. It claims no new mathematical theorem and no new law.
First, the tables are consistent. The fire reports' 1,451 deaths match the sum by fire type and the sum over 12 months, and in the monthly table of residential fire deaths every year's 12 months sum to its total. The 2024 Vital Statistics X00-X09 count, 982, is the same in the monthly, age, and yearly tables. The fire reports note that deaths "include those who died within 48 hours after being injured" (Section 3).
Second, fire report deaths in 2024 were 1,451, 1.478 times Vital Statistics X00-X09 (accidental), 982. Widening Vital Statistics to X76 (intentional self-harm) 159, X97 (assault) 6, and Y26 (undetermined intent) 388 gives 1,535, of which the fire reports are 0.945 (Section 4).
Third, this is the core of the paper. From 2015 to 2024, residential fire deaths in the fire reports went from 1,020 to 1,109 (1.087-fold) and Vital Statistics X00 (uncontrolled fire in a building) from 753 to 643 (0.854-fold), so residential fire deaths ÷ X00 drifted from 1.355 to 1.725. Excluding arson suicides and the like, residential fire deaths went from 914 to 1,030 (1.127-fold), and the ratio to X00 from 1.214 to 1.602 (Section 5).
Fourth, for all fires too, the fire reports moved 0.928-fold from 2015 to 2024 (index 100 → 92.8) while Vital Statistics X00-X09 moved 1.044-fold, in opposite directions (Section 5).
Fifth, the 2024 monthly shapes of fire report deaths and Vital Statistics' exposure to smoke, fire and flames agree with a correlation of 0.987; the December–February shares are 0.420 and 0.435, and the daily maximum ÷ minimum 3.85 and 3.89 (Section 6).
Sixth, what separates them is the time limit to death and under which cause a person who died in a fire is counted. The two counts agree in some respects, like the monthly shape, and drift apart in others, like the yearly ratio; what makes up the difference cannot be separated with these tables.
Scope note: This paper claims no new mathematical theorem and no new law — the death counts are in public tables, and this paper only lined them up and computed ratios. This paper is a structural interpretation of the shape of numbers in public aggregate data; it is not medical advice, not a diagnosis, and not a treatment recommendation. The author is not a physician. Decisions about individual health should be discussed with a physician or a medical institution. This is a preprint that has not been peer reviewed. It does not go into how to prevent fires, whether residential fire safety equipment is good or bad, or the evaluation of fire service activities. It includes counts related to suicide (X76, arson suicides and the like) as aggregate numbers, but does not touch on methods or circumstances. The fire reports and the Vital Statistics are counted by different people under different rules, and what makes up the difference (time limit, how the cause of death is determined, the scope of residences versus buildings, and so on) cannot be separated with these tables. For some years the fire reports' yearly total appears only as an index, and those years were compared by index. It does not blame those who lost family members. Prefectures are not compared. It is not written as an outlook for any one person. About the data: the Fire Statistics (Fire and Disaster Management Agency) and the Vital Statistics (Ministry of Health, Labour and Welfare) were taken from e-Stat and used under the Government Standard Terms of Use (Version 2.0), and the ratios in this paper were created by processing them. What this paper adds: lining up two ways of counting fire deaths, and showing that their monthly shapes agree while their yearly ratio drifts apart, and that widening Vital Statistics to all intents exceeds the fire reports' count.
1. Notation and question
- Fire report deaths: deaths in the Fire and Disaster Management Agency's fire reports. Note 1 to Table 1: "Deaths include those who died within 48 hours after being injured in a fire."
- Residential fire deaths: Table 45 of the fire reports. Excluding arson suicides and the like: Table 46.
- Vital Statistics fire deaths: underlying cause X00-X09, "exposure to smoke, fire and flames" (accidental). X00 is "exposure to uncontrolled fire in building or structure." When widening to all intents, X76, X97, and Y26 are added.
- Daily: monthly deaths ÷ days in the month (in 2024, February has 29 days).
Question: How much do "people who died in fires" differ depending on which number is used, and does the difference move by year or month?
Observation 1.1: M066 showed that road traffic deaths have three ways of counting whose differences are not the same across ages. M069 lined up monthly shapes by daily deaths. This paper lines up two ways of counting fire deaths with the same measures.
2. Survey and design
To be honest: the design was decided after seeing the tables.
| Content | |
|---|---|
| Tables | Fire reports 2024 (overview Tables 1, 2, 13, 45, 46; statistical Table 1-7), Vital Statistics 2024 Volume 1 Table 5.30 and Volume 2 Tables 1-1 and 3 |
| Noticed in the survey | The fire reports' deaths carry a "48 hours" note, and there is a residential table excluding arson suicides and the like. Vital Statistics splits fire deaths into accidental (X00-X09), suicide (X76), assault (X97), and undetermined (Y26) |
| Pairs compared | For 2024, all fire deaths and X00-X09. For years, residential fire deaths and X00 (not one-to-one in scope). For months, all fire deaths and condensed code 20105 |
| Measures | Ratios, yearly factors, correlation of monthly counts, daily max ÷ min |
3. Data and checks
Calculation 3.1 The 5 retrieved files were fixed by SHA-256, and the following was checked.
- The title of fire report Table 1 and its note on deaths. The death index in Table 2 covers 2015–2024, and its 2024 ÷ 2023 ratio matches that of Table 1's deaths.
- Table 13: total 1,451 = buildings 1,199 + forests 8 + vehicles 74 + ships 2 + aircraft 0 + other 168, and buildings = the sum of 5 damage levels.
- Tables 45 and 46: in every year 2015–2024, 12 months sum to the total, and Table 46's total is smaller than Table 45's. The 12 monthly deaths in statistical Table 1-7 sum to 1,451.
- Vital Statistics: 20105 in Table 3 = (X00-X09) in Table 1-1 = the 2024 value in Table 5.30 (982), and (X00-X09) = the sum of 9 three-character items.
4. The two numbers in 2024
Calculation 4.1 Fire deaths in 2024
| Way of counting | Deaths | Fire report deaths ÷ this |
|---|---|---|
| Fire report deaths (all fires) | 1,451 | 1 |
| Vital Statistics X00-X09 (accidental) | 982 | 1.478 |
| Vital Statistics X76 (intentional self-harm) | 159 | – |
| Vital Statistics X97 (assault) | 6 | – |
| Vital Statistics Y26 (undetermined intent) | 388 | – |
| Vital Statistics, all intents | 1,535 | 0.945 |
Observation 4.2: Fire report deaths are 1.478 times Vital Statistics X00-X09 and 0.945 times Vital Statistics widened to all intents (1,535). Vital Statistics counts fire deaths separately as accidental, suicide, assault, and undetermined, with 388 undetermined (Y26). Of the fire reports' 1,109 residential fire deaths, 1,030 remain after excluding arson suicides and the like (a difference of 79).
5. Core — over the years, the two numbers drift apart
Calculation 5.1 Residential fire deaths (fire reports) and Vital Statistics X00
| Year | Residential fire deaths | Excluding arson suicides etc. | Vital Statistics X00 | Residential ÷ X00 | Excluding ÷ X00 |
|---|---|---|---|---|---|
| 2015 | 1,020 | 914 | 753 | 1.355 | 1.214 |
| 2017 | 985 | 889 | 698 | 1.411 | 1.274 |
| 2019 | 1,000 | 899 | 684 | 1.462 | 1.314 |
| 2021 | 1,058 | 966 | 637 | 1.661 | 1.516 |
| 2023 | 1,127 | 1,023 | 665 | 1.695 | 1.538 |
| 2024 | 1,109 | 1,030 | 643 | 1.725 | 1.602 |
Observation 5.2: From 2015 to 2024, residential fire deaths rose 1.087-fold and those excluding arson suicides and the like 1.127-fold, while Vital Statistics X00 moved 0.854-fold. Residential ÷ X00 widened from 1.355 to 1.725, and excluding ÷ X00 from 1.214 to 1.602. The drift has the same direction even after excluding arson suicides, so it is not explained by the suicide counts alone.
Observation 5.3: For all fires too, the fire reports moved 0.928-fold from 2015 to 2024 (index 100 → 92.8) while Vital Statistics X00-X09 went from 941 to 982 (1.044-fold), in opposite directions. The 2015 fire report deaths recovered from the index are 1,563, and fire reports ÷ X00-X09 narrowed from 1.661 in 2015 to 1.478 in 2024. Seen for residences the gap widens; seen for all fires it narrows — even the direction of the drift changes with the scope compared.
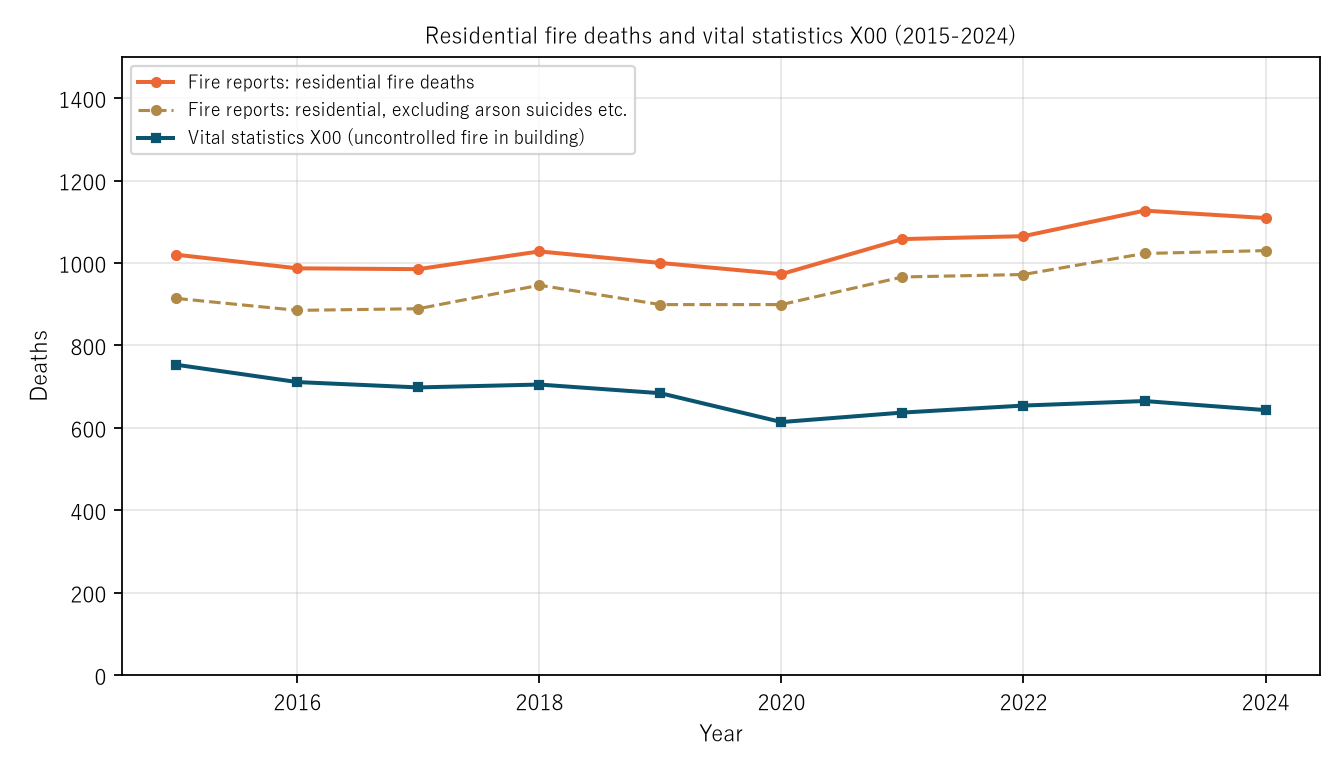
Figure 1: Residential fire deaths (fire reports, orange), residential fire deaths excluding arson suicides and the like (gold dashed), and Vital Statistics X00 (uncontrolled fire in a building, navy), 2015–2024.
6. The monthly shapes agree
Calculation 6.1 Deaths by month, 2024
| Measure | Fire report deaths (all fires) | Vital Statistics exposure to smoke, fire and flames |
|---|---|---|
| January | 215 | 147 |
| July | 65 | 38 |
| December | 210 | 148 |
| Daily maximum | January 6.94 | December 4.77 |
| Daily minimum | September 1.80 | July 1.23 |
| Max ÷ min | 3.85 | 3.89 |
| December–February share | 0.420 | 0.435 |
Observation 6.2: The correlation of the two monthly series is 0.987, and the December–February shares (0.420, 0.435) and max ÷ min (3.85, 3.89) nearly agree. Monthly fire reports ÷ Vital Statistics ranges from 1.23 in September to 1.81 in November. The sizes differ, but the seasonal shape is the same under both ways of counting.
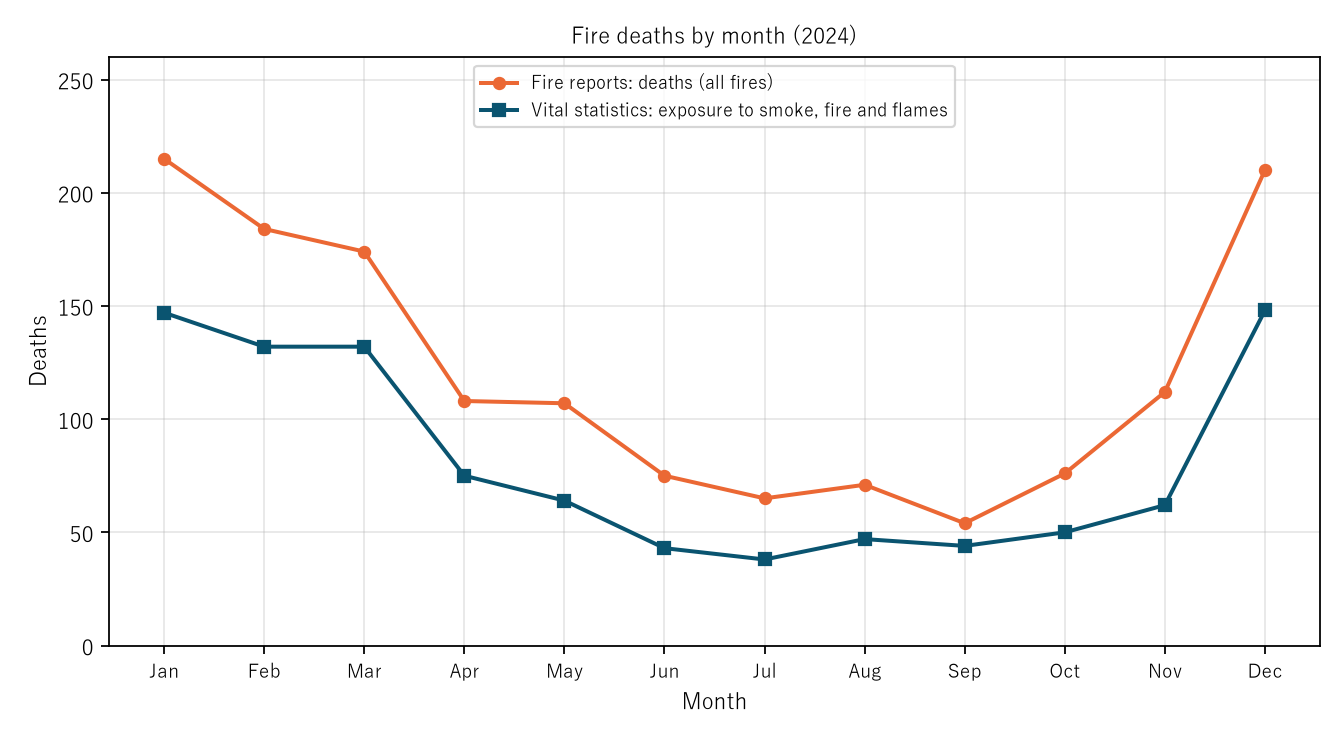
Figure 2: Fire deaths by month, 2024. Orange is fire report deaths (all fires), navy Vital Statistics' exposure to smoke, fire and flames (condensed code 20105).
7. Limitations
- The fire reports and the Vital Statistics are counted by different people under different rules. Which of the time limit (the 48-hour note), how the cause of death is determined, or the scope of residences versus buildings makes the difference cannot be separated with these tables.
- The yearly comparison is between residential fire deaths (residences only) and X00 (which also includes non-residential buildings), not one-to-one in scope. The all-fire yearly series was compared only by index.
- The Vital Statistics split by intent (X76, X97, Y26) was examined for 2024 only. Suicide-related counts are only lined up as aggregate numbers, without touching on methods or circumstances.
- In Vital Statistics X00-X09, 0.815 are at 65+, but the age of fire report deaths was not examined here. It does not go into fire prevention. Prefectures are not compared. It is not an outlook for any one person.
Conclusion
Fire deaths in 2024 were 1,451 in the fire reports and 982 in Vital Statistics' exposure to smoke, fire and flames (accidental). Widening Vital Statistics to suicide, assault, and undetermined intent gave 1,535. The monthly shapes of the two counts agreed with a correlation of 0.987, but from 2015 to 2024 residential fire deaths rose 1.087-fold while Vital Statistics X00 moved 0.854-fold, and their ratio drifted from 1.355 to 1.725.
Two things separate them — the time limit to death and under which cause a person who died in a fire is counted.
On hearing "so many people died in fires," check together whether it is the fire service's number or Vital Statistics', how far fire deaths were counted, and whether it covers residences only or all buildings.
Data and reproduction
| Data | Fire reports 2024 (overview and statistical tables) (Fire and Disaster Management Agency; e-Stat), Vital Statistics 2024 (final figures) Volume 1 Table 5.30 and Volume 2 Tables 1-1 and 3 (Ministry of Health, Labour and Welfare; e-Stat) (retrieved 26 September 2026) |
| Terms of use | e-Stat follows the Government Standard Terms of Use (Version 2.0). The ratios in this paper were created by processing them and are not figures produced by the government |
| Scope | Japan, 2015–2024 |
| Checker | 検算/M074.py (--zu also draws the figures). Every number in the text is taken from 検算/M074_output.txt |
| Raw data | The retrieved files and SOURCES.md in data/ (URL, retrieval date, SHA-256, terms of use, definitions and how calculations are set up) |
| Figures | 図/M074_zu1, 図/M074_zu2 (png, svg, English versions) |
References
- Fire and Disaster Management Agency. Fire reports 2024 (overview) Tables 1, 2, 13, 45, and 46, and (statistical tables) Table 1-7 (in Japanese). e-Stat (accessed 26 September 2026). https://www.e-stat.go.jp/
- Ministry of Health, Labour and Welfare. Vital Statistics 2024 (final figures), Volume 1 Table 5.30, and Volume 2 Tables 1 and 3 (in Japanese). e-Stat (accessed 26 September 2026). https://www.e-stat.go.jp/
- Yamagishi, Y. (2026). Road Traffic Deaths in 2024 Were 2,663 by the Police 24-Hour Count, 3,221 by the Police 30-Day Count, and 3,100 by Vital Statistics — Vital Statistics Exceeds the 30-Day Count Only at 80+ (955 vs 945), and the Ratio to 24-Hour Deaths Is Largest at 80+, at 1.303 [M066]. Zenodo. https://doi.org/10.5281/zenodo.22977686
- Yamagishi, Y. (2026). Of 7,776 Bathtub Drownings in 2024, at Least 0.592 Fell in November–March and at Most 0.173 in June–September — Daily Drowning Deaths in December Were 6.53 Times Those in September, and the Bathtub Drowning Rate Peaks at 85–89 (43.05 per 100,000) [M069]. Zenodo. https://doi.org/10.5281/zenodo.22977889
Reference
Yamagishi, Y. (2026). Fire Deaths in 2024 Were 1,451 in the Fire Service's Fire Reports and 982 in Vital Statistics' "Exposure to Smoke, Fire and Flames" (Accidental) [M074]. Zenodo.
DOI: 10.5281/zenodo.22978406
YOI: https://www.yamagishiyuuki.com/yoi/M074
ORCID: 0009-0006-8587-3450
PDF (English) · PDF (Japanese) · Date proof of the English PDF (OpenTimestamps .ots) · SHA256SUMS
The record page for this paper (in Japanese, with the PDFs in each language and the date proof): YOI M074. This paper is a preprint and has not been peer reviewed.