Abstract
Using the Ministry of Health, Labour and Welfare's National Medical Expenditure (tables by sex and age group for FY2023 and FY2022, and the table by year and age group for FY2000–FY2021), this paper looked at how per-capita medical expenditure rises with age, and whether the growth of the total from FY2000 to FY2023 came from the age composition or from per-capita expenditure. No new mathematical theorem and no new law are claimed.
First, the tables are consistent. Age groups sum to the total, medical care equals inpatient plus outpatient, men plus women equal the total, all within rounding, and per-capita values equal expenditure divided by population. The totals for FY2021–FY2023 match Table 1 (Section 3).
Second, this is the core of the paper. In FY2023, per-capita national medical expenditure doubles every 16.52 years at ages 40–84 (coefficient of determination 0.9982). Compared with the doubling time of death rates that M002 measured in the same window (2024, men 6.99 years, women 7.60 years), medical expenditure takes 2.054 times as many years for men and 2.522 times for women. Per-capita expenditure is lowest at 20–24 (106.2 thousand yen); ages 0–4 are 2.739 times that and 90+ are 11.269 times (Section 4).
Third, the shape differs by type. The doubling times are 11.71 years for inpatient care, 19.67 for outpatient care, 20.17 for pharmacy dispensing, and 45.84 for dental care; only inpatient care keeps rising up to 90+, while outpatient and dental care peak at 80–84 and pharmacy dispensing at 85–89 (Section 5).
Fourth, from FY2000 to FY2023 the total went from 301,416 to 480,913 hundred million yen (1.596-fold). Keeping FY2000 per-capita expenditure by age and moving only the age composition to FY2023 gives 1.337-fold; keeping the FY2000 age composition and moving only per-capita expenditure gives 1.274-fold; population size alone gives 0.980-fold. The share of the population aged 65+ went from 0.174 to 0.291 (Section 6).
Fifth, growth in per-capita expenditure by age shrinks with age, from 1.738-fold at 0–14 to 1.051-fold at 70–74 (1.138-fold at 75+). The increase for the oldest groups came mainly from growth in their numbers (75+: 2.228-fold) (Section 6).
Sixth, what separates them is the speed of increase with age (the doubling time) versus where people are in age (the age composition). "Medical costs rise as people age" is about the doubling time, and that speed is less than half that of death rates. "Medical costs have risen" is about both the age composition and per-capita expenditure, and which was larger differs by age group.
Scope note: This paper claims no new mathematical theorem and no new law — expenditure, population, and per-capita values are in public tables, and this paper only lines them up by age shape and by a split of growth. Splitting into age composition and age-specific rates is the same method as M001, and the window for doubling time is the same as M002. This paper is a structural interpretation of the shape of numbers in public aggregate data; it is not medical advice, not a diagnosis, and not a treatment recommendation. The author is not a physician. Decisions about individual health should be discussed with a physician or a medical institution. This is a preprint that has not been peer reviewed. It does not judge whether medical costs are too high or too low, nor evaluate the health care system or fee schedules. It does not blame people of any age for using medical care. What makes up per-capita growth (the content of care, prices, the share of people using care) cannot be separated with these tables. The numbers line up people of different ages in the same fiscal year, not the change for one person as they age. Prefectures are not compared. About the data: National Medical Expenditure (Ministry of Health, Labour and Welfare) was taken from the Ministry's website (statistical tables for FY2023 and FY2022) and from e-Stat (Table 9 of FY2021), used under the Public Data License (Version 1.0) and the Government of Japan Standard Terms of Use (Version 2.0); the ratios, doubling times, and splits in this paper were processed from them. What this paper adds: measuring the doubling time of per-capita medical expenditure in the same window as death rates and showing it is more than twice as long, showing that inpatient, outpatient, dental, and pharmacy dispensing peak at different ages, and splitting the FY2000→FY2023 growth into age composition and per-capita expenditure by age, showing that per-capita growth was larger in younger groups.
1. Notation and question
- Per capita: national medical expenditure ÷ population (thousand yen). National medical expenditure estimates the cost of treating illness and injury eligible for insurance coverage in the fiscal year, and includes meal and living costs during hospitalization, home-visit nursing costs, and medical allowances.
- Doubling time: fit a straight line to log(per capita) at the midpoints (42.5–82.5) of the 9 five-year age groups from 40 to 84, and take ln2 ÷ slope. This is the same window M002 used for death rates.
- Six groups: 0–14, 15–44, 45–64, 65–69, 70–74, 75+, matching the age breaks of the FY2000–FY2021 table.
Question: Does medical expenditure rise with age at the same speed as death rates? Did the growth of the total from FY2000 to FY2023 come from changes in where people are in age, or from changes in per-capita expenditure by age?
Observation 1.1: M001 split a rise in death rates into movement of the age composition and movement of age-specific rates. M002 measured the speed at which adult death rates double with age (40–84). This paper applies the same two tools to medical expenditure instead of deaths.
2. Preview and design
Honestly stated: the design was decided after looking at the tables.
| Content | |
|---|---|
| Tables | National Medical Expenditure FY2023 and FY2022 statistical tables, Table 1, Table 5 (total, men, women), Reference 2 (Excel on the Ministry's website); FY2021 statistical table, Table 9 (e-Stat) |
| Noticed in the preview | For FY2022 and FY2023, the table by year and age group exists on e-Stat only as a database with no file; the Excel on the Ministry's website gave Table 5 in five-year groups and the population (Reference 2). Before FY2000, the scope changes with the start of long-term care insurance |
| Comparison | The FY2023 age shape and doubling times (total, men, women, by type), and the split of FY2000→FY2023 total growth over six groups |
3. Data and checks
Calculation 3.1 The 6 retrieved files were fixed by SHA-256, and the following were checked.
- Table 5 (FY2023, FY2022): the sum of the 19 age groups (0–4 to 90+) = the total (largest difference 2 hundred million yen); medical care = inpatient + outpatient, and men + women = total (both within 1 hundred million yen). Per capita = expenditure ÷ Reference 2 population × 100 matches to one decimal place in thousand yen.
- The total exceeds medical + dental + pharmacy dispensing by 17,909 hundred million yen (FY2023; meal and living costs during hospitalization, home-visit nursing costs, medical allowances, etc.).
- Table 9: columns for 25 fiscal years (1997–2021). Total = under 65 + 65 and over, and under 65 = 0–14 + 15–44 + 45–64, first failed because I assumed exact equality — it is a rounding difference of 1–2 hundred million yen in 13 years, and matches within 2. The FY2021 total, 450,359 hundred million yen, matches Table 1.
- Back-calculating the FY2000 populations of the six groups as expenditure ÷ per capita gives a sum of 126,939 thousand, +13 thousand (+0.00010) from Table 1's total population of 126,926 thousand.
4. The core — the years it takes per-capita medical expenditure to double
Calculation 4.1 Per-capita national medical expenditure, FY2023 (total)
| Age | Per capita (thousand yen) | Expenditure (100 million yen) | Population (thousand) |
|---|---|---|---|
| 0–4 | 290.9 | 11,888 | 4,087 |
| 5–9 | 171 | 8,273 | 4,838 |
| 20–24 | 106.2 | 6,622 | 6,236 |
| 40–44 | 188.7 | 14,653 | 7,765 |
| 60–64 | 425.2 | 31,917 | 7,507 |
| 80–84 | 949.5 | 55,973 | 5,895 |
| 90+ | 1196.8 | 32,672 | 2,730 |
Observation 4.2: Per-capita expenditure is lowest at 20–24 (106.2 thousand yen) and rises in every five-year group above it. Ages 0–4 are 2.739 times 20–24, and 90+ are 11.269 times. The excess of 0–4 over 5–9 is large for inpatient care: inpatient care at 0–4 is 4.894 times that at 5–9, outpatient care 1.561 times. People aged 65+ are 0.291 of the population and 0.601 of expenditure; those aged 75+ are 0.161 of the population and 0.398 of expenditure.
Calculation 4.3 Doubling times at ages 40–84
| Total | Men | Women | |
|---|---|---|---|
| Per-capita national medical expenditure (FY2023) | 16.52 years | 14.36 years | 19.17 years |
| Coefficient of determination | 0.9982 | 0.9948 | 0.9922 |
| Death rate (M002, 2024) | — | 6.99 years | 7.60 years |
| Expenditure ÷ death rate | — | 2.054 | 2.522 |
Observation 4.4: Per-capita medical expenditure also fits an exponential in age well at 40–84 (coefficient of determination 0.99 or more for total, men, and women). Yet it takes 16.52 years to double, more than twice the doubling time of death rates (men 2.054-fold, women 2.522-fold). From 40–44 to 80–84, per capita goes from 188.7 to 949.5 thousand yen (5.032-fold). The doubling time is shorter for men than for women, and this holds for the total and all 6 types.
Observation 4.5: Measured between adjacent five-year groups, the total's doubling time from 20–24 upward is shortest at 55–59→60–64, 15.1 years, and lengthens at the top end: 26.4 years at 80–84→85–89 and 34.7 years at 85–89→90+. A single straight line is the average of this bent curve.
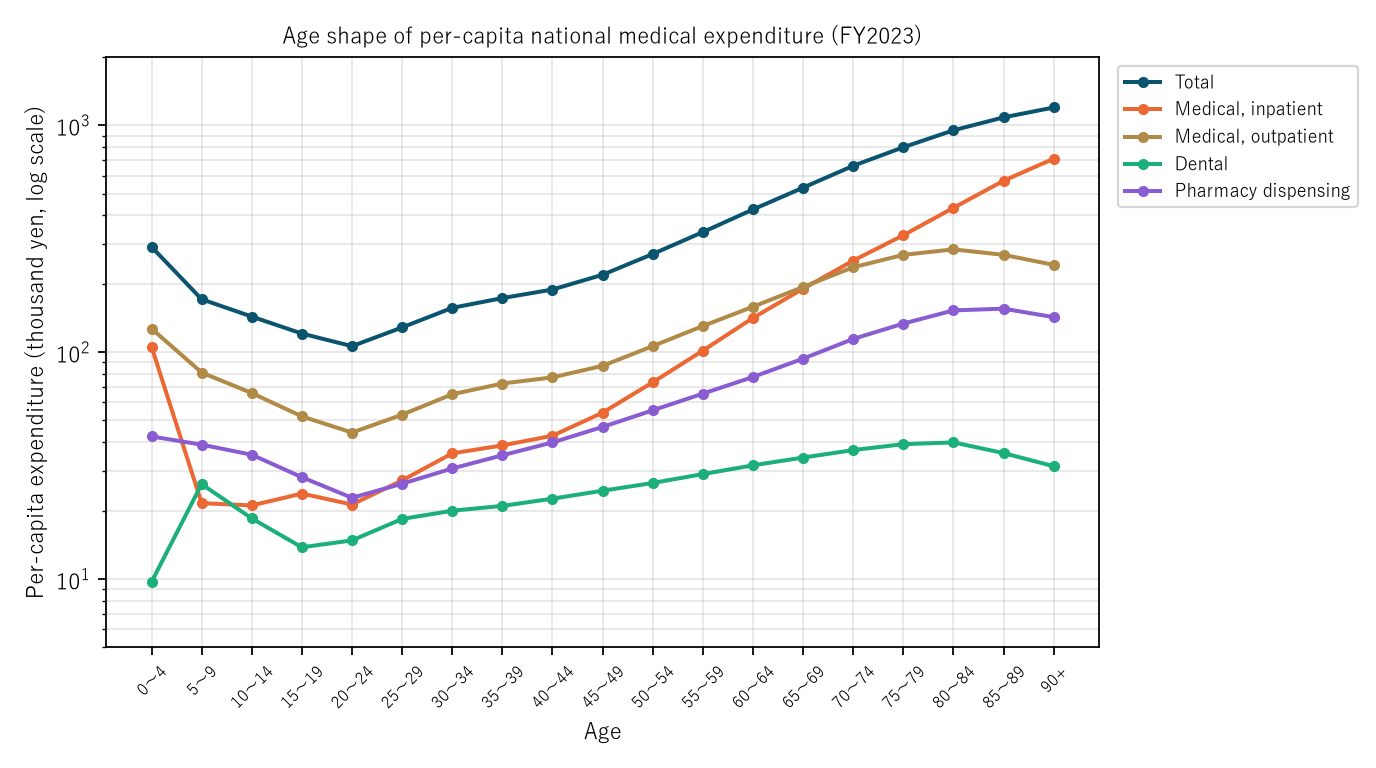
Figure 1: Per-capita national medical expenditure in FY2023 (thousand yen, log scale). Navy is the total, orange medical inpatient, gold medical outpatient, green dental, and purple pharmacy dispensing.
5. The shape differs by type — only inpatient care keeps rising
Calculation 5.1 Shape by type, FY2023 (total)
| Type | Doubling time | Coefficient of determination | Peak age | 90+ ÷ 20–24 | 90+ ÷ peak |
|---|---|---|---|---|---|
| Total | 16.52 | 0.9982 | 90+ | 11.269 | 1.000 |
| Medical | 14.89 | 0.9974 | 90+ | 14.568 | 1.000 |
| Inpatient | 11.71 | 0.9987 | 90+ | 33.427 | 1.000 |
| Outpatient | 19.67 | 0.9887 | 80–84 | 5.482 | 0.854 |
| Pharmacy dispensing | 20.17 | 0.9988 | 85–89 | 6.254 | 0.918 |
| Dental | 45.84 | 0.9870 | 80–84 | 2.122 | 0.785 |
Observation 5.2: The doubling times are ordered inpatient < medical < total < outpatient < pharmacy dispensing < dental, with 11.71 years for inpatient care and 45.84 years for dental care. Per-capita inpatient expenditure keeps rising up to 90+ (712 thousand yen), 33.427 times that at 20–24. Outpatient care peaks at 80–84 (283.6 thousand yen), dental care at 80–84 (40 thousand yen), and pharmacy dispensing at 85–89 (155.4 thousand yen), and at 90+ they fall to 0.854, 0.785, and 0.918 of their peaks.
Observation 5.3: In local doubling times, inpatient care hardly slows in the 80s: 12.4 years at 75–79→80–84 and 12.6 years at 80–84→85–89. Outpatient care slows to 62.5 years at 75–79→80–84 and then falls. Where the total's top end flattens, outpatient, dental, and pharmacy dispensing pass their peaks and only inpatient care keeps rising. The inpatient share of the total rises: 0.201 at 20–24, 0.333 at 60–64, 0.456 at 80–84, and 0.595 at 90+.
6. Splitting the FY2000→FY2023 growth
Calculation 6.1 Expenditure, population, and per capita for six groups (FY2000 → FY2023)
| Group | Expenditure (100 million yen) | Population (thousand) | Per capita (thousand yen) | Per-capita ratio |
|---|---|---|---|---|
| 0–14 | 20,806 → 27,688 | 18,511 → 14,173 | 112.4 → 195.4 | 1.738 |
| 15–44 | 48,674 → 58,421 | 50,492 → 39,401 | 96.4 → 148.3 | 1.538 |
| 45–64 | 86,296 → 105,998 | 35,897 → 34,551 | 240.4 → 306.8 | 1.276 |
| 65–69 | 32,862 → 38,904 | 7,118 → 7,332 | 461.7 → 530.6 | 1.149 |
| 70–74 | 37,247 → 58,400 | 5,910 → 8,817 | 630.3 → 662.4 | 1.051 |
| 75+ | 75,531 → 191,502 | 9,012 → 20,078 | 838.1 → 953.8 | 1.138 |
Calculation 6.2 Splitting the growth of the total (FY2000→FY2023)
| Ratio | ln(ratio) ÷ ln(actual) | |
|---|---|---|
| Population size alone | 0.980 | −0.044 |
| Age composition alone (FY2000 per capita kept) | 1.337 | +0.621 |
| Per capita by age alone (FY2000 age composition kept) | 1.274 | +0.518 |
| Product of the three | 1.668 | |
| Actual | 1.596 |
Observation 6.3: The total as the sum of the six groups went from 301,416 to 480,913 hundred million yen (1.596-fold). The age composition alone gives 1.337-fold and per capita alone 1.274-fold; the age composition part is larger. Population size, at 0.980-fold, pushes down slightly. The product of the three, 1.668, exceeds the actual, and actual ÷ product is 0.956. In Calculation 6.1, the groups with larger per-capita growth lost population, and multiplying the two parts separately comes out larger than the actual.
Observation 6.4: Per-capita growth shrinks with age, from 1.738-fold at 0–14 to 1.051-fold at 70–74, and comes back slightly to 1.138-fold at 75+. Expenditure at 75+ rose 2.535-fold, mostly from growth in numbers (2.228-fold), with per capita at 1.138-fold. At 0–14 the population fell to 0.766-fold, yet per capita rose 1.738-fold and expenditure 1.331-fold. Overall per capita went from 237.4 to 386.7 thousand yen (1.629-fold), larger than the 1.274-fold from per capita by age alone — overall per capita also includes the shift of the age composition toward older ages.
Observation 6.5: Year by year, the age-composition-only line slows: from 370,771 to 387,753 hundred million yen over FY2015→FY2019, and to 394,669 over FY2019→FY2023. The per-capita-only line fell from 353,542 in FY2019 to 339,194 hundred million yen in FY2020 and rose to 384,024 in FY2023. The actual total also fell from 443,895 in FY2019 to 429,665 hundred million yen in FY2020.
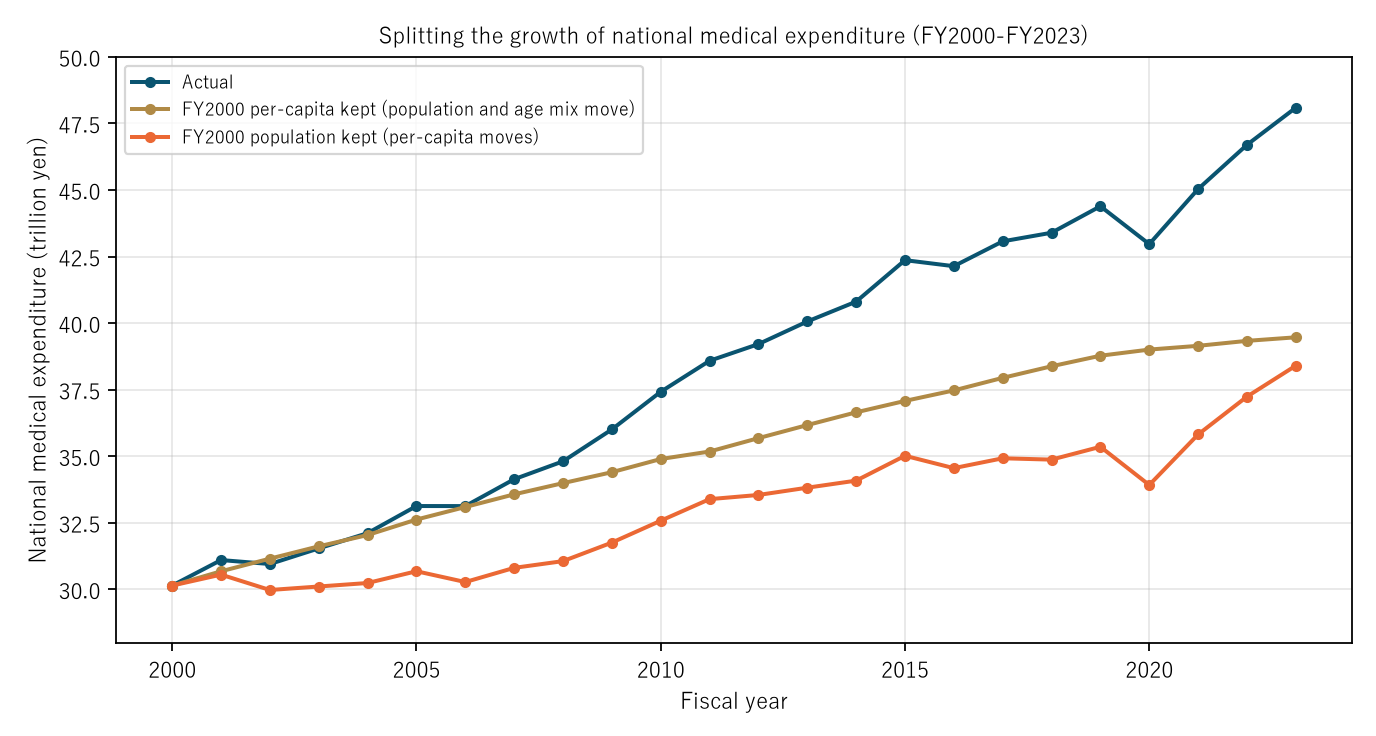
Figure 2: National medical expenditure (trillion yen, FY2000–FY2023). Navy is the actual; gold keeps FY2000 per capita and moves only population and age composition; orange keeps the FY2000 population and moves only per capita.
7. Limitations
- What makes up per-capita growth (the content of care, prices, the share of people using care) cannot be separated with these tables. Fee schedule revisions and changes in who uses care both fall into the same "per capita."
- The FY2000–FY2021 populations of the six groups were back-calculated as expenditure ÷ per capita, so they carry rounding error from per capita (one decimal place in thousand yen). The FY2000 back-calculated sum differs from Table 1's total population by +13 thousand.
- The death rates compared for doubling time are for 2024 and medical expenditure for FY2023, one year apart; deaths are by calendar year and expenditure by fiscal year.
- The numbers line up people of different ages in the same fiscal year, not the change for one person as they age. The paper does not judge medical costs or evaluate the system or fee schedules. Prefectures are not compared. It is not an outlook for any one person.
Conclusion
In FY2023, per-capita national medical expenditure doubled every 16.52 years at ages 40–84, more than twice as long as the doubling time of death rates (men 6.99, women 7.60 years). Inpatient care doubled in 11.71 years and kept rising up to 90+, while outpatient and dental care passed their peaks at 80–84 and pharmacy dispensing at 85–89. The 1.596-fold growth of the total from FY2000 to FY2023 works out to 1.337-fold from the age composition alone and 1.274-fold from per capita alone, and per-capita growth was 1.738-fold at 0–14 against 1.051-fold at 70–74.
One thing separates them — the speed of increase with age, or where people are in age.
When you hear "medical costs rise as people age" or "medical costs have risen," check together whether it is about the doubling time, the age composition, or per-capita expenditure by age.
Data and reproduction
| Data | National Medical Expenditure FY2023 and FY2022 statistical tables, Table 1, Table 5, Reference 2 (Ministry of Health, Labour and Welfare website); National Medical Expenditure FY2021 statistical table, Table 9 (Ministry of Health, Labour and Welfare, e-Stat) (retrieved 26 September 2026) |
| Terms of use | The Ministry's website follows the Public Data License (Version 1.0), and e-Stat the Government of Japan Standard Terms of Use (Version 2.0). The ratios, doubling times, and splits in this paper were processed from them and are not numbers produced by the government |
| Coverage | Japan, FY2000–FY2023 (age shape for FY2023) |
| Verification | 検算/M075.py (--zu also draws the figures). Every number in the text is taken from 検算/M075_output.txt |
| Raw data | data/ holds the retrieved files and SOURCES.md (URLs, retrieval date, SHA-256, terms of use, definitions and how the calculations were set up) |
| Figures | 図/M075_zu1, 図/M075_zu2 (png, svg, English versions) |
References
- Ministry of Health, Labour and Welfare. Overview of National Medical Expenditure FY2023, statistical tables, Table 1, Table 5, Reference 2 (in Japanese; accessed 26 September 2026). https://www.mhlw.go.jp/toukei/saikin/hw/k-iryohi/23/index.html
- Ministry of Health, Labour and Welfare. Overview of National Medical Expenditure FY2022, statistical tables, Table 5, Reference 2 (in Japanese; accessed 26 September 2026). https://www.mhlw.go.jp/toukei/saikin/hw/k-iryohi/22/index.html
- Ministry of Health, Labour and Welfare. National Medical Expenditure FY2021, statistical tables, Table 9: national medical expenditure, composition, and per-capita national medical expenditure, by year and age group (in Japanese). e-Stat (accessed 26 September 2026). https://www.e-stat.go.jp/
- Yamagishi, Y. (2026). "The Death Rate Rose" Names Two Movements at Once, the Age Composition and the Age-Specific Rates [M001]. Zenodo. https://doi.org/10.5281/zenodo.22963112
- Yamagishi, Y. (2026). The Speed at Which Adult Death Rates Double with Age Hardly Moved; What Fell Was the Level [M002]. Zenodo. https://doi.org/10.5281/zenodo.22963210
Reference
Yamagishi, Y. (2026). Per-Capita National Medical Expenditure Doubles Every 16.52 Years at Ages 40–84, More Than Twice as Long as Death Rates (Men 6.99, Women 7.60 Years) [M075]. Zenodo.
DOI: 10.5281/zenodo.22978553
YOI: https://www.yamagishiyuuki.com/yoi/M075
ORCID: 0009-0006-8587-3450
PDF (English) · PDF (Japanese) · Date proof of the English PDF (OpenTimestamps .ots) · SHA256SUMS
The record page for this paper (in Japanese, with the PDFs in each language and the date proof): YOI M075. This paper is a preprint and has not been peer reviewed.