Abstract
Using Table III-5 of the Ministry of Health, Labour and Welfare's "Recent Trends in Dispensing Costs (electronically processed claims)," March FY2023 issue — oral drug days supplied by drug class and month — this paper looked at which drug classes have a season in prescribing, over 15 fiscal years, FY2009–FY2023. No new mathematical theorem and no new law are claimed.
First, the tables are consistent. For every row and year, the 12 months sum to the fiscal-year value and April–September sums to the first-half value (Section 3).
Second, this is the core of the paper. Per day, dividing days supplied by calendar days, all oral drugs peak in December (1.067) and bottom in May (0.932), and 11 of the 14 major classes also peak in December. This is less a season than a calendar shape common to all classes (Section 4).
Third, dividing a class's monthly share by the total's monthly share cancels the calendar shape. What then remains large is only allergy drugs (the March peak 1.944 times the August trough) and respiratory drugs (the December peak 1.408 times the August trough); the other 12 major classes stay at 1.035–1.111-fold (Section 5).
Fourth, allergy drugs peak in March in 14 of the 15 years (only FY2019 in February), so the peak month hardly moves. Respiratory drugs peak in November–January in 14 of the 15 years, and in December in 6 (Section 5).
Fifth, comparing each class's per-day monthly shape with the total by correlation, 8 of the remaining 12 major classes are 0.9 or higher. The lowest is nutrients and tonics (0.616), below allergy drugs (0.697) — how similar the per-day shape is and how large the season is are different yardsticks (Section 4).
Sixth, what separates them is the calendar (a monthly shape common to all classes) versus the season (a shape particular to a class). "More drugs in December" is about a calendar that covers almost every class, while seasons one can call "more in spring" or "more in winter" gather in allergy drugs and respiratory drugs.
Scope note: This paper claims no new mathematical theorem and no new law — days supplied are in public tables, and this paper only divided them by calendar days and by the total's shape and lined them up. This paper is a structural interpretation of the shape of numbers in public aggregate data; it is not medical advice, not a diagnosis, and not a treatment recommendation. The author is not a physician. Decisions about individual health should be discussed with a physician or a medical institution. This is a preprint that has not been peer reviewed. It does not go into why the monthly shapes are as they are (disease outbreaks, pollen, prescriptions given together before long holidays, and so on) — these tables cannot separate the reasons. Nor does it go into drug prices, efficacy, or prescribing. No product or manufacturer names are used; the unit of aggregation is the major drug class. Central nervous system drugs, antibiotics, and chemotherapeutics are not shown. The month is the month of dispensing, not the month an illness occurred. Prefectures and pharmacies are not compared. About the data: "Recent Trends in Dispensing Costs (electronically processed claims)" (Ministry of Health, Labour and Welfare) was taken from the Ministry's website and used under the Public Data License (Version 1.0); the indices and correlations in this paper were processed from it. What this paper adds: lining up prescribing's monthly shape in two ways, divided by calendar days and divided by the total's shape, separating the calendar shape common to all classes from each class's season, and showing over 15 fiscal years that the seasons that remain large gather in two classes, allergy drugs and respiratory drugs.
1. Notation and question
- Days supplied: the total dispensed quantity (oral drugs) per prescription and per drug on dispensing fee statements (million days).
- Per-day index: (the month's days supplied ÷ its calendar days) ÷ (the fiscal year's days supplied ÷ its calendar days), averaged over 15 fiscal years.
- Index relative to the total: (the class's share in that month) ÷ (the share of all oral drugs in that month). A monthly shape common to all classes cancels here.
- Peak ÷ trough: the largest month's index ÷ the smallest month's among the 12.
Question: In the monthly shape of prescribing, which part is season and which is calendar? Which drug classes have a season?
Observation 1.1: M077 split the drug cost of one prescription into three factors using the annual edition of the same "Trends in Dispensing Costs." M079 looked at the age shape by drug class. This paper looks at the monthly shape by drug class.
2. Preview and design
Honestly stated: the design was decided after looking at the tables.
| Content | |
|---|---|
| Table | Recent Trends in Dispensing Costs (electronically processed claims), March FY2023 issue, Table III-5: oral drug days supplied (by drug class, all ages) |
| Noticed in the preview | Per day, almost every class peaked in December, in the same shape as the total. To see seasons, this common shape had to be removed. The preview measured only 8 fiscal years, and 4 checks set from it failed over 15 years (described in Sections 4 and 5) |
| Comparison | For 15 fiscal years, FY2009–FY2023 (the published range stated in the table's note), the per-day index and the index relative to the total. Shown are 14 of the 17 major classes |
3. Data and checks
Calculation 3.1 The 3 retrieved files were fixed by SHA-256, and the following were checked.
- From Table III-5's headings, the columns for the 12 months, "April–March," and "April–September" were aligned for 15 fiscal years, FY2009–FY2023. Rows are all oral drugs and 17 major classes.
- For every row and year, the 12 months sum to "April–March" and April–September sums to "April–September" (million days, within 0.001).
- The per-day index has a calendar-day-weighted mean of 1 in every year (a check on its construction).
- Days supplied for all oral drugs were 40,813 million in FY2009 and 66,529 million in FY2023.
4. Per day, almost every class peaks in December
Calculation 4.1 Per-day index for all oral drugs (mean of FY2009–FY2023)
| April | May | June | July | August | September | October |
|---|---|---|---|---|---|---|
| 1.041 | 0.932 | 0.979 | 0.984 | 0.957 | 0.981 | 1.010 |
| November | December | January | February | March | Peak ÷ trough |
|---|---|---|---|---|---|
| 1.009 | 1.067 | 0.951 | 1.034 | 1.058 | 1.145 |
Observation 4.2: All oral drugs per day peak in December (1.067) and bottom in May (0.932), with peak ÷ trough 1.145. Eleven of the 14 major classes also peak in December, and the other 3 (hormones, antineoplastics, allergy drugs) peak in March. Excluding allergy and respiratory drugs, the 12 major classes have peak ÷ trough within 1.124–1.216.
Observation 4.3: Comparing each 12-month per-day shape with the total, 8 of the remaining 12 major classes (cardiovascular, digestive, hormones, urogenital and anal, blood and body fluid, other metabolic, antineoplastic, Kampo preparations) have correlations of 0.9 or higher. It first failed because I wrote that all 12 exceeded 0.9 — below 0.9 are peripheral nervous system drugs 0.729, sensory organ drugs 0.796, vitamins 0.874, and nutrients and tonics 0.616. The lowest correlation was also not allergy drugs (0.697), as I first wrote, but nutrients and tonics.
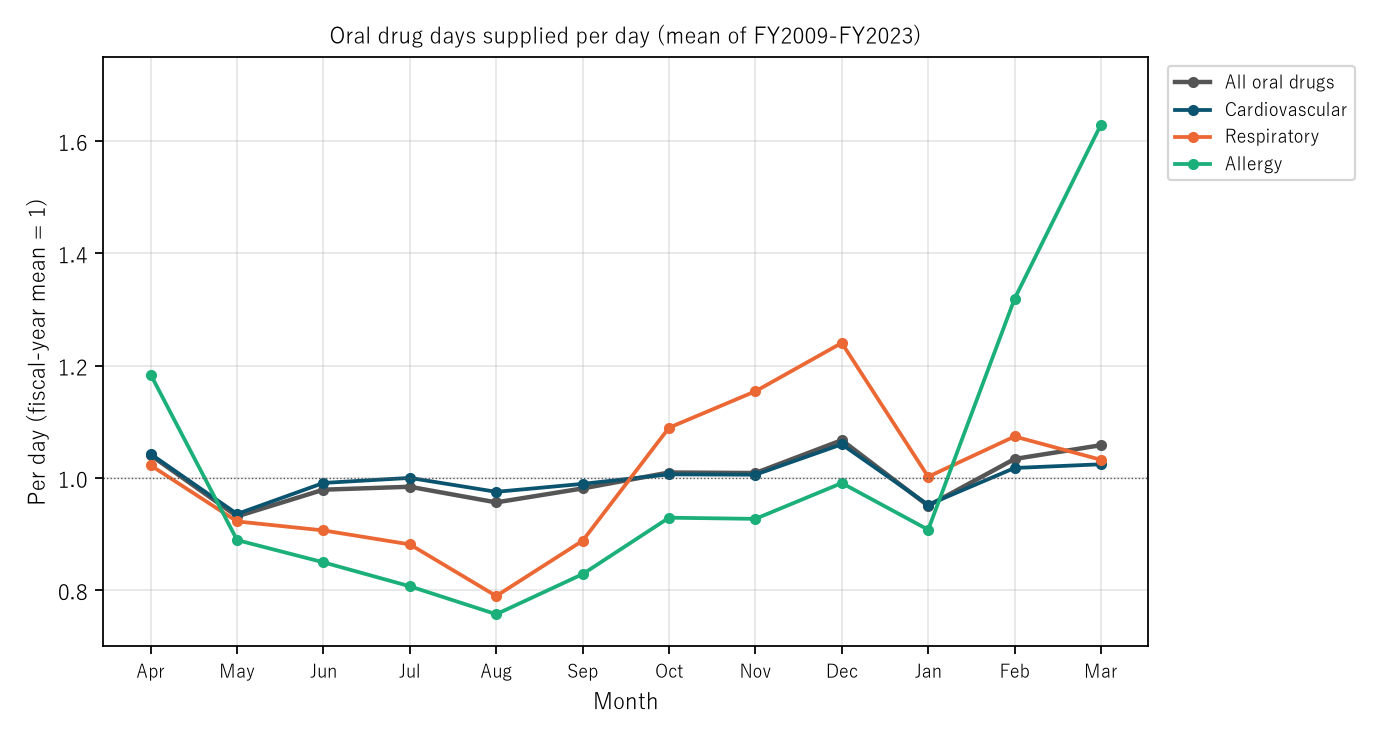
Figure 1: Per-day index of oral drug days supplied (mean of FY2009–FY2023). Gray is all oral drugs, navy cardiovascular, orange respiratory, and green allergy drugs.
5. Dividing by the total's shape, the remaining seasons gather in two classes
Calculation 5.1 Index relative to the total (mean of FY2009–FY2023)
| Major class | Peak month | Peak | Trough month | Trough | Peak ÷ trough |
|---|---|---|---|---|---|
| Allergy | March | 1.539 | August | 0.792 | 1.944 |
| Respiratory | December | 1.162 | August | 0.825 | 1.408 |
| Nutrients and tonics | August | 1.055 | March | 0.950 | 1.111 |
| Peripheral nervous system | June | 1.036 | March | 0.944 | 1.098 |
| Cardiovascular | August | 1.020 | March | 0.968 | 1.054 |
| Urogenital and anal | January | 1.022 | April | 0.987 | 1.035 |
Observation 5.2: Dividing by the total's monthly shape, only allergy drugs (1.944) and respiratory drugs (1.408) keep a large peak ÷ trough; the other 12 major classes stay at 1.035–1.111. It first failed because I set "all at 1.10 or less" — nutrients and tonics were at 1.111. Allergy drugs are high in spring, February 1.276, March 1.539, April 1.138, falling to 0.792 in August. Respiratory drugs rise from 1.079 in October to 1.162 in December, with the trough at 0.825 in August.
Observation 5.3: Allergy drugs peaked in March in 14 of the 15 years, and only FY2019 in February. It first failed because I wrote March for all years. The peak month for respiratory drugs moves by year: December in 6 of the 15 years, and November–January in 14. (For reference, classes not shown have peak ÷ trough relative to the total of 1.062 for central nervous system drugs, 1.227 for antibiotics, and 1.211 for chemotherapeutics.)
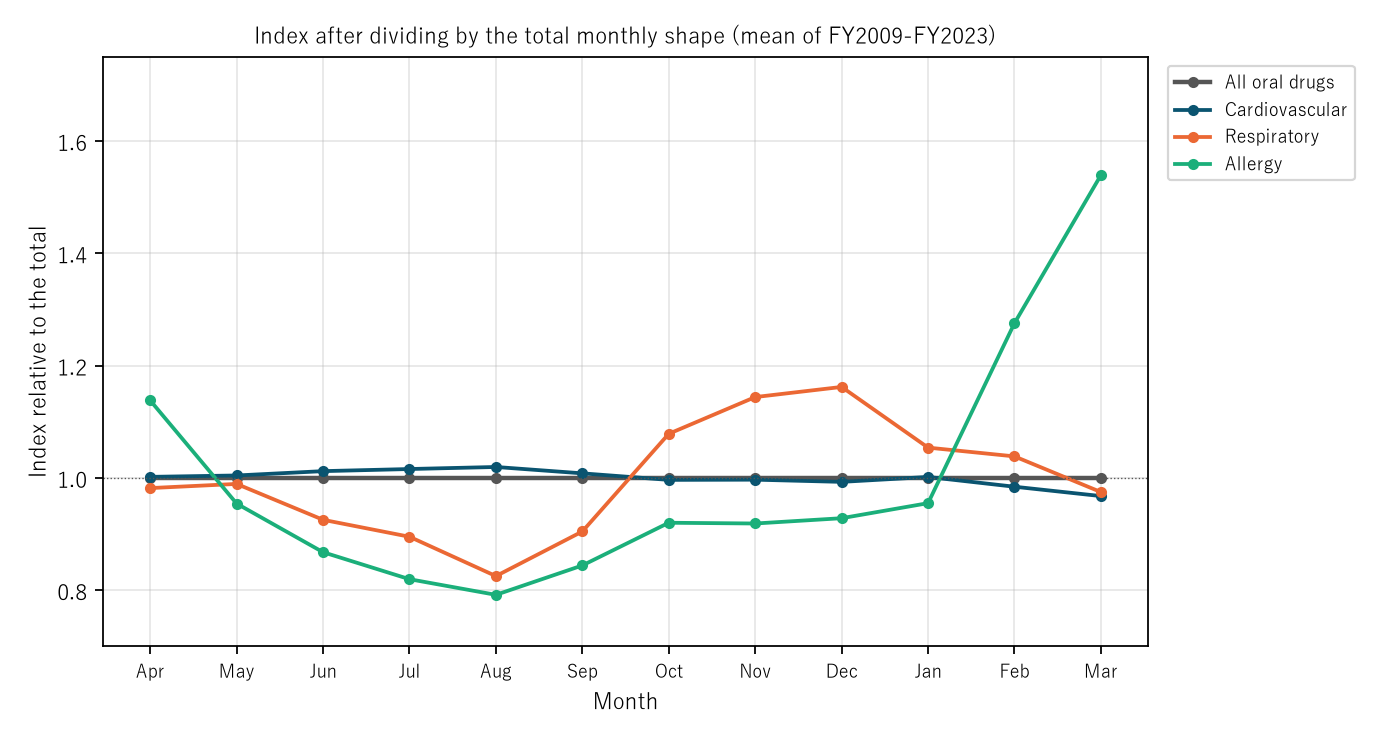
Figure 2: Index relative to the total (mean of FY2009–FY2023). Gray is all oral drugs (equal to 1), navy cardiovascular, orange respiratory, and green allergy drugs.
6. Limitations
- The reasons for the monthly shapes cannot be separated with these tables. Disease outbreaks, pollen, and prescriptions given together before long holidays all lie outside these tables.
- The month is the month of dispensing, and taking the drugs spreads over the days prescribed. Days supplied are a sum of days, not people.
- The index relative to the total shows other classes slightly in the opposite direction, to the extent that the total contains the seasons of allergy and respiratory drugs (March looks low, for example).
- Only 14 major classes are shown, and differences among small classes are not examined. Drug prices and prescribing are not judged. Prefectures and pharmacies are not compared.
Conclusion
Per day, oral drug days supplied for all oral drugs peaked in December and bottomed in May, and 11 of 14 major drug classes also peaked in December. After dividing by the total's monthly shape, only allergy drugs (March 1.944 times August; March peaks in 14 of 15 years) and respiratory drugs (December 1.408 times August) remained large, and the other 12 major classes stayed at 1.035–1.111-fold.
One thing separates them — the calendar (a monthly shape common to all classes) or the season (a shape particular to a class).
When you hear "this month has more drugs," check together whether it is about the calendar common to every class or a season particular to that class.
Data and reproduction
| Data | Recent Trends in Dispensing Costs (electronically processed claims), March FY2023 issue, Table III-5 (Ministry of Health, Labour and Welfare website) (retrieved 26 September 2026) |
| Terms of use | The Ministry's website follows the Public Data License (Version 1.0). The indices and correlations in this paper were processed from it and are not numbers produced by the government |
| Coverage | Japan, FY2009–FY2023, dispensing at insurance pharmacies (electronically processed), oral drugs |
| Verification | 検算/M080.py (--zu also draws the figures). Every number in the text is taken from 検算/M080_output.txt |
| Raw data | data/ holds the retrieved files and SOURCES.md (URLs, retrieval date, SHA-256, terms of use, definitions and how the calculations were set up) |
| Figures | 図/M080_zu1, 図/M080_zu2 (png, svg, English versions) |
References
- Ministry of Health, Labour and Welfare. Recent Trends in Dispensing Costs (electronically processed claims), March FY2023 issue, Table III-5: oral drug days supplied by drug class (in Japanese; accessed 26 September 2026). https://www.mhlw.go.jp/topics/medias/c-med/2024/03/
- Yamagishi, Y. (2026). Oral Drug Cost per Prescription Hardly Moved from FY2012 to FY2023, from 5,180 to 5,334 Yen (1.030-Fold), but Split into Number of Drug Types, Days per Type, and Cost per Type per Day It Moved 0.962-, 1.279-, and 0.837-Fold — Cost per Type per Day for Antineoplastics, 2,271.69 Yen, Is 118.3 Times That for Respiratory Drugs, and It Rose in 4 of 8 Drug Classes and Fell in 4 [M077]. Zenodo. https://doi.org/10.5281/zenodo.22978716
- Yamagishi, Y. (2026). Dividing Pharmacy Drug Points by Population, 12 of 14 Middle Drug Classes Peak per Person at 75 or Older, and Only Dermatological Drugs (Ages 0–4) and Allergy Drugs (10–14) Peak in Childhood — In Totals Without Dividing by Population, 10 Classes Peak at 75–79, and the Peak for Hormones Moves from 75–79 per Person to 50–54 in Total [M079]. Zenodo. https://doi.org/10.5281/zenodo.22978821
Reference
Yamagishi, Y. (2026). Per Day, Oral Drug Days Supplied Peak in December for 11 of 14 Major Drug Classes, as for All Oral Drugs [M080]. Zenodo.
DOI: 10.5281/zenodo.22978912
YOI: https://www.yamagishiyuuki.com/yoi/M080
ORCID: 0009-0006-8587-3450
PDF (English) · PDF (Japanese) · Date proof of the English PDF (OpenTimestamps .ots) · SHA256SUMS
The record page for this paper (in Japanese, with the PDFs in each language and the date proof): YOI M080. This paper is a preprint and has not been peer reviewed.