Abstract
For every municipality in Japan, I counted how many of the 526 industrial subcategories of the Economic Census have at least one establishment located there.
Across 1,889 municipalities, the number of subcategories present is almost fully determined by the common logarithm of population (R² = 0.925).
A tenfold increase in population adds about 135 subcategories.
Taking this relation as a baseline, the industrial breadth of a municipality can be expressed as its residual: the difference between the observed count and the value predicted from population.
Large positive residuals occur in central urban wards; large negative residuals occur in municipalities that were subject to evacuation orders after the 2011 nuclear accident.
The eight municipalities of the Kushiro Subprefecture have residuals between −16.4 and +19.7, all within one standard deviation of the residuals.
That 169 of the 526 subcategories are absent from the subprefecture as a whole is therefore what its population predicts, not a feature specific to the region.
I also show that summing the municipal table naively double-counts the designated cities, and define two units of analysis, both of which reconcile exactly with the national population.
1. Introduction
"There is no X in this town" is a common statement. But how many missing industries counts as many cannot be decided without a baseline.
This paper asks one question.
What determines the number of industrial subcategories present in a municipality?
If the answer is population, then what matters is not the raw count of missing industries but the difference from the count predicted by population. That difference is what is specific to the place.
2. Data
| Establishments | Statistics Bureau of Japan and METI, 2021 Economic Census for Business Activity (as of 1 June 2021). 526 industrial subcategories × municipality |
| Population | Ministry of Internal Affairs and Communications, Basic Resident Register population, as of 1 January 2026 |
Both are openly published. The five-year gap between the two is discussed in Section 6.
3. Defining the unit — the municipal table cannot simply be summed
For each designated city (seirei shitei toshi), the municipal table contains both a row for the city total and rows for its wards.
Summing every row yields 151,230,856, exceeding the national population by 27,463,214.
I therefore define two units.
| Unit | Definition | Count | Population |
|---|---|---|---|
| A | Aggregate rows excluded (designated cities split into wards) | 1,892 | 123,767,642 |
| B | Designated cities counted as one city (wards excluded) | 1,741 | 123,767,642 |
Both reconcile exactly with the national population (123,767,642).
Unit A is used below unless stated otherwise. Rows with no population figure — such as the former wards of Hamamatsu, reorganised in 2024 — are excluded.
4. Results
4-1 Establishments per 10,000 residents fall as population rises
| Population band | Municipalities | Establishments per 10,000 (median) |
|---|---|---|
| under 5,000 | 307 | 694.4 |
| 5,000–10,000 | 243 | 549.7 |
| 10,000–30,000 | 448 | 477.6 |
| 30,000–100,000 | 498 | 427.4 |
| 100,000–300,000 | 328 | 380.0 |
| 300,000–1,000,000 | 65 | 351.5 |
The correlation is r = −0.459 (log₁₀ population × density, n = 1,889); under unit B, r = −0.484.
Smaller municipalities have more establishments per resident.
Under unit B, the eleven cities above one million residents have a median of 450.7 and depart from this trend.
4-2 The number of subcategories present is almost fully determined by log population
| Population band | Municipalities | Subcategories present (median) | Absent |
|---|---|---|---|
| under 5,000 | 307 | 84 | 442 |
| 5,000–10,000 | 243 | 132 | 394 |
| 10,000–30,000 | 448 | 185 | 341 |
| 30,000–100,000 | 498 | 261 | 265 |
| 100,000–300,000 | 328 | 326.5 | 199.5 |
| 300,000–1,000,000 | 65 | 391 | 135 |
The correlation is r = 0.962. Ordinary least squares gives
subcategories present = 134.93 × log₁₀(population) − 378.69
R² = 0.925, residual standard deviation 25.6 subcategories, n = 1,889
A tenfold increase in population adds about 135 subcategories.
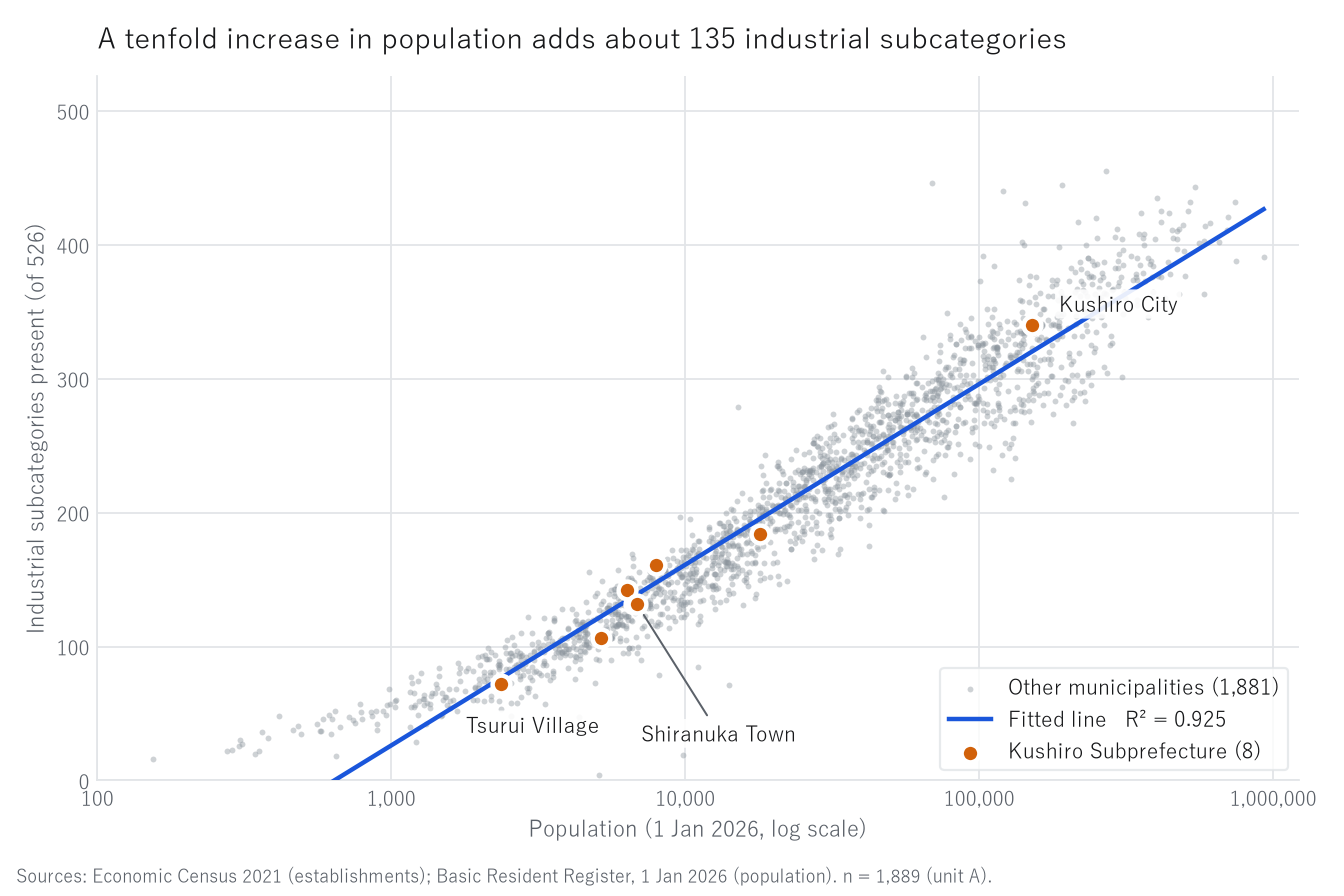
Figure 1. Population and the number of industrial subcategories present (1,889 municipalities, unit A).
Grey points are the other municipalities, the blue line is the fit (R² = 0.925), and the orange points are the eight municipalities of the Kushiro Subprefecture. The horizontal axis is on a common-logarithmic scale.
4-3 Municipalities far from the prediction
| Above prediction | Population | Observed | Predicted | Residual |
|---|---|---|---|---|
| Chiyoda, Tokyo | 69,139 | 446 | 274.3 | +171.7 |
| Chuo, Osaka | 120,441 | 440 | 306.9 | +133.1 |
| Kita, Osaka | 143,711 | 431 | 317.2 | +113.8 |
| Chuo, Tokyo | 191,015 | 445 | 333.9 | +111.1 |
| Minato, Tokyo | 269,877 | 455 | 354.1 | +100.9 |
| Below prediction | Population | Observed | Predicted | Residual |
|---|---|---|---|---|
| Okuma, Fukushima | 9,803 | 19 | 159.9 | −140.9 |
| Futaba, Fukushima | 5,090 | 4 | 121.5 | −117.5 |
| Namie, Fukushima | 14,106 | 71 | 181.2 | −110.2 |
| Jonan, Fukuoka | 127,995 | 225 | 310.4 | −85.4 |
| Tomioka, Fukushima | 11,049 | 85 | 166.9 | −81.9 |
The positive side consists of central wards where the daytime population greatly exceeds the resident population.
Four of the five on the negative side were subject to evacuation orders following the 2011 nuclear accident, so that at the time of the survey (2021) the relation between resident population and establishments differed from the normal case.
The model does not account for such circumstances.
4-4 The eight municipalities of the Kushiro Subprefecture
| Municipality | Population | Est. per 10,000 | Rank (density) | Present | Predicted | Residual |
|---|---|---|---|---|---|---|
| Kushiro City | 151,566 | 527.1 | 727/1889 | 340 | 320.3 | +19.7 |
| Kushiro Town | 18,021 | 559.9 | 606/1889 | 184 | 195.5 | −11.5 |
| Akkeshi | 7,976 | 665.7 | 321/1889 | 161 | 147.8 | +13.2 |
| Hamanaka | 5,172 | 587.8 | 516/1889 | 106 | 122.4 | −16.4 |
| Shibecha | 6,698 | 649.4 | 359/1889 | 132 | 137.6 | −5.6 |
| Teshikaga | 6,327 | 739.7 | 199/1889 | 142 | 134.2 | +7.8 |
| Tsurui | 2,368 | 591.2 | 505/1889 | 72 | 76.6 | −4.6 |
| Shiranuka | 6,840 | 583.3 | 533/1889 | 132 | 138.8 | −6.8 |
All eight lie within one residual standard deviation (25.6 subcategories).
Taken as a whole, 169 of the 526 subcategories (32.1%) are absent from the subprefecture.
For Shiranuka alone, 394 (74.9%) are absent. The two figures differ greatly, yet both fall within the range predicted by population.
5. Discussion
5-1 Use the residual, not the raw count of what is absent
If industrial breadth is almost fully determined by log population, then listing the number of missing industries mainly restates the size of the population.
To see what is specific to a place, the residual is the more informative quantity.
The equation above can serve as that baseline, and can be applied to any of the 1,889 municipalities.
5-1b Adding age structure does not improve the fit
One might ask whether age structure matters in addition to population size. It was tested.
Adding the share of residents aged 65 and over as a second variable gives
subcategories present = 136.92 × log₁₀(population) + 0.23 × share aged 65+ − 395.75,
and R² rises only from 0.925 to 0.926 (the residual standard deviation stays at 25.6 subcategories).
The correlation between the residual and the share aged 65 and over is r = +0.044, essentially none.
The reason is that the share aged 65 and over moves together with population size
(r = −0.665: smaller municipalities have older populations).
The age information is already contained in log₁₀(population).
5-2 Fix the granularity before counting
For the same Kushiro area, 169 subcategories are absent when the subprefecture is taken as a whole, and 394 when Shiranuka alone is taken.
The count of what is absent is a property of the area as much as a function of the boundary drawn around it.
Any count of absence must state its boundary first.
5-3 What can and cannot be said
The equation gives the number of industry types expected at a given population size.
It does not follow that a positive residual means prosperity, or that a negative residual means opportunity.
The residual is an entry point for deciding what to examine next, nothing more.
6. Limitations
- Establishments are as of 1 June 2021 and population as of 1 January 2026: a five-year gap. In municipalities losing population, residuals may be biased upward
- Correlation and regression describe association, not the direction of causation
- "Present" means that at least one establishment of that subcategory is recorded in that municipality. Suppressed and non-responding cells follow the treatment of the source tables
- Industrial subcategories are an administrative classification and do not map one-to-one onto trades as practised
- Unit A splits designated cities into wards; a ward is part of a city and need not be an independent economic area
- Only establishment counts are used here; sales, employment and value added are not examined
7. Reproduction
- Obtain the number of establishments by industrial subcategory and municipality from the 2021 Economic Census via e-Stat
- Obtain the Basic Resident Register population by municipality as of 1 January 2026 from MIC
- Exclude aggregate rows and join on the municipality code (Section 3)
- For each municipality, count the subcategories with at least one establishment
- Fit by ordinary least squares with log₁₀(population) as the explanatory variable
All values in this paper are the output of a single script (kensan_184). No intermediate value was transcribed by hand.
References and data sources
- Statistics Bureau of Japan and Ministry of Economy, Trade and Industry, 2021 Economic Census for Business Activity, number of establishments by industrial subcategory and municipality.
- Ministry of Internal Affairs and Communications, Population, Demographics and Number of Households Based on the Basic Resident Register, as of 1 January 2026.
Both are published on e-Stat and on the ministries' websites.
Version history
| Version | Date | Change |
|---|---|---|
| 1 | 2026-09-21 | First release |
How to cite
Yamagishi, Y. (2026). Population and the Number of Industrial Subcategories Present in Japanese Municipalities: Evidence from 1,889 Municipalities and the Kushiro Subprefecture [R001]. Zenodo. https://doi.org/10.5281/zenodo.22872218
(This DOI is the concept DOI; it always resolves to the latest version. Cite this one.)
© 2026 Yuuki YAMAGISHI
This work is licensed under a Creative Commons Attribution 4.0 International License (CC BY 4.0).
You may copy, adapt, redistribute and use it commercially, provided you give appropriate credit.
creativecommons.org/licenses/by/4.0
All figures and values in this paper were computed from official statistics. Rights in the underlying data remain with the publishing agencies.
Reference
Yamagishi, Y. (2026). Population and the Number of Industrial Subcategories Present in Japanese Municipalities: Evidence from 1,889 Municipalities and the Kushiro Subprefecture [R001]. Zenodo.
DOI: 10.5281/zenodo.22872218
YOI: https://www.yamagishiyuuki.com/yoi/R001
ORCID: 0009-0006-8587-3450
PDF (English) · PDF (Japanese) · Date proof of the English PDF (OpenTimestamps .ots) · SHA256SUMS
The record page for this paper (in Japanese, with the PDFs in each language and the date proof): YOI R001. This paper is a preprint and has not been peer reviewed.