Abstract
I placed four conditions faced by small businesses side by side for all 47 prefectures of Japan: the regional minimum wage (FY2026 recommendation), the consumer price regional difference index (2024), taxable income per taxpayer (FY2025) and commercial land prices (2026 Land Price Publication).
The size of the regional gap differs by orders of magnitude depending on the item.
| Top ÷ bottom | |
|---|---|
| Consumer prices | 1.081 |
| Minimum wage (current) | 1.198 |
| Taxable income per taxpayer | 1.85 |
| Commercial land price | 87.4 |
The minimum wage moves from a national population-weighted 1,121 yen to 1,177 yen (+5.0%). The rate of increase ranges from +6.3% in Saga to +4.4% in Tokyo, and the correlation between the current level and the rate of increase is r = −0.889. Because the lower prefectures raise by more, the top-to-bottom ratio narrows slightly from 1.198 to 1.180.
Dividing by prices narrows the gap only from 1.198 to 1.165. The regional gap in prices is only 1.081-fold, so the claim that "wages can be lower in the provinces because prices are lower" is weak in the data (correlation between minimum wage and prices, r = +0.521).
Hokkaido ranks 13th in nominal terms but falls to 29th when divided by prices (−16). Its price index of 101.9 is the third highest in Japan. Kagoshima moves the other way, from 44th to 24th (+20).
Commercial land in Kushiro City averages 35,140 yen/m². That is 1/95 of Tokyo's weighted average of 3,340,679 yen/m², and one third of the national median of 107,201 yen/m².
1. Introduction
R005 computed how many industrial subcategories would leave each municipality by 2050. X001 counted how many people each of 526 subcategories runs on per establishment.
What remains is the condition of the place where a trade is put. The price of employing someone, the cost of living, the income customers hold, and the ground rent of a storefront.
How much do the conditions facing small businesses differ by region, and which cost item differs most?
2. Data
| Minimum wage | MHLW, FY2026 regional minimum wage recommendations (current = FY2025, recommended = FY2026, rank A/B/C) |
| Prices | MIC, Consumer Price Regional Difference Index, all items, 2024 (national = 100) |
| Income | Survey of Municipal Taxation, FY2025, taxable income per taxpayer |
| Land | 2026 Land Price Publication (National Land Numerical Information), commercial standard sites; municipal averages aggregated to prefectures weighted by the number of sites |
| Population, ageing rate, establishments | MIC Basic Resident Register, 1 January 2026; Economic Census 2021 |
All four are available for all 47 prefectures.
"Minimum wage divided by prices" is computed as current wage ÷ price index × 100. This is my own calculation, not an official indicator.
3. Results
3-1 Minimum wages differ by only 1.198-fold
| High | Median | Low | Top ÷ bottom | |
|---|---|---|---|---|
| Current (FY2025) | Tokyo 1,226 / Kanagawa 1,225 / Osaka 1,177 | 1,051 | Kochi 1,023 / Miyazaki 1,023 / Okinawa 1,023 | 203 yen, 1.198 |
| Recommended (FY2026) | Tokyo 1,280 / Kanagawa 1,279 / Osaka 1,231 | Kochi 1,086 / Okinawa 1,086 / Miyazaki 1,085 | 195 yen, 1.180 |
The national population-weighted average moves from 1,121 to 1,177 yen (+5.0%).
| Rate of increase | Largest | Smallest |
|---|---|---|
| Saga +6.3% (+65) / Kagoshima +6.2% (+64) / Kochi +6.2% (+63) | Osaka +4.6% (+54) / Kanagawa +4.4% (+54) / Tokyo +4.4% (+54) |
The correlation between the current level and the rate of increase is r = −0.889. This is a very strong negative correlation: the lower the prefecture, the larger the raise, clearly visible in the numbers. The top-to-bottom ratio therefore narrows from 1.198 to 1.180.
3-2 Dividing by prices narrows little
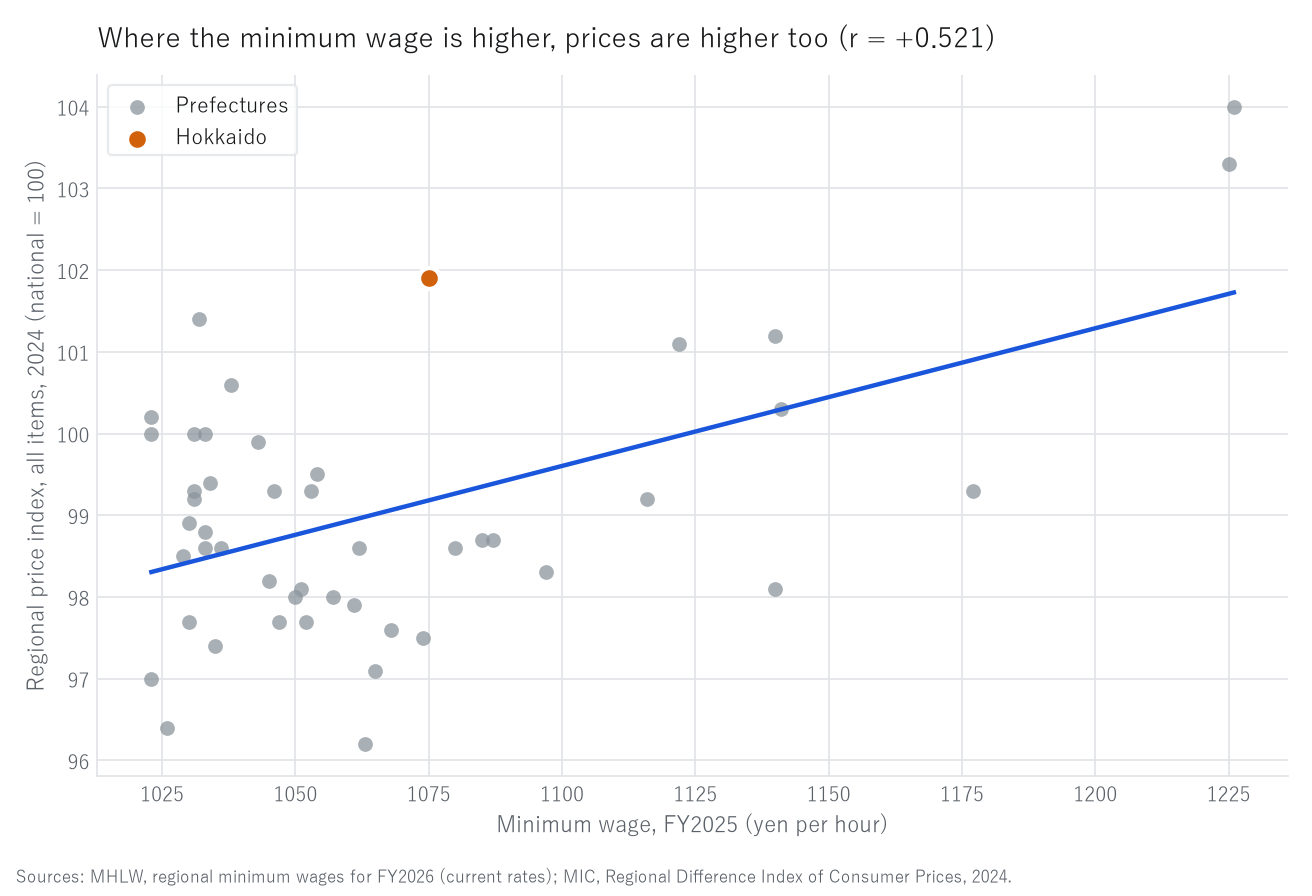
Figure 1. Minimum wage and consumer price regional difference index, 47 prefectures.
Grey is prefectures, orange is Hokkaido, the blue line is the least-squares fit.
| Consumer price index (national = 100) | High | Low | Top ÷ bottom |
|---|---|---|---|
| Tokyo 104.0 / Kanagawa 103.3 / Hokkaido 101.9 | Miyazaki 97.0 / Kagoshima 96.4 / Gunma 96.2 | 1.081 |
The regional gap in prices is only 1.081-fold, smaller than the 1.198-fold gap in minimum wages.
| Minimum wage divided by prices | High | Low | Top ÷ bottom |
|---|---|---|---|
| Kanagawa 1,186 / Osaka 1,185 / Tokyo 1,179 | Kochi 1,023 / Okinawa 1,021 / Yamagata 1,018 | 1.165 |
A nominal 1.198 becomes a real 1.165 — that is all. Dividing by prices closes almost none of the gap.
The correlation between the minimum wage and prices is r = +0.521. Positive, but not strong. The claim that "wages can be lower in the provinces because prices are lower" is weak in the data.
3-3 Prefectures whose rank moves sharply
| Nominal → real | Change |
|---|---|
| Hokkaido | 13th → 29th (−16) |
| Miyagi | 30th → 43rd (−13) |
| Yamagata | 37th → 47th (−10) |
| Saga | 42nd → 31st (+11) |
| Miyazaki | 46th → 30th (+16) |
| Kagoshima | 44th → 24th (+20) |
Hokkaido is 13th from the top in nominal terms but falls to 29th when divided by prices. Its price index of 101.9 is third in Japan after Tokyo and Kanagawa.
Kagoshima moves the other way, from 44th to 24th, because its price index of 96.4 is 46th.
3-4 Only land prices differ by orders of magnitude
| High | Low | Top ÷ bottom | |
|---|---|---|---|
| Taxable income per taxpayer (thousand yen) | Tokyo 5,511 / Kanagawa 4,356 / Aichi 4,075 | Tottori 3,005 / Aomori 2,989 / Akita 2,985 | 1.85 |
| Commercial land price (yen/m²) | Tokyo 3,340,679 / Osaka 1,643,618 / Kyoto 1,153,621 | Yamagata 49,285 / Tottori 47,170 / Akita 38,205 | 87.4 |
Of the four items, only land prices differ by two orders of magnitude.
| Item | Top ÷ bottom |
|---|---|
| Consumer prices | 1.081 |
| Minimum wage | 1.198 |
| Taxable income per taxpayer | 1.85 |
| Commercial land price | 87.4 |
3-5 How the four relate
| Correlation (47 prefectures) | r |
|---|---|
| Minimum wage × income | +0.906 |
| Minimum wage × population (log) | +0.851 |
| Minimum wage × land price (log) | +0.754 |
| Minimum wage × prices | +0.521 |
| Minimum wage × ageing rate | −0.742 |
| Minimum wage × establishments per 10,000 population | −0.537 |
| Income × land price (log) | +0.785 |
| Prices × land price (log) | +0.513 |
The minimum wage is most strongly tied to income (+0.906), and more weakly to prices (+0.521).
The correlation between the minimum wage and establishments per 10,000 population is −0.537. The lower the minimum wage, the more establishments per head — the same direction as R001's finding that less populous municipalities have more establishments per head.
3-6 Ranks A, B and C
| Rank | Prefectures | Median current | Median prices | Median real | Median income |
|---|---|---|---|---|---|
| A | 6 | 1,159 yen | 100.8 | 1,170 | 4,012 thousand yen |
| B | 28 | 1,056 yen | 98.6 | 1,074 | 3,411 thousand yen |
| C | 13 | 1,030 yen | 99.2 | 1,040 | 3,066 thousand yen |
The median price index is inverted between ranks B and C (98.6 against 99.2). The nominal minimum wage is higher in B, but prices are higher in C.
3-7 Hokkaido and the Kushiro Subprefecture
| Minimum wage, current | 1,075 yen (13th of 47), rank B |
| Minimum wage, recommended | 1,131 yen (+5.2%) |
| Price index | 101.9 (3rd) |
| Minimum wage divided by prices | 1,055 (29th) |
| Nominal → real | 13th → 29th (−16) |
| Taxable income per taxpayer | 3,389 thousand yen (22nd) |
| Commercial land price | 300,144 yen/m² (12th) |
Hokkaido's condition is: wages above the middle, prices third in Japan, income in the middle. In real terms it falls to 29th of 47.
Commercial land prices in the Kushiro Subprefecture:
| Municipality | Commercial average (yen/m²) |
|---|---|
| Kushiro City | 35,140 |
| Kushiro Town | 56,500 |
| Akkeshi, Hamanaka, Shibecha, Teshikaga, Tsurui, Shiranuka | no commercial standard site |
Kushiro City's 35,140 yen/m² is 1/95 of Tokyo's weighted average of 3,340,679 yen/m², about 1/8.5 of Hokkaido's weighted average of 300,144, and about one third of the national median of 107,201.
Kushiro Town (56,500) is higher than Kushiro City (35,140).
Six of the eight municipalities in the subprefecture have no commercial standard site at all.
4. Discussion
4-1 "The provinces are cheap" depends on the item
It is often said that labour is cheap in the provinces. But the minimum wage gap is 1.198-fold, narrowing to 1.180 under the recommendation. A factor of 1.2 is a 20% difference.
The price gap is smaller still, 1.081. Income is 1.85.
Only land is 87.4. Tokyo 3,340,679 yen/m² against Akita 38,205. Two orders of magnitude.
What is genuinely cheap in the provinces is ground rent. Labour saves 20%; prices save 8%.
4-2 Dividing by prices barely closes the wage gap
A nominal 1.198 becomes a real 1.165. The gap closes by 0.033.
This is because the regional gap in prices (1.081) is smaller than the gap in wages (1.198). Prices are more evenly spread than wages.
The correlation between the minimum wage and prices is +0.521, far weaker than the +0.906 with income. What the level of the minimum wage tracks is income rather than prices.
4-3 In Hokkaido, prices are higher than wages
Hokkaido is 13th in wages and 3rd in prices, so dividing by prices drops it to 29th.
This cuts both ways for a small business in Hokkaido. As a payer, wages are above the national middle; as a household, prices are third in Japan. The wage paid is in the upper group, but what that wage buys is in the lower half.
Some prefectures go the other way. Kagoshima is 44th nominal and 24th real: low prices cancel low wages.
"A low-wage prefecture" is not the same as "an easy place to live." Some prefectures move 16 to 20 places.
4-4 The lower the prefecture, the larger the raise
The correlation between the current level and the rate of increase is −0.889, so the policy direction is unambiguous.
The ratio narrows from 1.198 to 1.180. But it narrows slowly. At this rate, halving the gap would take a long time.
Meanwhile, the largest increases fall on the prefectures where wages were already lowest. Saga rises 65 yen. Those prefectures also have more establishments per head (minimum wage × establishments per 10,000 population, −0.537). The prefectures with the most small establishments face the largest increases.
4-5 What it means to put a trade in Kushiro
Commercial land in Kushiro City is 35,140 yen/m², 1/95 of Tokyo's. The minimum wage in Hokkaido is 1,075 yen, 0.88 of Tokyo's 1,226.
Ground rent at 1/95, labour at 0.88. That gap between the two is the shape of putting a trade in Kushiro.
The more a trade's costs are ground rent, the more it gains from being placed outside the cities. Where costs are mostly labour, moving out saves only 20%.
As X001 showed, the smaller a trade is per establishment, the more municipalities it is present in (r = −0.417). A trade that runs on few people is one for which the wage gap matters least.
That six of the eight municipalities have no commercial standard site is the other side of the same story. Transactions are too few for a land price to be produced at all.
5. Limitations
- The minimum wage figures are the FY2026 recommendation (effective around October 2026); "current" is FY2025. The four series are not aligned in time
- The consumer price regional difference index is for 2024, all items (including imputed rent). It is not published by municipality
- "Minimum wage divided by prices" is my own calculation, not an official indicator
- Taxable income is per taxpayer, not per resident
- Land prices are averages of commercial standard sites, weighted by the number of sites. Municipalities without a standard site are missing
- The minimum wage is set by prefecture, so differences within a prefecture are invisible
- The minimum wage is a floor, not the wage actually paid
- A correlation indicates the strength of a relationship, not the direction of causation
- Costs other than land and labour (inputs, utilities, freight) are not examined
6. How to reproduce
- Take the current level, recommended level and rank for each prefecture from the MHLW FY2026 regional minimum wage recommendations
- Take the all-items consumer price regional difference index for 2024 by prefecture (national = 100)
- Take taxable income per taxpayer by prefecture from the FY2025 Survey of Municipal Taxation
- From the commercial standard sites of the 2026 Land Price Publication, average by municipality and aggregate to prefectures weighted by the number of sites
- Compute minimum wage ÷ price index × 100
- Compute top-to-bottom ratios and correlations
Every figure in this paper is output by a single script (kensan_205). No intermediate value was copied by hand.
Scope of this paper
No new theory is claimed. Four official statistics — minimum wage, prices, income and land prices — are placed side by side for the 47 prefectures and compared. It shows that the size of the regional gap differs by orders of magnitude across items (1.081 to 87.4), that dividing by prices closes almost none of the wage gap, and that Hokkaido falls from 13th nominal to 29th real. Correlations are reported; the direction of causation is not.
References and data sources
- Ministry of Health, Labour and Welfare, FY2026 Regional Minimum Wage Recommendations
- Statistics Bureau of Japan, Retail Price Survey (Structural Survey), Consumer Price Regional Difference Index, 2024
- Ministry of Internal Affairs and Communications, Survey of Municipal Taxation, FY2025
- Ministry of Land, Infrastructure, Transport and Tourism, 2026 Land Price Publication (National Land Numerical Information)
- Ministry of Internal Affairs and Communications, Basic Resident Register population, 1 January 2026
- Yuuki Yamagishi, "What Population Leaves Unexplained, Income and Land Prices Do Not Explain Either" (R004). Zenodo. https://doi.org/10.5281/zenodo.22872530
- Yuuki Yamagishi, "How Many People Does a Trade Run On?" (X001)
Version history
| Version | Date | Contents |
|---|---|---|
| 1 | 2026-09-21 | First release |
How to cite
Yamagishi, Y. (2026). Wages Differ 1.20-fold, Prices 1.08-fold, Income 1.85-fold, Land 87.4-fold: Regional Gaps Differ by Orders of Magnitude Across Cost Items [X002]. Zenodo. https://doi.org/10.5281/zenodo.22877924
(This DOI is the concept DOI; it always resolves to the latest version. Cite this one.)
© 2026 Yuuki YAMAGISHI
This work is licensed under a Creative Commons Attribution 4.0 International License (CC BY 4.0).
You may copy, adapt, redistribute and use it commercially, provided you give appropriate credit.
creativecommons.org/licenses/by/4.0
All figures and values in this paper were computed from official statistics. Rights in the underlying data remain with the publishing agencies.
Reference
Yamagishi, Y. (2026). Wages Differ 1.20-fold, Prices 1.08-fold, Income 1.85-fold, Land 87.4-fold: Regional Gaps Differ by Orders of Magnitude Across Cost Items [X002]. Zenodo.
DOI: 10.5281/zenodo.22877924
YOI: https://www.yamagishiyuuki.com/yoi/X002
ORCID: 0009-0006-8587-3450
PDF (English) · PDF (Japanese) · Date proof of the English PDF (OpenTimestamps .ots) · SHA256SUMS
The record page for this paper (in Japanese, with the PDFs in each language and the date proof): YOI X002. This paper is a preprint and has not been peer reviewed.