Abstract
I fed the projected population published by the National Institute of Population and Social Security Research (2023 projection) into the equation obtained in R001 — subcategories present = 134.93 log₁₀(population) − 378.69, R² = 0.925 — to compute how many industrial subcategories each municipality would have in 2050.
Across the 1,876 municipalities covered, population falls from 124,902,873 in 2020 to 103,722,106 in 2050, −17.0%. The median municipal ratio of 2050 to 2020 is 0.664 (−33.6%), and 341 municipalities (18.2%) fall to half or below.
The change implied by the equation has a median of −24.0 subcategories. 1,453 municipalities (77.5%) lose ten or more, 1,097 (58.5%) twenty or more, 717 (38.2%) thirty or more and 361 (19.2%) forty or more. Only 104 (5.5%) gain.
Municipalities with fewer than 50 subcategories number 37 today and 179 in the projection — a 4.8-fold increase.
In the Kushiro Subprefecture all eight municipalities lose at least 30% of their population. Shiranuka falls to 0.39 and loses 55.2 subcategories (132 today, 77 projected); Teshikaga −43.0 and Akkeshi −42.0. The subprefecture as a whole falls to 0.58, with a median change of −33.7.
In Hokkaido, 35.6% of 188 municipalities fall to half or below, and the median change is −35.3 against the national −24.0.
This calculation assumes R001's equation still holds in 2050. Whether it does is unknown.
1. Introduction
R001 showed that the number of industrial subcategories present in a municipality is almost determined by the base-10 logarithm of its population (R² = 0.925). R002 found the population at which a subcategory appears, and R003 counted the subcategories of which a town has only one. All describe the present.
IPSS publishes projected populations for each municipality to 2050. Those populations can be put into R001's equation.
The arithmetic is simple. If population moves from P₀ to P₁,
Δ = 134.93 × log₁₀(P₁ / P₀)
Halving the population costs 40.6 subcategories; a 30% fall costs 20.9.
If the present relationship simply continues, how many trades leave a town by 2050?
2. Data and equation
| Projected population | IPSS, Regional Population Projections for Japan, 2023 projection, Result Table 1 (total population, 2020 to 2050 in five-year steps) |
| Subcategories today | 2021 Economic Census, establishments by industrial subcategory and municipality |
| Unit check | MIC, Basic Resident Register population, 1 January 2026 (unit A of R001) |
The projection has 1,951 rows: 47 prefectures, 20 designated cities, 198 wards, 769 cities, 916 towns and villages, and one row for the thirteen municipalities of Fukushima's Hamadōri area combined.
Of the wards, cities, towns and villages, 1,876 appear in both the Economic Census table and the Basic Resident Register (unit A). Those are the subject here.
The thirteen Fukushima municipalities are projected only as a combined area and are therefore excluded.
The equation is taken from R001 unchanged:
subcategories present = 134.93 log₁₀(population) − 378.69 (R² = 0.925, residual SD 25.6 subcategories, 1,889 municipalities)
3. Results
3-1 Population falls 17.0%
| 2020 (1,876 municipalities) | 124,902,873 |
| 2050 | 103,722,106 |
| Change | −17.0% (a fall of 21,180,767) |
Municipality by municipality, however, the fall is much larger.
| 2050 ÷ 2020 | |
|---|---|
| Median | 0.664 (−33.6%) |
| Largest fall | 0.252 |
| Largest rise | 1.247 |
| Falling to half or below | 341 (18.2%) |
| Rising | 104 (5.5%) |
The national total falls 17% while the municipal median falls 33.6%, because the larger municipalities fall by less.
3-2 The equation implies a median loss of 24
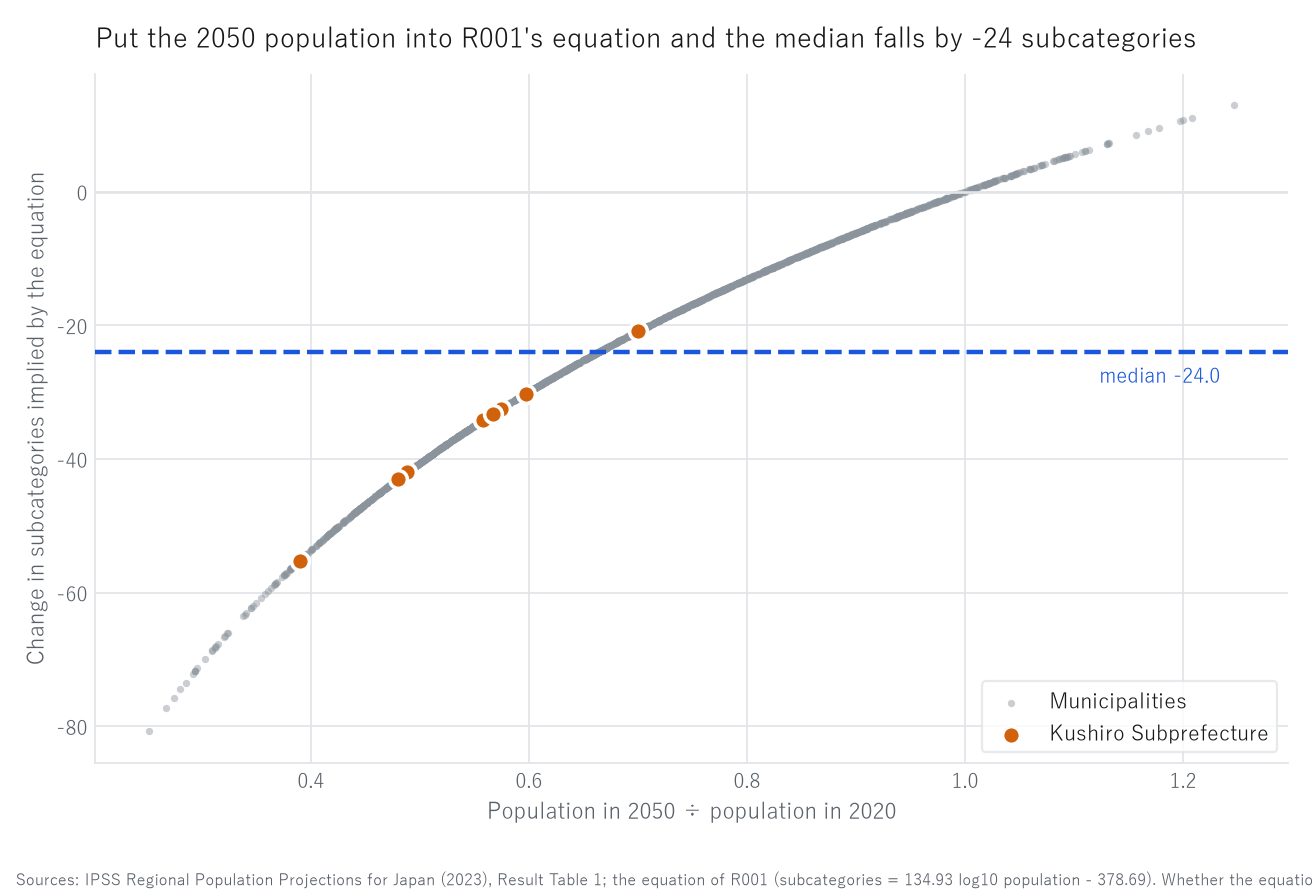
Figure 1. Population change and the change in subcategories implied by R001's equation (1,876 municipalities).
Grey points are municipalities, orange the eight of the Kushiro Subprefecture, and the dashed blue line the median.
| Change implied by the equation | |
|---|---|
| Median | −24.0 |
| Mean | −24.5 |
| Largest fall | −80.8 |
| Largest rise | +12.9 |
| Loss of | Municipalities | Share |
|---|---|---|
| 10 or more | 1,453 | 77.5% |
| 20 or more | 1,097 | 58.5% |
| 30 or more | 717 | 38.2% |
| 40 or more | 361 | 19.2% |
| (gaining) | 104 | 5.5% |
More than three-quarters of municipalities lose ten or more subcategories on this arithmetic.
| Largest falls | 2020 | 2050 | Ratio | Change | Today |
|---|---|---|---|---|---|
| Nanmoku, Gunma | 1,611 | 406 | 0.25 | −80.8 | 63 |
| Kuma, Kumamoto | 2,433 | 650 | 0.27 | −77.3 | 48 |
| Nosegawa, Nara | 357 | 98 | 0.27 | −75.8 | 27 |
| Utashinai, Hokkaido | 2,989 | 838 | 0.28 | −74.5 | 72 |
| Mitsue, Nara | 1,479 | 422 | 0.29 | −73.5 | 61 |
| Yubari, Hokkaido | 7,334 | 2,154 | 0.29 | −71.8 | 124 |
| Gains | 2020 | 2050 | Ratio | Change | Today |
|---|---|---|---|---|---|
| Chuo, Tokyo | 169,179 | 210,897 | 1.25 | +12.9 | 445 |
| Nagareyama, Chiba | 199,849 | 241,539 | 1.21 | +11.1 | 303 |
| Minato, Tokyo | 260,486 | 312,556 | 1.20 | +10.7 | 455 |
| Chiyoda, Tokyo | 66,680 | 79,828 | 1.20 | +10.5 | 446 |
| Nakagusuku, Okinawa | 22,157 | 26,102 | 1.18 | +9.6 | 173 |
Those losing are small towns with 27 to 124 subcategories today; those gaining are urban areas with 173 to 455. The movement widens the gap.
3-3 Municipalities below 50 subcategories rise 4.8-fold
Taking "subcategories today + change implied by the equation" as the 2050 figure (capped at 0 and 526):
| Today | Projected 2050 | |
|---|---|---|
| Median | 213 | 188 |
| Minimum | 16 | 0 |
| Maximum | 455 | 466 |
| Below 50 subcategories | 37 | 179 |
| Below 100 subcategories | 237 | 444 |
Thirty-seven municipalities are below 50 today; 179 are in the projection — 4.8 times as many.
R003 counted the trades of which a town has only one. Falling below 50 means fewer than a tenth of the 526 subcategories.
3-4 The Kushiro Subprefecture
| Municipality | 2020 | 2050 | Ratio | Change | Today | Projected |
|---|---|---|---|---|---|---|
| Kushiro City | 165,077 | 98,544 | 0.60 | −30.2 | 340 | 310 |
| Kushiro Town | 19,105 | 10,659 | 0.56 | −34.2 | 184 | 150 |
| Akkeshi | 8,892 | 4,343 | 0.49 | −42.0 | 161 | 119 |
| Hamanaka | 5,507 | 3,162 | 0.57 | −32.5 | 106 | 73 |
| Shibecha | 7,230 | 4,102 | 0.57 | −33.2 | 132 | 99 |
| Teshikaga | 6,955 | 3,337 | 0.48 | −43.0 | 142 | 99 |
| Tsurui | 2,558 | 1,791 | 0.70 | −20.9 | 72 | 51 |
| Shiranuka | 7,289 | 2,841 | 0.39 | −55.2 | 132 | 77 |
All eight lose at least 30% of their population. The subprefecture falls from 222,613 to 128,779, a ratio of 0.58, with a median change of −33.7 against the national −24.0.
Shiranuka's 0.39 is the most severe. Its population falls by three-fifths and the equation removes 55.2 subcategories, taking 132 to 77.
Kushiro City, at 0.60, loses 30.2. Even a city of 165,077 loses three-tenths of its subcategories on this arithmetic.
Tsurui falls least in the subprefecture at 0.70, but with only 72 subcategories today its projection is 51.
3-5 Hokkaido
| Wards, cities, towns and villages | 188 |
| 2020 | 5,224,614 |
| 2050 | 3,820,016 |
| Ratio | 0.73 |
| Median change | −35.3 (national −24.0) |
| Falling to half or below | 67 of 188 (35.6%) |
Nationally 18.2% fall to half or below; in Hokkaido 35.6% do — nearly twice as many.
4. Discussion
4-1 This is not a forecast
This paper assumes R001's equation still holds in 2050 and puts projected population into it. Nothing more.
There is no guarantee the assumption holds. The equation was fitted to 2021 establishments and January 2026 population. No reason has been given why that relationship should persist for thirty years.
If mail order expands, small towns can buy more without a local shop. If travel changes, so does the distance to the next town. The industrial classification itself is revised. None of this is in the equation.
What can be said is only: if the present relationship continues, this is what follows.
4-2 17% nationally, 33.6% in a town
The population total falls 17.0% while the municipal median falls 33.6%. The difference between those two numbers is the shape of the problem.
Larger municipalities fall by less and smaller ones by more, so watching the national total conceals what happens in towns.
It is the shape of I006, where "lodgings are increasing 2.74-fold nationally" concealed decline in nine prefectures. Averages and totals add together quantities pointing in opposite directions.
4-3 The movement widens the gap
The largest losses fall on small towns with 27 to 124 subcategories today; the gains go to urban areas with 173 to 455.
As R001 showed, the count is set by the logarithm of population. Because it is logarithmic, the same proportional fall removes the same number of subcategories everywhere — which bites far harder where there were few to begin with.
Nosegawa in Nara has 27 today. The equation removes 75.8, but it cannot fall below 27. In towns like that, the equation ceases to apply.
4-4 What can be done in the Kushiro Subprefecture now
The subprefecture's combined population falls to 0.58, and the equation removes a median of 33.7 subcategories.
That need not be read as fixed. The equation says only "if population moves like this, and the relationship stays as it has been, this follows." If the relationship can be changed, so can the result.
For instance:
- Trades with fewer workers per establishment reach more municipalities (X001, r = −0.417). A trade that can be made small can survive in a small place
- Distance selling is not tied to where the shop is (I014: the share is unrelated to population; Niigata leads and Tokyo is third from the bottom)
- Counts of licences are not counts of shops (I005, I011, I013). Describing a region by regulatory counts goes wrong
"Fewer people, fewer shops" is a description of the present relationship, not a law that cannot be moved.
5. Limitations
- R001's equation was fitted to 2021 establishments and January 2026 population. Whether it holds in 2050 is unknown. This paper shows only what applying the equation gives, and is not a forecast
- The projected population is the IPSS 2023 projection (based on the 2020 Census) and is a projection, not a forecast
- The thirteen Fukushima municipalities are projected only as a combined area and are excluded
- The implied change depends on the population ratio alone. Structural change in industry, mail order and changes in transport are not included
- The 2050 figure adds the implied change to today's count, capped at 0 and 526. In towns with few subcategories today, the implied fall exceeds the original count
- The count is of subcategories with at least one establishment; suppression follows the original table
- Where population rises the equation implies more subcategories, which need not follow
- The Census is 2021 and the population base years are 2020 and 2050: the dates are not aligned
6. Reproduction
- Obtain IPSS, Regional Population Projections for Japan, 2023 projection, Result Table 1. Total population runs from 2020 to 2050 in five-year steps (columns 4 to 10)
- Use only rows where "type of municipality" is 0 (ward), 2 (city) or 3 (town or village). Exclude a (prefecture), 1 (designated city) and 9 (Fukushima Hamadōri area)
- From the 2021 Economic Census, count per municipality the subcategories with at least one establishment
- Restrict to municipalities also present in the Basic Resident Register unit A (1,876)
- Compute Δ = 134.93 × log₁₀(2050 population ÷ 2020 population)
- Add Δ to today's count and cap at 0 and 526
All values are the output of a single script (kensan_204). No intermediate value was transcribed by hand. Municipal results are attached as kensan_204_2050.csv.
Scope of this paper
No new theory is claimed. This paper puts IPSS projected population into the equation obtained in R001 and computes the result. It assumes the equation holds in future, and that assumption is not tested. It is therefore not a forecast but a conditional calculation: "if the present relationship continues." Municipal results are attached as a CSV.
References and data sources
- National Institute of Population and Social Security Research, Regional Population Projections for Japan (2023 projection), Result Table 1.
- Statistics Bureau of Japan and METI, 2021 Economic Census for Business Activity.
- MIC, Population Based on the Basic Resident Register, 1 January 2026.
- Y. Yamagishi, "Population and the Number of Industrial Subcategories Present in Japanese Municipalities" (R001). Zenodo. https://doi.org/10.5281/zenodo.22872218
- Y. Yamagishi, "At What Population Does a Trade Appear?" (R002). Zenodo. https://doi.org/10.5281/zenodo.22872356
- Y. Yamagishi, "The Only One in Town" (R003). Zenodo. https://doi.org/10.5281/zenodo.22872474
- Y. Yamagishi, "How Many Workers per Establishment?" (X001). Zenodo. https://doi.org/10.5281/zenodo.22877856
Version history
| Version | Date | Change |
|---|---|---|
| 1 | 2026-09-21 | First release |
How to cite
Yamagishi, Y. (2026). How Many Trades Will Leave a Town by 2050? Feeding Projected Population into R001's Equation Gives a Median Loss of 24 Subcategories [R005]. Zenodo. https://doi.org/10.5281/zenodo.22877595
(This DOI is the concept DOI; it always resolves to the latest version. Cite this one.)
© 2026 Yuuki YAMAGISHI
This work is licensed under a Creative Commons Attribution 4.0 International License (CC BY 4.0).
You may copy, adapt, redistribute and use it commercially, provided you give appropriate credit.
creativecommons.org/licenses/by/4.0
All figures and values in this paper were computed from official statistics. Rights in the underlying data remain with the publishing agencies.
Reference
Yamagishi, Y. (2026). How Many Trades Will Leave a Town by 2050? Feeding Projected Population into R001's Equation Gives a Median Loss of 24 Subcategories [R005]. Zenodo.
DOI: 10.5281/zenodo.22877595
YOI: https://www.yamagishiyuuki.com/yoi/R005
ORCID: 0009-0006-8587-3450
PDF (English) · PDF (Japanese) · Date proof of the English PDF (OpenTimestamps .ots) · SHA256SUMS
The record page for this paper (in Japanese, with the PDFs in each language and the date proof): YOI R005. This paper is a preprint and has not been peer reviewed.