Abstract
This paper asks what moves and what does not when the take profit and stop loss are changed — the answer is that only the win rate moves. It claims neither a new mathematical theorem nor a new law.
First, the take profit and stop loss were each placed at 5, 8, 12, 20, 30, 50 and 80 pips, forty-nine ways in all. The win rate moves by 93.6019 points across the 196 cells. The ranges by instrument are 88.2539, 92.6331, 90.4581 and 87.9601 points (Section 3).
Second, the measured win rate agrees with the prediction of the optional stopping theorem — the stop width less the spread, divided by the sum of the two widths — with a correlation of +0.996371. The median of measurement minus prediction is −0.0760 points, with a median absolute value of 0.9429 points (Section 4).
Third, and this is the core of the paper, over the same forty-nine cells the average of the buy and the sell does not leave the spread. The median absolute value of that average plus the spread is 0.1419 pips, and the medians by instrument are −0.0227, −0.0193, −0.0358 and −0.0649 pips (Section 5).
Fourth, the correlation between the win rate and that average is −0.068867. The win rate moves ninety points and the expectation does not follow (Section 5).
Fifth, the difference between buy and sell (the directional information) behaves differently by instrument. The medians are +0.6715, −0.0392, −0.0193 and +0.3460 pips, and only USDJPY exceeds the spread, in 27 of 49 cells. That may be a restatement of which way that instrument moved over this period. This paper does not separate the drift (Section 6).
Sixth, repeating the measurement on synthetic series built from independent normal increments down to the movement inside each bar, the median difference in win rate is +0.6392 points and the median difference in expectation plus spread is −0.0907 pips. A synthetic random walk is a fair game by construction, and so is the side on which the prediction holds exactly (Section 7).
Scope of this paper (scope note): No new mathematical theorem and no new law is claimed — the optional stopping theorem is known, and this paper only confirms it by measurement. No particular product or proponent is discussed — no real course, author, or vendor is the subject here, and none is named. What is treated is the public turn of phrase itself. Trading is not discussed — what is measured is profit and loss net of the spread, not trading performance including commissions, slippage, rejected fills and money management. The scope is intraday and a small number of instruments — four series, three years, five-minute bars, holding at most 24 hours. Monthly time-series momentum (dozens of markets, holding one to twelve months) is documented in the literature, and this paper does not contradict it. Judgement is made on bar highs and lows — when both barriers fall inside one bar, the adverse one is counted first (conservative). Section 6 reports that share. The drift is not separated — the difference between buy and sell includes which way price moved over the period (Sections 6 and 8). No forecast is claimed. Relation to earlier papers: Paper 423 showed that a probability can be right while only the multiplication is wrong. F009 measured the gap between one-sided and two-sided barriers — this paper moves that two-sided side forty-nine ways. What is added here is writing the prediction before measuring, putting the win rate and the expectation on the same table, and using a synthetic random walk, which is a fair game, as the control on the prediction's side.
1. Notation and the question — writing the prediction first
There is a way of speaking that says "cut losses short and let profits run" and "move the take profit closer to raise the win rate". Both assume that where the two levels are placed changes the result.
A buy is opened at the ask and closed at the bid, so the profit starts a spread s below zero. From there a take profit TP is placed above and a stop loss SL below. If price is a fair game — a process about which the present information says nothing regarding the next move — the optional stopping theorem gives the following.
| Quantity | Prediction | What it contains |
|---|---|---|
| Win rate | (SL − s) ÷ (TP + SL) | TP, SL and s, all of them |
| Expectation | win rate × TP − (1 − win rate) × SL = −s | only s. TP and SL both vanish |
Observation 1.1: TP and SL both appear in the win rate and both vanish from the expectation. The TP + SL in the denominator folds against the TP won.
Observation 1.2: the prediction is therefore this. Moving the take profit and the stop loss moves the win rate a great deal and leaves the expectation at the spread.
Observation 1.3: this prediction can be written before measuring. This paper wrote it and then measured. In the other order, any result can be read as "as predicted".
Question: when the take profit and stop loss are changed, what moves and what does not?
2. Writing the quantity and the design in advance
Design (declared before running and unchanged at run time)
| Item | Decision |
|---|---|
| Lattice | five-minute bars, mid price, completed bars only |
| Entries | every 12 bars (that is, hourly). Buys and sells are run separately |
| Barriers | take profit and stop loss each at 5, 8, 12, 20, 30, 50, 80 pips → 49 cells |
| Accounting | buy profit = change in mid − s; sell profit = −(change in mid) − s. s is the measured spread on the entry bar |
| Time limit | 288 bars (24 hours); unresolved positions are closed at the mid then |
| Both in one bar | when both barriers fall inside one bar, the adverse one (the stop) is counted first |
| M | (buy expectation + sell expectation) ÷ 2. The directional effect cancels |
| D | (buy expectation − sell expectation) ÷ 2. The directional information |
| Instruments | USDJPY, EURUSD, GBPUSD, XAUUSD |
| Period | 2019–2024. Evaluation 2022–2024 |
Observation 2.1: how the both-in-one-bar case is handled skews the result one way. Counting the adverse side first makes the measured win rate come out below the prediction. Section 6 reports that share.
Observation 2.2: the directional effect cancels in M, so M should be −s whichever way price moved over the period. D, by contrast, picks up which way price moved. What can be used to check the prediction about the expectation is M, not the buy side alone.
Observation 2.3: positions that reach the time limit are closed at the mid. In cells where that happens often, the win rate becomes "the win rate among those that resolved", so the population changes. Section 6 reports the time-limit share.
The entry counts are 17,834 for USDJPY, 17,860 for EURUSD, 17,841 for GBPUSD and 17,460 for XAUUSD, with median spreads of 0.6000, 0.3000, 0.9000 and 3.5400 pips.
3. The win rate moves a great deal
Calculation 3.1 Win rate among resolved positions (USDJPY, buy, evaluation period, %)
| TP \ SL | 5 | 8 | 12 | 20 | 30 | 50 | 80 |
|---|---|---|---|---|---|---|---|
| 5 | 41.2751 | 54.5138 | 64.9378 | 76.4303 | 83.1265 | 89.5759 | 93.6108 |
| 8 | 32.7689 | 45.1385 | 55.8035 | 68.4701 | 76.5282 | 85.1372 | 90.8071 |
| 12 | 25.5916 | 36.6715 | 47.2063 | 60.6045 | 69.9401 | 80.2972 | 87.4470 |
| 20 | 17.9575 | 26.9738 | 36.0663 | 49.4233 | 59.5224 | 72.0691 | 81.6241 |
| 30 | 13.3322 | 20.6546 | 28.2603 | 40.4244 | 50.4904 | 63.7405 | 75.2383 |
| 50 | 8.7519 | 14.0142 | 19.5750 | 28.9864 | 37.9180 | 51.0343 | 64.2753 |
| 80 | 5.3569 | 8.6572 | 12.3791 | 18.7540 | 25.4326 | 36.3217 | 49.7702 |
Calculation 3.2 Range of the win rate by instrument
| Instrument | Minimum | Maximum | Range (points) |
|---|---|---|---|
| USDJPY | 5.3569% | 93.6108% | 88.2539 |
| EURUSD | 3.0768% | 95.7099% | 92.6331 |
| GBPUSD | 3.3961% | 93.8542% | 90.4581 |
| XAUUSD | 2.1080% | 90.0682% | 87.9601 |
Observation 3.3: the win rate moves by 93.6019 points across the 196 cells — from 2.1080% in the lowest cell (take profit 80, stop 5) to 95.7099% in the highest (take profit 5, stop 80).
Observation 3.4: the table changes smoothly from top left to bottom right. Bringing the take profit closer and the stop further raises the win rate, and the reverse lowers it. So far this matches what is commonly said.
Observation 3.5: shown only the figure 93.6108%, a method looks good. Inside it is "take profit 5 pips, stop loss 80 pips" — sixteen wins are undone by one loss.
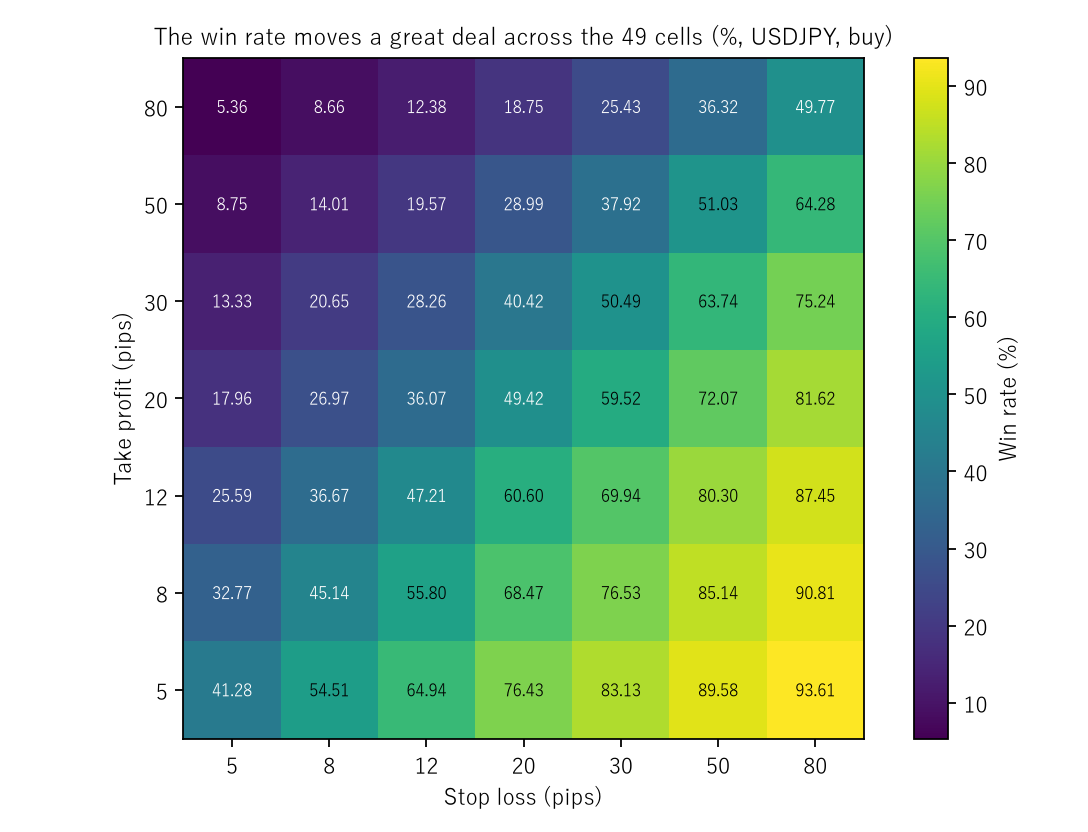
Figure 1: stop loss across, take profit up (pips). The colour changes continuously from top left to bottom right.
4. The measured win rate agrees with the prediction
Calculation 4.1 Cells along the diagonal (evaluation period, %)
| Instrument | TP | SL | Measured buy | Measured sell | Prediction | Buy − prediction | Sell − prediction |
|---|---|---|---|---|---|---|---|
| GBPUSD | 5 | 80 | 93.8542% | 94.5050% | 92.7568% | +1.0974 | +1.7483 |
| GBPUSD | 8 | 50 | 84.0030% | 84.6903% | 84.2125% | −0.2096 | +0.4777 |
| GBPUSD | 12 | 30 | 68.8299% | 67.7669% | 68.6744% | +0.1555 | −0.9076 |
| GBPUSD | 20 | 20 | 47.6150% | 46.2292% | 47.1081% | +0.5069 | −0.8790 |
| GBPUSD | 30 | 12 | 26.0441% | 25.7868% | 25.8173% | +0.2268 | −0.0304 |
| GBPUSD | 50 | 8 | 11.3011% | 12.0116% | 11.7987% | −0.4976 | +0.2129 |
| GBPUSD | 80 | 5 | 3.3961% | 3.7588% | 4.5215% | −1.1254 | −0.7627 |
| XAUUSD | 5 | 80 | 90.0682% | 89.0703% | 89.7981% | +0.2700 | −0.7278 |
| XAUUSD | 8 | 50 | 80.5785% | 78.9347% | 79.8766% | +0.7019 | −0.9418 |
| XAUUSD | 12 | 30 | 63.6598% | 61.1226% | 62.6867% | +0.9731 | −1.5641 |
| XAUUSD | 20 | 20 | 41.9588% | 39.1924% | 40.8210% | +1.1378 | −1.6286 |
| XAUUSD | 30 | 12 | 20.8076% | 19.4845% | 19.8295% | +0.9780 | −0.3450 |
| XAUUSD | 50 | 8 | 8.1100% | 7.3196% | 7.4628% | +0.6472 | −0.1432 |
| XAUUSD | 80 | 5 | 2.1080% | 1.8615% | 1.5628% | +0.5452 | +0.2987 |
Observation 4.2: the correlation between the measured win rate and the prediction is +0.996371 (196 cells, buy side).
Observation 4.3: the median of measurement minus prediction is −0.0760 points, with a median absolute value of 0.9429 points. The range runs from −11.5331 to +11.1529 points, which is not small.
Observation 4.4: the large departures are in cells with many time-limit exits or many both-in-one-bar cases. The prediction assumes that one barrier is eventually reached; the measurement cuts off at 24 hours. It departs by as much as the assumptions differ. Section 6 reports both shares.
Observation 4.5: a correlation of 0.996 is not enough to write "they agree". The prediction changes monotonically in TP and SL, and correlations between monotone quantities come out high. What to read is not the correlation but how the size of the departure compares with the spread.
5. The expectation does not move — this is the separator
Calculation 5.1 The average of buy and sell, M (USDJPY, evaluation period, pips)
| TP \ SL | 5 | 8 | 12 | 20 | 30 | 50 | 80 |
|---|---|---|---|---|---|---|---|
| 5 | −0.8997 | −0.9671 | −1.0368 | −1.1012 | −1.2276 | −1.4012 | −1.7035 |
| 8 | −0.8097 | −0.8770 | −0.9699 | −1.0721 | −1.3245 | −1.5910 | −2.0236 |
| 12 | −0.7371 | −0.8199 | −0.8955 | −0.9973 | −1.2732 | −1.6022 | −2.2454 |
| 20 | −0.6824 | −0.7245 | −0.7877 | −0.8748 | −1.2568 | −1.5655 | −2.3460 |
| 30 | −0.5946 | −0.5553 | −0.6196 | −0.6241 | −1.0388 | −1.5052 | −2.3596 |
| 50 | −0.4447 | −0.2577 | −0.2403 | −0.2173 | −0.5043 | −0.9495 | −1.7479 |
| 80 | −0.1596 | 0.1903 | 0.4158 | 0.6354 | 0.4772 | −0.0429 | −0.8819 |
Calculation 5.2 M by instrument, and M with the spread added back
| Instrument | Median spread | Range of M | Median of M + s | Range of M + s |
|---|---|---|---|---|
| USDJPY | 0.6000 | −2.3596 to 0.6354 | −0.0227 | −1.4869 to +1.5081 |
| EURUSD | 0.3000 | −0.9693 to 0.0329 | −0.0193 | −0.5069 to +0.4953 |
| GBPUSD | 0.9000 | −1.4411 to −0.9228 | −0.0358 | −0.2844 to +0.2339 |
| XAUUSD | 3.5400 | −4.3558 to −3.3098 | −0.0649 | −0.6842 to +0.3618 |
Observation 5.3: the median absolute value of M plus the spread is 0.1419 pips over the 196 cells. The medians by instrument are −0.0227, −0.0193, −0.0358 and −0.0649 pips — all four sit near zero.
Observation 5.4: the correlation between the win rate and M is −0.068867. The win rate moves 93.6019 points and the expectation does not follow.
Observation 5.5: for GBPUSD, M never leaves the band from −1.4411 to −0.9228 pips, against a spread of 0.9000 pips. Not one of the 49 placements takes it outside that band.
Observation 5.6: for USDJPY and EURUSD, M becomes shallower in the cells with a distant take profit (the lower rows), and USDJPY at take profit 80 with stop 20 reaches +0.6354 pips. But that is inside the ±1.5 pip range of M + s (Calculation 5.2). One cell must not be picked out and read as "this cell wins".
Observation 5.7: ★ placing the take profit and stop loss is therefore an operation that trades the win rate against the reward-to-risk ratio. The product of what is traded — the expectation — is not part of the trade.
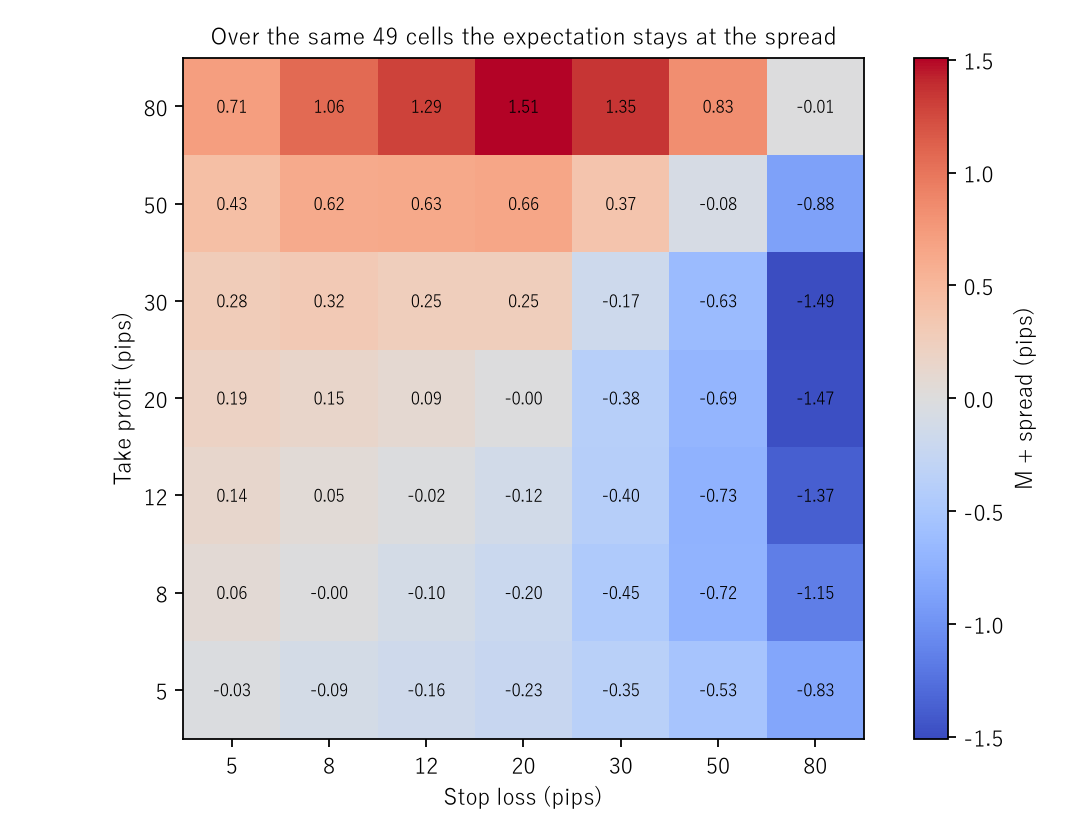
Figure 2: stop loss across, take profit up (pips), with M plus the spread as the value. The colour stays near zero (white) over the whole face.
6. The directional D, and the share where the assumptions break
Calculation 6.1 Directional information, and where the judgement's assumptions break (evaluation period)
| Instrument | Median D | Range of D | Cells where the absolute value exceeds the spread | Range of the time-limit share | Both in one bar |
|---|---|---|---|---|---|
| USDJPY | 0.6715 | +0.0272 to +4.7083 | 27 / 49 | 0.00% to 42.65% | 0.04% to 3.08% |
| EURUSD | −0.0392 | −1.0773 to +0.0874 | 13 / 49 | 0.00% to 74.34% | 0.00% to 0.77% |
| GBPUSD | −0.0193 | −1.4390 to +0.3124 | 4 / 49 | 0.00% to 59.17% | 0.00% to 1.47% |
| XAUUSD | 0.3460 | +0.0017 to +3.3007 | 0 / 49 | 0.00% to 4.08% | 0.06% to 17.33% |
Observation 6.2: the median D is +0.0884 pips over the 196 cells, with a median absolute value of 0.2271 pips.
Observation 6.3: USDJPY alone is different. Its median D is +0.6715 pips and it exceeds the spread in 27 of 49 cells. This must not be read as "USDJPY has a buy edge". D picks up which way price moved over the period, and this is the realised value over one window of three years. The drift is not separated here.
Observation 6.4: M, by contrast, cancels between buy and sell and so contains no drift. The design reason for using M to check the prediction shows up here as a number.
Observation 6.5: the time-limit share runs from 0.00% to 74.34%. In cells where both barriers are distant, three positions in four do not resolve within 24 hours. That cell's "win rate" is a statement about the remaining quarter.
Observation 6.6: the share with both barriers inside one bar stays below 1.47% in currencies but reaches 17.33% in XAUUSD. Gold moves enough inside a five-minute bar that judging on bar highs and lows becomes coarse. This is a limitation in Section 8.
7. The baseline — a random walk is the side on which the prediction holds exactly
Calculation 7.1 Synthetic series whose within-bar movement is also random (5 realisations, evaluation period)
| Instrument | TP | SL | Measured win rate | Random walk | Prediction | Measured M+s | Random walk M+s |
|---|---|---|---|---|---|---|---|
| USDJPY | 5 | 80 | 93.6108% | 92.7428% | 93.0909% | −0.8308 | −0.4381 |
| USDJPY | 20 | 20 | 49.4233% | 47.8087% | 47.8182% | −0.0021 | 0.0442 |
| USDJPY | 80 | 5 | 5.3569% | 5.1801% | 4.8556% | 0.7132 | 0.5498 |
| EURUSD | 5 | 80 | 95.7099% | 95.0605% | 93.5737% | −0.1181 | −0.3394 |
| EURUSD | 20 | 20 | 48.4763% | 48.5545% | 48.8440% | −0.0863 | 0.0118 |
| EURUSD | 80 | 5 | 3.0768% | 4.0477% | 5.3384% | 0.1265 | 0.3963 |
| GBPUSD | 5 | 80 | 93.8542% | 92.3565% | 92.7568% | −0.1517 | −0.4722 |
| GBPUSD | 20 | 20 | 47.6150% | 46.9301% | 47.1081% | −0.0694 | 0.0140 |
| GBPUSD | 80 | 5 | 3.3961% | 4.8475% | 4.5215% | 0.1701 | 0.5732 |
| XAUUSD | 5 | 80 | 90.0682% | 88.6140% | 89.7981% | −0.1974 | −0.9647 |
| XAUUSD | 20 | 20 | 41.9588% | 41.3299% | 40.8210% | −0.0982 | 0.2221 |
| XAUUSD | 80 | 5 | 2.1080% | 3.2875% | 1.5628% | 0.3618 | 1.4188 |
Observation 7.2: the median difference in win rate (measurement minus random walk) is +0.6392 points. A synthetic random walk is a fair game by construction, and so is the side on which the prediction holds exactly.
Observation 7.3: the median difference in expectation plus spread is −0.0907 pips. Both the random walk and the measurement sit near zero in the same way.
Observation 7.4: even on the random walk, M + s scatters from −0.9647 to +1.4188 pips. That range appears in a series known to be a fair game. ★ A measured value inside that range must not be read as an effect.
8. Limitations
- ★ Judgement is made on bar highs and lows. When both barriers fall inside one bar, the adverse one is counted first. The share stays below 1.47% in currencies but reaches 17.33% in XAUUSD. Judging tick by tick would remove the ambiguity; this paper does not go that far.
- The time limit is fixed at 24 hours. In some cells the time-limit share reaches 74.34%, and the "win rate" there is a statement about the resolved ones only. A longer limit should agree better with the prediction, but that was not measured.
- ★ The drift is not separated. The difference D between buy and sell includes which way price moved over the period. The large D for USDJPY is not claimed here as an edge.
- Entries are fixed at hourly. With a maximum hold of 24 hours, observations overlap. The subject of this paper (that M does not leave −s) is a statement about means and is unaffected, but significance would require removing the overlap. No t value is reported here.
- Commissions, slippage and rejected fills are not included. Only the measured spread is deducted. All of them push the expectation further down.
- The synthetic baseline uses independent normal increments. Volatility clustering is not included.
- Four instruments over three years. Nothing is said about other markets or other periods.
Conclusion
Placed forty-nine ways, the win rate runs from 2.1080% to 95.7099% — a span of 93.6019 points. The table changes smoothly from top left to bottom right, and both "cut losses short" and "a high win rate" can be manufactured by the placement alone.
The measured win rate agreed with the prediction of the optional stopping theorem with a correlation of +0.996371. The prediction was written before measuring.
But over the same forty-nine cells, the average of the buy and the sell did not leave the spread. The median absolute value of that average plus the spread is 0.1419 pips, and its correlation with the win rate is −0.068867.
Placing the take profit and the stop loss trades the win rate against the reward-to-risk ratio. The product of what is traded is not part of the trade.
And what this paper could measure stops at profit net of the spread. Commissions and slippage are not included, so real trading starts below this.
Data and reproduction
| Data | Currency ticks from Dukascopy (agreement to the millisecond, bid and ask, verified from 2019 onward). Gold from Dukascopy |
| Period | 2019–2024 (six years). Evaluation 2022–2024 |
| Instruments | USDJPY, EURUSD, GBPUSD, XAUUSD |
| Bars | Five-minute, mid price, completed bars only. Bars with no ticks are not created |
| Entries | Every 12 bars (hourly). Buys and sells are run separately |
| Time limit | 288 bars (24 hours) |
| Verification | 検算/F012.py (with --zu it also writes the figures). Every number in the text is taken from 検算/F012_output.txt |
| Figures | 図/F012_zu1, 図/F012_zu2 (png, svg, English versions) |
| Random seeds | Fixed at 0–4. Re-running gives the same values |
| Audit of the foundation | _ツール/audit_bars.py (look-ahead in the bars, daylight saving, the day boundary). The record is _土台の検査.txt |
References
- Yamagishi, Y. (2026). The Table Is Right and the Trade Still Loses [Paper 423]. Zenodo. 10.5281/zenodo.22700114
- Yamagishi, Y. (2026). The Probability of Touching a Pivot Level Is a Restatement of the Distance to It [F009]. Zenodo. 10.5281/zenodo.22881708
Reference
Yamagishi, Y. (2026). Placing the Take Profit and Stop Loss Forty-Nine Ways Does Not Move the Expectation [F012]. Zenodo.
DOI: 10.5281/zenodo.22891608
YOI: https://www.yamagishiyuuki.com/yoi/F012
ORCID: 0009-0006-8587-3450
PDF (English) · PDF (Japanese) · Date proof of the English PDF (OpenTimestamps .ots) · SHA256SUMS
The record page for this paper (in Japanese, with the PDFs in each language and the date proof): YOI F012. This paper is a preprint and has not been peer reviewed.