Abstract
This paper asks whether a "plateau" produced by sweeping a threshold is evidence of a plateau — the answer is that it is not. It claims neither a new mathematical theorem nor a new law.
First, sweeping the condition "the size of the last move is T or above" over 20 steps, the median overlap between adjacent cells (shared observations ÷ union) is 0.8997. The range runs from 0.1606 to 0.9524, larger at the lower steps (Section 3).
Second, recutting the same thresholds into exclusive bins (T or above, below T') makes the adjacent overlap 0.0000 by definition. The data, the signal and the thresholds are the same; only the cut was changed (Section 3).
Third, and this is the core of the paper, on a synthetic series known to carry no directional information, the nested sweep gives an adjacent-cell correlation of 0.5096. Recut into exclusive bins it is −0.0381. The smoothness is made by the nesting, not by an edge (Section 5).
Fourth, the plateau measure (the share of the best cell's left and right neighbours that fall in the top half) is 0.6875 nested and 0.6125 exclusive on the synthetic series. The gap is small, and even the exclusive version exceeds the 0.5 of chance. ★ This paper does not use that measure as its decisive one (Section 5).
Fifth, in the measurement the median adjacent-cell correlation is 0.3121 nested and −0.0135 exclusive. The per-instrument values scatter from −0.5391 to 0.7751, so four series are not enough precision for the correlation itself (Section 4).
Sixth, the directional information of the sweep's best cell has a median of 0.4061 pips, against a median spread of 0.7500 pips. Even the best cell does not reach the cost (Section 6).
Scope of this paper (scope note): No new mathematical theorem and no new law is claimed — that nested sets induce correlation, and that the best value of a sweep can be a product of selection, are both known. No particular product or proponent is discussed — no real course, author, or vendor is the subject here, and none is named. What is treated is the public practice itself. Trading is not discussed — what is measured is counts and directional information, not trading performance including commissions, fills and money management. The scope is intraday and a small number of instruments — four series, three years, five-minute bars. Monthly time-series momentum (dozens of markets, holding one to twelve months) is documented in the literature, and this paper does not contradict it. One swept quantity is fixed — the size of the last move, over 20 steps. Another quantity or another number of steps gives other figures (Section 7). Only one plateau measure was tried — whether the best cell's left and right neighbours fall in the top half. That measure exceeds chance even on the synthetic series and even in the exclusive version, so this paper does not use it as decisive (Section 5). No forecast is claimed. Relation to earlier papers: this series always reports, alongside a rate or a correlation, what it would be by chance. F010 showed that adding conditions only removes count — this paper shows that a face produced by a sweep is not evidence of a face. What is added here is counting the adjacent overlap, recutting the same thresholds as exclusive bins for comparison, and placing a series known to carry no edge as the control.
1. Notation and the question
When a sweep over parameters turns up a good cell, it is sometimes read this way.
| Reading | The claim |
|---|---|
| A point is risky | if only one cell is good, it may be chance |
| A face is safe | if the neighbours are good too, it is a plateau, not chance |
| What this paper asks | how much of that "neighbour" is different observations |
Observation 1.1: the condition "T or above" is nested. The observations in a cell with a slightly higher T are entirely contained in those of a cell with a lower one.
Observation 1.2: so a neighbouring cell returning a similar value is what must happen. The same observations are being looked at again; it would be strange if they were not similar.
Observation 1.3: the question settles by placing two things alongside. One is exclusive bins — recut as "T or above, below T'", the adjacent overlap becomes 0. The other is a synthetic random walk — sweep the same way on a series known to carry no directional information.
Question: is a face produced by sweeping a threshold evidence of a face?
2. Writing the quantity and the design in advance
Design (declared before running and unchanged at run time)
| Item | Decision |
|---|---|
| Lattice | five-minute bars, mid price, completed bars only |
| Horizon | h = 12 (that is, one hour) |
| Signal | the sign of the last bar's move (with the trend). ★ It carries a sign, so directional information can be measured |
| Swept quantity | the size of the last bar's move |
| Steps | 20 steps of its quantile, from 0.50 to 0.995 |
| Nested | size at or above T |
| Exclusive | size at or above T and below T' |
| Overlap | shared observations ÷ union of observations, for adjacent cells |
| Adjacent correlation | the correlation between neighbouring values along the sweep |
| Plateau measure | the share of the best cell's left and right neighbours that fall in the top half |
| Baseline | synthetic series random down to the movement inside each bar (20 realisations) |
| Instruments | USDJPY, EURUSD, GBPUSD, XAUUSD |
| Period | 2019–2024. Evaluation 2022–2024 |
Observation 2.1: the swept quantity (a size) is symmetric up and down, so it carries no direction itself. The direction is carried by the signal (the last bar's sign). Without that separation the sweep is not a test of direction.
Observation 2.2: the synthetic series has zero directional information by construction. That is what makes "does a plateau appear anyway" answerable. As a control, nothing is better.
Observation 2.3: the thresholds are identical between nested and exclusive. Only the cut was changed; the data, the signal and the period are the same.
In the evaluation period the bar counts are 214,291 for USDJPY, 214,605 for EURUSD, 214,370 for GBPUSD and 209,799 for XAUUSD; the first step of the sweep holds 106,594, 106,352, 107,473 and 104,692 observations, and the twentieth holds 1,063, 1,064, 1,060 and 1,047.
3. With nested cells, a neighbour is almost the same observations
Calculation 3.1 Overlap of adjacent cells (evaluation period)
| Instrument | Nested, median overlap | Nested, range | Exclusive, median overlap |
|---|---|---|---|
| USDJPY | 0.9007 | 0.1606 to 0.9509 | 0.0000 |
| EURUSD | 0.8921 | 0.1620 to 0.9493 | 0.0000 |
| GBPUSD | 0.8988 | 0.1607 to 0.9524 | 0.0000 |
| XAUUSD | 0.9019 | 0.1610 to 0.9494 | 0.0000 |
Observation 3.2: the nested adjacent overlap has a median of 0.8997. The range runs from 0.1606 to 0.9524, and is larger at the lower steps (with many observations, one step up removes a smaller share).
Observation 3.3: the exclusive overlap is 0.0000. That follows from the definition. With the same thresholds, changing only the cut takes 0.8997 to 0.0000.
Observation 3.4: an overlap of 0.9 means that nine of every ten observations in a neighbouring cell are the same ones. The two cells are measuring almost the same thing.
Observation 3.5: ★ so "the neighbour was good too" is almost the observation that the same thing was measured again. It is not a second, independent piece of evidence.
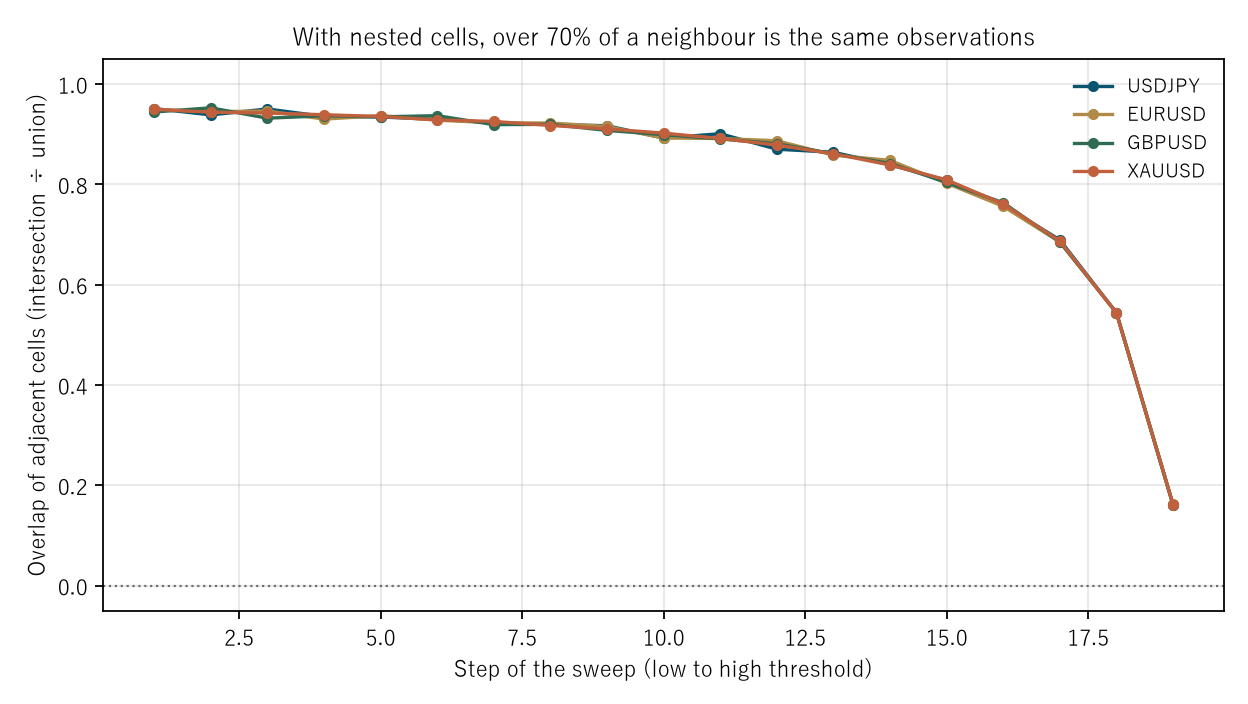
Figure 2: step of the sweep across, adjacent overlap up. Near 0.95 at the low steps, and never below 0.16 to the end.
4. How the sweep's curve changes between nested and exclusive
Calculation 4.1 The sweep (evaluation period, every second step)
| Instrument | Step | Threshold (pips) | Nested count | Nested D | Exclusive count | Exclusive D |
|---|---|---|---|---|---|---|
| USDJPY | 1 | 2.1500 | 106,594 | −0.1054 | 5,236 | 0.1292 |
| USDJPY | 3 | 2.5000 | 95,094 | −0.1024 | 4,751 | −0.0615 |
| USDJPY | 5 | 2.8500 | 84,490 | −0.1139 | 5,572 | −0.0148 |
| USDJPY | 7 | 3.3000 | 73,344 | −0.1420 | 5,656 | −0.1028 |
| USDJPY | 9 | 3.8000 | 62,217 | −0.1304 | 5,187 | −0.2151 |
| USDJPY | 11 | 4.4500 | 50,876 | −0.1163 | 5,052 | 0.3929 |
| USDJPY | 13 | 5.2500 | 39,860 | −0.1605 | 5,433 | −0.4354 |
| USDJPY | 15 | 6.3500 | 28,877 | −0.1024 | 5,553 | −0.2188 |
| USDJPY | 17 | 8.1000 | 17,680 | −0.0700 | 5,496 | 0.0833 |
| USDJPY | 19 | 12.1500 | 6,620 | 0.0859 | 5,557 | 0.0456 |
| XAUUSD | 1 | 4.7150 | 104,692 | 0.0594 | 5,301 | 0.1209 |
| XAUUSD | 3 | 5.4300 | 93,788 | 0.0713 | 5,445 | −0.3091 |
| XAUUSD | 5 | 6.2000 | 82,916 | 0.1069 | 5,383 | 0.5559 |
| XAUUSD | 7 | 7.1200 | 71,965 | 0.0042 | 5,381 | 1.1451 |
| XAUUSD | 9 | 8.2000 | 61,064 | −0.0550 | 5,469 | 0.2805 |
| XAUUSD | 11 | 9.5250 | 50,139 | −0.0849 | 5,450 | 1.2076 |
| XAUUSD | 13 | 11.1850 | 39,242 | −0.2658 | 5,463 | 0.5756 |
| XAUUSD | 15 | 13.4950 | 28,322 | −0.2228 | 5,416 | −0.5909 |
| XAUUSD | 17 | 17.1500 | 17,425 | 0.0981 | 5,456 | 0.0605 |
| XAUUSD | 19 | 25.7000 | 6,503 | 0.9655 | 5,456 | 1.0942 |
Calculation 4.2 Adjacent correlation and the span of the sweep
| Instrument | Nested, adjacent correlation | Exclusive, adjacent correlation | Nested, span of D | Exclusive, span of D |
|---|---|---|---|---|
| USDJPY | 0.7751 | −0.0643 | −0.172 to +0.297 | −0.435 to +0.393 |
| EURUSD | −0.5391 | −0.5130 | −0.433 to +0.516 | −0.617 to +0.516 |
| GBPUSD | 0.0918 | 0.0373 | −0.886 to −0.134 | −0.886 to +0.259 |
| XAUUSD | 0.5323 | 0.0476 | −0.402 to +0.965 | −1.332 to +1.208 |
Observation 4.3: the nested count falls from 106,594 to 6,620 while the exclusive count stays near 5,236. Because the cuts are quantiles, each exclusive step holds about the same number.
Observation 4.4: the nested D stays in a band (−0.172 to +0.297 for USDJPY) while the exclusive D scatters more over the same steps (−0.435 to +0.393). The nested version looks "cleaner" because it keeps re-averaging.
Observation 4.5: the median adjacent correlation is 0.3121 nested and −0.0135 exclusive. But the per-instrument values scatter from −0.5391 to 0.7751. Four series are not enough precision for the correlation itself.
Observation 4.6: that is exactly why the synthetic series of the next section is needed. In the measurement, "smooth because nested" cannot be told from "smooth because the market has structure". On a series known to have zero directional information, it can.
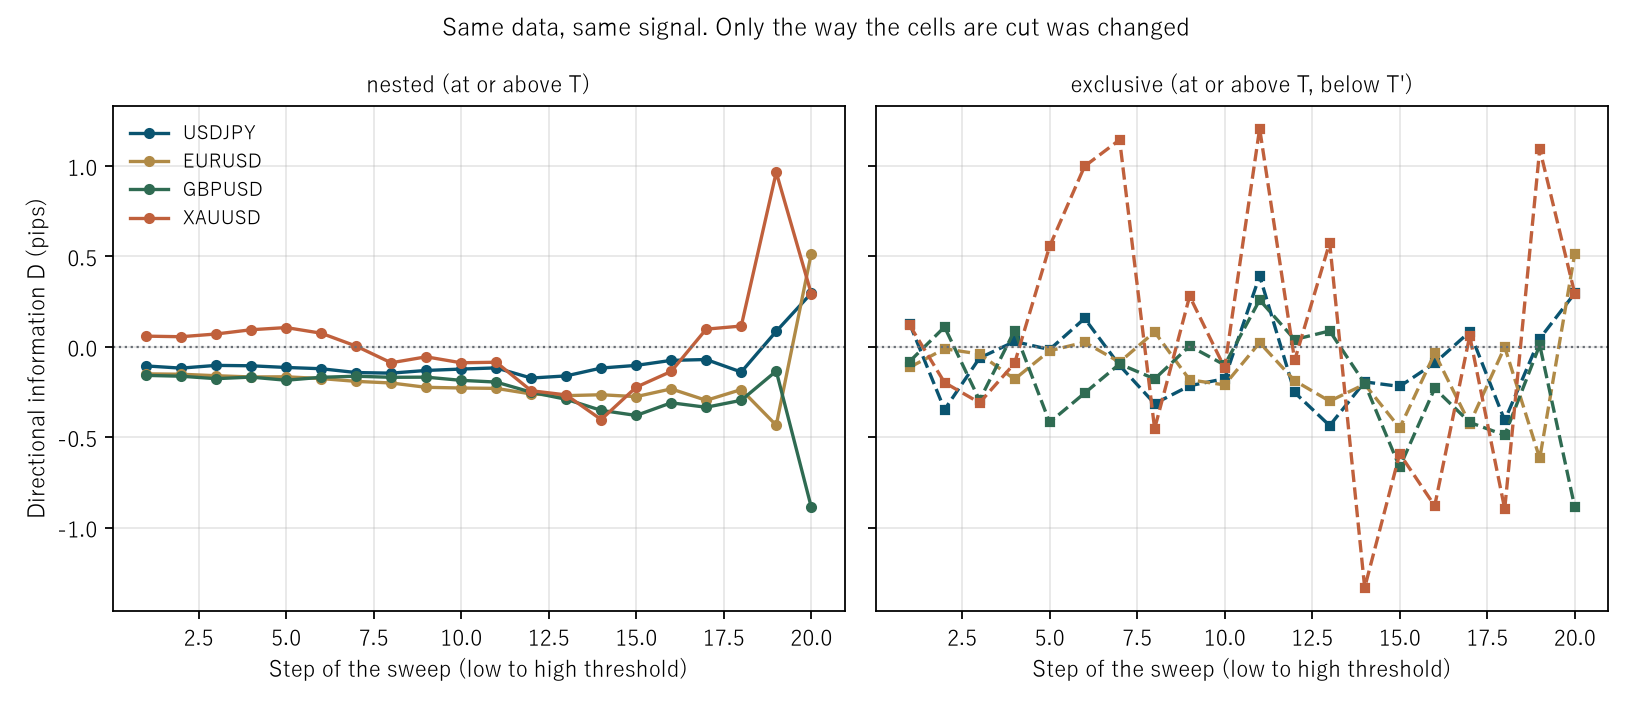
Figure 1: nested on the left, exclusive on the right; step of the sweep across, directional information up. The left moves within a band, the right scatters up and down.
5. The baseline — a plateau appears even where no edge exists
Calculation 5.1 The sweep on synthetic series (20 realisations, evaluation period)
| Instrument | Nested overlap | Nested, adjacent correlation | Exclusive, adjacent correlation | Nested plateau | Exclusive plateau |
|---|---|---|---|---|---|
| USDJPY | 0.9019 | 0.5096 | −0.0376 | 0.6750 | 0.6250 |
| EURUSD | 0.9019 | 0.5097 | −0.0400 | 0.7000 | 0.6750 |
| GBPUSD | 0.9019 | 0.4964 | −0.0385 | 0.6750 | 0.6000 |
| XAUUSD | 0.9019 | 0.5324 | −0.0378 | 0.7000 | 0.5250 |
Observation 5.2: even on the synthetic series the median nested overlap is 0.9019, almost the measured 0.8997. The overlap is a property of the cut, not of the market.
Observation 5.3: ★ this is the core of the paper. On a series known by construction to carry zero directional information, the nested adjacent correlation is 0.5096. Recut into exclusive bins it is −0.0381.
Observation 5.4: so the observation "the sweep's curve is smooth" says nothing about an edge. The smoothness is made by the nesting. What matters is whether it survives the recut into exclusive bins.
Observation 5.5: the plateau measure is 0.6875 nested and 0.6125 exclusive on the synthetic series. The gap is small. And even the exclusive version exceeds the 0.5 of chance.
Observation 5.6: ★ this paper does not use that measure as decisive. The act of picking the best cell itself favours extremes, which moves the measure away from its chance value. When a measure is invented, what it gives by chance must be measured. This section is that instance.
6. The plateau measure and the best cell in the measurement
Calculation 6.1 The sweep's best cell against the median of all cells (evaluation period, pips)
| Instrument | Nested best D | Nested median D | Nested plateau | Exclusive best D | Exclusive median D | Exclusive plateau |
|---|---|---|---|---|---|---|
| USDJPY | 0.2965 | −0.1167 | 1.0000 | 0.3929 | −0.0961 | 0.0000 |
| EURUSD | 0.5157 | −0.2255 | 0.0000 | 0.5157 | −0.0988 | 0.0000 |
| GBPUSD | −0.1338 | −0.1848 | 0.0000 | 0.2593 | −0.1387 | 1.0000 |
| XAUUSD | 0.9655 | 0.0302 | 1.0000 | 1.2076 | −0.0072 | 0.0000 |
Observation 6.2: the measured plateau measure has a median of 0.5000 nested and 0.0000 exclusive. With four series it takes only the three values 0, 0.5 and 1, so the median carries almost no information.
Observation 6.3: the directional information of the sweep's best cell has a median of 0.4061 pips, against a median spread of 0.7500 pips. Even the best cell does not reach the cost.
Observation 6.4: the gap between the best value (0.9655 for XAUUSD, say) and the median over all cells (0.0302) includes the effect of having swept at all. Picking the best of 20 steps gives a positive value even with zero directional information.
Observation 6.5: ★ the best cell's value can therefore only be read beside three things — the median over all cells, the spread, and the best value obtained by running the same sweep on a synthetic series. This paper did not measure the third. That is a limitation in Section 7.
7. Limitations
- ★ One swept quantity is fixed, the size of the last bar's move, over 20 steps. Another quantity (volatility, tick density, session) or another number of steps gives other figures. The nested overlap, however, is set by the cut alone and does not depend on the quantity.
- ★ The best value on the synthetic series was not measured. Section 6 says the best cell should be read beside the best value on a random series, and this paper does not report it. That is the gap to fill next.
- Only one plateau measure was tried. It exceeds chance on the synthetic series and in the exclusive version alike, so it was not used as decisive. Another definition could give another conclusion.
- The adjacent correlation is not precise with four series. The measured values scatter from −0.5391 to 0.7751. Only the synthetic side (20 realisations) is stable.
- The overlap in the observations was not removed. The horizon is 12 bars, so observations overlap. The subject here (overlap and correlation) is a statement about counts and is unaffected, but significance of D is not discussed and no t value is reported.
- The synthetic baseline uses independent normal increments. Volatility clustering is not included.
- Four instruments over three years. Nothing is said about other markets or other periods.
Conclusion
When a sweep over thresholds turns up a good cell, it is read as "the neighbours are good too, so it is a face".
But cutting at "T or above" makes the adjacent overlap 0.8997 at the median. Nine of every ten observations in the neighbouring cell are the same ones. Recut the same thresholds into exclusive bins and the overlap is 0.0000. The data, the signal and the thresholds are the same; only the cut changed.
And on a synthetic series known by construction to carry zero directional information, the nested adjacent correlation is 0.5096. In the exclusive version it is −0.0381.
The smoothness is made by the nesting, not by an edge.
The directional information of the sweep's best cell has a median of 0.4061 pips, short of the median spread of 0.7500 pips.
And this paper found that its own plateau measure exceeds chance even on a synthetic series, and chose not to use that measure as decisive. When a measure is invented, what it gives by chance must be measured. That is as far as this paper goes.
Data and reproduction
| Data | Currency ticks from Dukascopy (agreement to the millisecond, bid and ask, verified from 2019 onward). Gold from Dukascopy |
| Period | 2019–2024 (six years). Evaluation 2022–2024 |
| Instruments | USDJPY, EURUSD, GBPUSD, XAUUSD |
| Bars | Five-minute, mid price, closing value of completed bars only. Bars with no ticks are not created |
| Sweep | 20 steps of the quantile of the last bar's move size, from 0.50 to 0.995 |
| Verification | 検算/F013.py (with --zu it also writes the figures). Every number in the text is taken from 検算/F013_output.txt |
| Figures | 図/F013_zu1, 図/F013_zu2 (png, svg, English versions) |
| Random seeds | Fixed at 0–19. Re-running gives the same values |
| Audit of the foundation | _ツール/audit_bars.py (look-ahead in the bars, daylight saving, the day boundary). The record is _土台の検査.txt |
References
- Yamagishi, Y. (2026). Aligning Timeframes Only Reduces the Count by as Much as You Aligned [F010]. Zenodo. 10.5281/zenodo.22891380
Reference
Yamagishi, Y. (2026). A Sweep over Thresholds Cannot Produce a Plateau in Principle [F013]. Zenodo.
DOI: 10.5281/zenodo.22891660
YOI: https://www.yamagishiyuuki.com/yoi/F013
ORCID: 0009-0006-8587-3450
PDF (English) · PDF (Japanese) · Date proof of the English PDF (OpenTimestamps .ots) · SHA256SUMS
The record page for this paper (in Japanese, with the PDFs in each language and the date proof): YOI F013. This paper is a preprint and has not been peer reviewed.