Abstract
This paper asks what makes the t value attached to a method inflate — the answer is the number of observations per day. It claims neither a new mathematical theorem nor a new law.
First, with the same signal and the same 24-hour horizon, changing only the bar size gives median observations per day of 227.9935 (five-minute), 76.0392 (fifteen-minute) and 19.0390 (hourly), a factor of 11.9751 (Section 3).
Second, the median within-day correlation is 0.1430, ranging from +0.0010 to +0.6348. It is not zero. The more observations fall inside a day, the more the daily standard error exceeds the naive one: the median ratio is 2.5265, ranging from 1.1070 to 6.1256 (Section 4).
Third, that this ratio equals the square root of 1 + (m − 1) times the correlation is an identity, because the correlation is solved from that very relation. What this paper measured is not the correctness of the formula but the actual values of the correlation and of m (Section 4).
Fourth, with the same data and the same signals, changing only the denominator, the naive t exceeds 2 in absolute value in 19 of 48 cells, while the daily-clustered t does so in 6 of 48. The medians are 1.8046 and 0.7218 (Section 5).
Fifth, and this is the core of the paper, on a synthetic series known by construction to carry zero directional information, the median absolute naive t on five-minute bars is 2.0893, and the share exceeding 2 is 0.5437. On hourly bars they are 1.6494 and 0.4500 (Section 6).
Sixth, daily clustering is not enough either. On the same synthetic series, the median absolute daily t on hourly bars is 1.3530. With a 24-hour horizon, the overlap across days remains (Section 6).
Scope of this paper (scope note): No new mathematical theorem and no new law is claimed — intraclass correlation, cluster-robust standard errors, and the fact that overlapping observations inflate t are all known. No particular product or proponent is discussed — no real course, author, or vendor is the subject here, and none is named. What is treated is the public way of reporting itself. Trading is not discussed — what is measured is how a t value is built, not trading performance including commissions, fills and money management. The scope is intraday and a small number of instruments — four series, three years, three bar sizes. Monthly time-series momentum (dozens of markets, holding one to twelve months) is documented in the literature, and this paper does not contradict it. The formula is not tested — that the ratio of standard errors equals the square root of 1 + (m − 1) times the correlation is an identity following from how the correlation is defined. This paper does not write that it "confirmed" it (Section 4). Four signal families are fixed — other families give other figures (Section 7). The overlap is not removed — the horizon is 24 hours, so observations overlap, and daily clustering leaves the part that crosses days (Sections 6 and 7). No forecast is claimed. Relation to earlier papers: this series always reports, alongside a t, what it would be by chance. F010 showed that removing the overlap drops the daily t and F013 showed that nesting makes smoothness — this paper shows that the denominator alone changes significance threefold. What is added here is moving the observations per day by changing the bar size, measuring the within-day correlation itself, and producing the distribution of the naive t on a series known to carry no edge.
1. Notation and the question
A method's results often come with a t value, and most of them use the standard deviation divided by the square root of the count as the denominator.
| Name | How the denominator is built | What it assumes |
|---|---|---|
| Naive t | standard deviation ÷ square root of the count | the observations are independent |
| Daily-clustered t | standard deviation of the daily means ÷ square root of the number of days | independence across days |
| What this paper asks | how much the former inflates |
Observation 1.1: observations inside one day are not independent. They count the same movement of the same market several times.
Observation 1.2: with m observations a day and a within-day correlation, the variance of a daily mean is the per-observation variance times 1 + (m − 1) times the correlation, divided by m. From there the ratio of standard errors is the square root of 1 + (m − 1) times the correlation. A correlation of zero means no inflation; a correlation of one means a factor of the square root of m.
Observation 1.3: ★ but this paper solves the correlation from that very relation. So the ratio of standard errors and that formula are an identity, not a test. What can be measured are the actual values of the correlation and of m. An identity must not be written up as "confirmed".
Observation 1.4: so the question is settled another way. First, change the bar size to move m and see how much the inflation changes. Second, count how often the naive t actually exceeds 2 on a synthetic series known to carry zero directional information.
Question: what makes the t value attached to a method inflate?
2. Writing the quantity and the design in advance
Design (declared before running and unchanged at run time)
| Item | Decision |
|---|---|
| Bar sizes | five-minute, fifteen-minute, hourly (mid price, completed bars only) |
| Horizon | 24 hours for all three (288, 96 and 24 bars). ★ The same span of time is looked at |
| Signal 1 | the sign of the last bar's move (with the trend) |
| Signal 2 | a moving-average cross (short 5, long 20) |
| Signal 3 | RSI(14) above or below 50 |
| Signal 4 | outside a Bollinger band(20, 2.0), against the move |
| Naive t | mean ÷ (standard deviation ÷ square root of the count) |
| Daily t | mean of the daily means ÷ (their standard deviation ÷ square root of the number of days) |
| Within-day correlation | solved from the variance of the daily means |
| Baseline | synthetic series random down to the movement inside each bar (10 realisations) |
| Instruments | USDJPY, EURUSD, GBPUSD, XAUUSD |
| Period | 2019–2024. Evaluation 2022–2024 |
Observation 2.1: the horizon is held at 24 hours across bar sizes. Without that, "did t change because of the count or because of the span looked at" cannot be separated.
Observation 2.2: all four signals carry a sign. A quantity that is only a size (volatility, say) has zero directional information by construction and is no ground on which to discuss t.
Observation 2.3: the synthetic series has zero directional information by construction. That is what makes "does t exceed 2 anyway" answerable.
The horizons in bars are 288, 96 and 24.
3. Changing the bar size moves the observations per day by a factor of 12
Calculation 3.1 Same signal, same 24 hours, only the bar size changed (USDJPY, evaluation period)
| Signal | Bar size | Count | Days | Per day | Naive t | Daily t |
|---|---|---|---|---|---|---|
| Last bar's sign | 5m | 211,932 | 935 | 226.6652 | 1.8711 | 0.9910 |
| Last bar's sign | 15m | 71,021 | 935 | 75.9583 | 1.5341 | 1.3190 |
| Last bar's sign | 1h | 17,815 | 935 | 19.0535 | 0.8918 | 0.5379 |
| Moving-average cross | 5m | 213,995 | 935 | 228.8717 | 8.0036 | 1.8794 |
| Moving-average cross | 15m | 71,355 | 935 | 76.3155 | 6.0353 | 2.1279 |
| Moving-average cross | 1h | 17,841 | 935 | 19.0813 | 2.2359 | 1.1385 |
| RSI at 50 | 5m | 214,003 | 935 | 228.8802 | 11.2668 | 2.4086 |
| RSI at 50 | 15m | 71,356 | 935 | 76.3166 | 7.7751 | 2.1832 |
| RSI at 50 | 1h | 17,841 | 935 | 19.0813 | 1.2776 | 0.7736 |
| Outside the band | 5m | 25,288 | 929 | 27.2207 | −2.7480 | −0.3760 |
| Outside the band | 15m | 9,268 | 890 | 10.4135 | −3.2830 | 0.0574 |
| Outside the band | 1h | 2,310 | 692 | 3.3382 | −3.2502 | 1.7219 |
Calculation 3.2 Observations per day by bar size
| Bar size | Median observations per day |
|---|---|
| 5m | 227.9935 |
| 15m | 76.0392 |
| 1h | 19.0390 |
Observation 3.3: five-minute and hourly bars differ by a factor of 11.9751 in observations per day. The span looked at is the same 24 hours and the signal is the same.
Observation 3.4: the naive t moves a great deal with the bar size. For the moving-average cross on USDJPY it is 8.0036 on five-minute bars and 2.2359 on hourly ones. More than threefold, for the same signal over the same 24 hours.
Observation 3.5: the daily t at the same place is 1.8794 and 1.1385, moving far less. ★ The naive t is the one that is sensitive to the bar size.
Observation 3.6: for the band signal on USDJPY fifteen-minute bars, the naive t is −3.2830 while the daily t is 0.0574. The sign changes. That is the difference between "significantly negative" and "nothing can be said" — not a small difference.
4. The within-day correlation and the inflation of the standard error
Calculation 4.1 Correlation and the ratio of standard errors (XAUUSD, evaluation period)
| Signal | Bar size | Per day | Within-day correlation | Ratio of standard errors | Upper bound √m | Ratio ÷ √m |
|---|---|---|---|---|---|---|
| Last bar's sign | 5m | 227.7614 | 0.0051 | 1.4654 | 15.0918 | 0.0971 |
| Last bar's sign | 15m | 76.0011 | 0.0131 | 1.4087 | 8.7179 | 0.1616 |
| Last bar's sign | 1h | 19.0261 | 0.1143 | 1.7495 | 4.3619 | 0.4011 |
| Moving-average cross | 5m | 228.2255 | 0.1225 | 5.3695 | 15.1071 | 0.3554 |
| Moving-average cross | 15m | 76.0773 | 0.2148 | 4.1387 | 8.7222 | 0.4745 |
| Moving-average cross | 1h | 19.0316 | 0.3939 | 2.8465 | 4.3625 | 0.6525 |
| RSI at 50 | 5m | 228.2255 | 0.1607 | 6.1256 | 15.1071 | 0.4055 |
| RSI at 50 | 15m | 76.0773 | 0.2696 | 4.6089 | 8.7222 | 0.5284 |
| RSI at 50 | 1h | 19.0316 | 0.4178 | 2.9213 | 4.3625 | 0.6696 |
| Outside the band | 5m | 27.7052 | 0.1866 | 2.4462 | 5.2636 | 0.4647 |
| Outside the band | 15m | 10.9698 | 0.3134 | 2.0310 | 3.3121 | 0.6132 |
| Outside the band | 1h | 3.3523 | 0.6348 | 1.5790 | 1.8309 | 0.8624 |
Observation 4.2: the median within-day correlation is 0.1430, ranging from +0.0010 to +0.6348. It is not zero. This is not a setting in which independence may be assumed.
Observation 4.3: the median ratio of standard errors is 2.5265, ranging from 1.1070 to 6.1256. The denominator alone changes the standard error by a factor of two and a half.
Observation 4.4: ★ that this ratio equals the square root of 1 + (m − 1) times the correlation is an identity, since the correlation is solved from that relation. This paper does not test the formula. What it measured are the actual values of the correlation and of m.
Observation 4.5: the ratio divided by the upper bound √m has a median of 0.4055. It stays at about four tenths of the bound (the case of perfect within-day correlation). So discounting by √m as a rule of thumb discounts too much.
Observation 4.6: the correlation is larger on coarser bars (for the band signal on XAUUSD: 0.1866, 0.3134, 0.6348). Coarse bars hold fewer observations a day, and what remains is more strongly correlated. The total inflation is set by how m and the correlation combine.
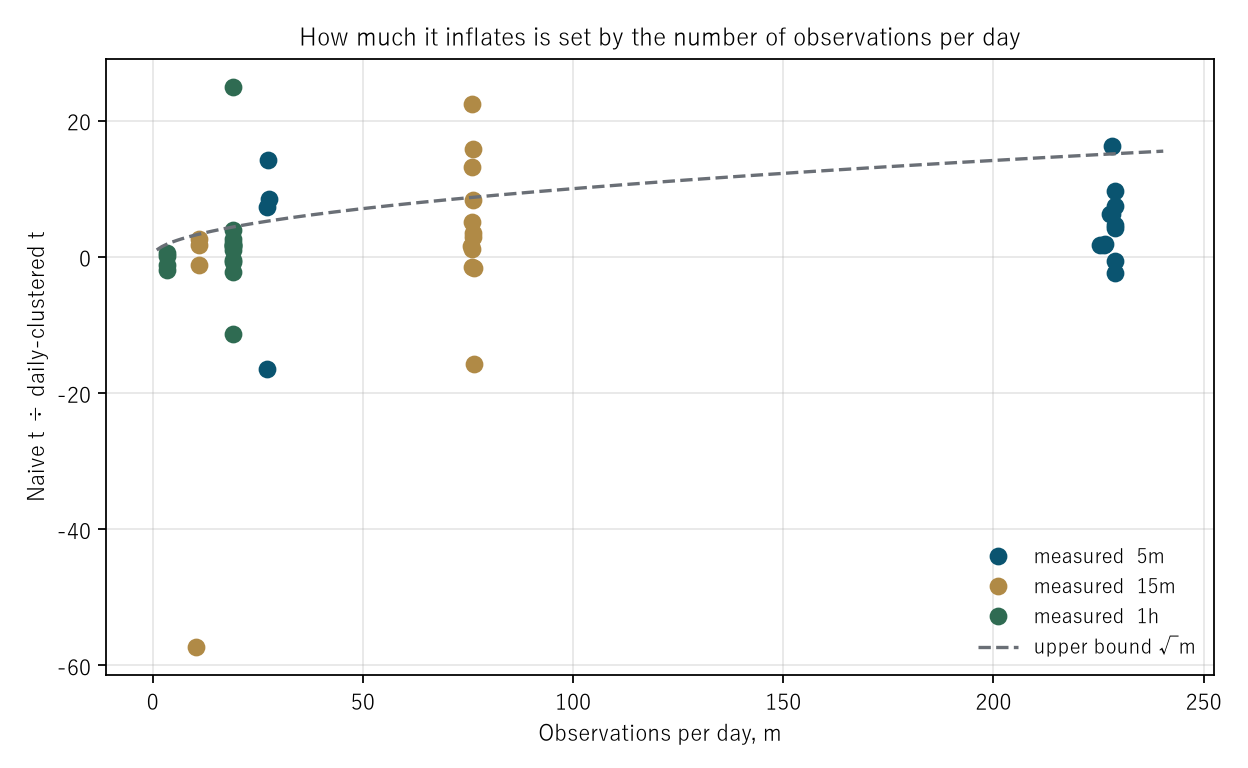
Figure 1: observations per day across, naive t divided by daily t up. The dashed line is the upper bound √m.
5. The number of significant cells changes with the denominator alone
Calculation 5.1 Same data, same signals, only the way t is built (evaluation period)
| Bar size | Cells | Absolute naive t at or above 2 | Absolute daily t at or above 2 | Median naive t | Median daily t |
|---|---|---|---|---|---|
| 5m | 16 | 8 / 16 | 1 / 16 | 2.0127 | 0.6475 |
| 15m | 16 | 7 / 16 | 2 / 16 | 1.8048 | 0.6343 |
| 1h | 16 | 4 / 16 | 3 / 16 | 1.2798 | 0.7617 |
Observation 5.2: over all 48 cells, the naive t reaches 2 in absolute value in 19, the daily-clustered t in 6. The medians are 1.8046 and 0.7218.
Observation 5.3: the content is the same. The data, the signals, the period and the horizon are unchanged. Only the denominator was changed.
Observation 5.4: the gap is larger on finer bars. On five-minute bars 8 / 16 falls to 1 / 16, while on hourly bars 4 / 16 falls only to 3 / 16. The more observations a method produces, the more the naive t inflates.
Observation 5.5: ★ therefore the t values of a high-count method and a low-count method must not be compared while both are naive. The former comes out ahead not because it is right but because it counts the same day many times.
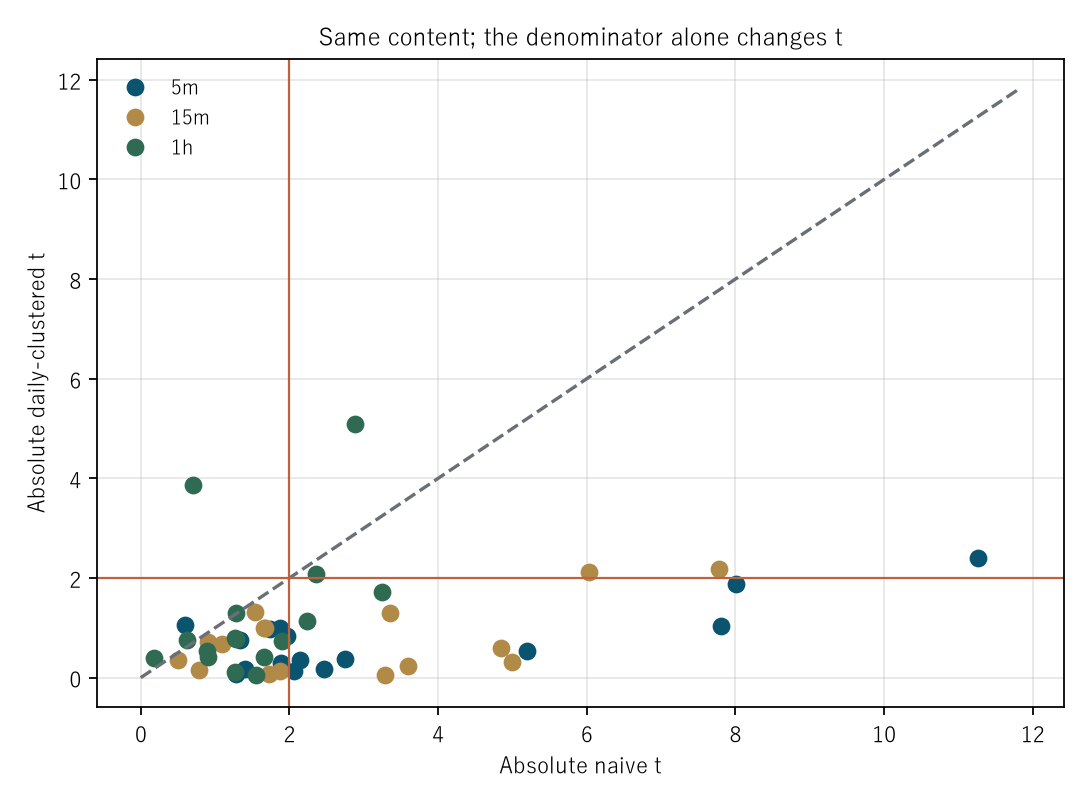
Figure 2: absolute naive t across, absolute daily t up. The points fall below the diagonal, and the two red lines mark 2.
6. The baseline — the naive t exceeds 2 even where no edge exists
Calculation 6.1 Synthetic series whose within-bar movement is also random (10 realisations, evaluation period)
| Bar size | Per day | Median absolute naive t | Median absolute daily t | Share with naive t at or above 2 |
|---|---|---|---|---|
| 5m | 228.8802 | 2.0893 | 0.8516 | 0.5437 |
| 15m | 76.3166 | 0.8718 | 0.7512 | 0.2687 |
| 1h | 19.0813 | 1.6494 | 1.3530 | 0.4500 |
Observation 6.2: ★ this is the core of the paper. On a series known by construction to carry zero directional information, the median absolute naive t on five-minute bars is 2.0893, and the share exceeding 2 is 0.5437.
Observation 6.3: more than half the cells look "significant". Not because anything is right. The naive t is not measuring whether anything is right.
Observation 6.4: ★ and daily clustering is not enough either. On the same synthetic series, the median absolute daily t on hourly bars is 1.3530, larger than the 0.8516 of five-minute bars.
Observation 6.5: the reason is the 24-hour horizon. Neighbouring observations overlap, and daily clustering folds only the overlap within a day. The part that crosses days remains.
Observation 6.6: the fifteen-minute row alone is small (naive 0.8718, share 0.2687). The three bar sizes are not monotone. This paper cannot explain that non-monotonicity. It is a limitation in Section 7.
7. Limitations
- ★ The formula is not tested. That the ratio of standard errors equals the square root of 1 + (m − 1) times the correlation is an identity following from the definition. What this paper measured are the actual values of the correlation and of m.
- ★ The overlap is not removed. The horizon is 24 hours, so observations overlap; daily clustering leaves the part that crosses days, and the median absolute daily t of 1.3530 on the synthetic series is the evidence. This paper does not say that daily clustering is sufficient.
- The three bar sizes are not monotone on the synthetic series. The paper cannot explain why the fifteen-minute row is small. That is the gap to fill next.
- Four signal families are fixed. Other families give other figures. But that the correlation is non-zero and that m moves by a factor of 12 do not depend on the family.
- The correlation is measured under one definition, an intraclass correlation with days as groups. Other groups (weeks, sessions) give other values.
- The synthetic baseline uses independent normal increments. Volatility clustering is not included.
- Four instruments over three years. Nothing is said about other markets or other periods.
Conclusion
Measuring the same signal over the same 24 hours ahead, changing only the bar size moves the observations per day from 19.0390 to 227.9935 — a factor of 11.9751.
The within-day correlation has a median of 0.1430 and is not zero, so the daily standard error exceeds the naive one by a median factor of 2.5265. As a result the naive t reaches 2 in absolute value in 19 of 48 cells while the daily-clustered t does so in 6 of 48. The content is the same; only the denominator changed.
And on a synthetic series known by construction to carry zero directional information, the median absolute naive t on five-minute bars is 2.0893, with 0.5437 of cells exceeding 2.
The naive t is not measuring whether anything is right. It is measuring how many times the same day was counted.
And daily clustering is not enough. On the same synthetic series the median absolute daily t on hourly bars is 1.3530. With a 24-hour horizon, the overlap across days remains. What this paper could show is that the naive version is insufficient, not that the daily version suffices.
Data and reproduction
| Data | Currency ticks from Dukascopy (agreement to the millisecond, bid and ask, verified from 2019 onward). Gold from Dukascopy |
| Period | 2019–2024 (six years). Evaluation 2022–2024 |
| Instruments | USDJPY, EURUSD, GBPUSD, XAUUSD |
| Bars | Five-minute, fifteen-minute and hourly. Mid price, closing value of completed bars only. Bars with no ticks are not created |
| Horizon | 24 hours for all three (288, 96 and 24 bars) |
| Verification | 検算/F014.py (with --zu it also writes the figures). Every number in the text is taken from 検算/F014_output.txt |
| Figures | 図/F014_zu1, 図/F014_zu2 (png, svg, English versions) |
| Random seeds | Fixed at 0–9. Re-running gives the same values |
| Audit of the foundation | _ツール/audit_bars.py (look-ahead in the bars, daylight saving, the day boundary). The record is _土台の検査.txt |
References
- Yamagishi, Y. (2026). Aligning Timeframes Only Reduces the Count by as Much as You Aligned [F010]. Zenodo. 10.5281/zenodo.22891380
- Yamagishi, Y. (2026). A Sweep over Thresholds Cannot Produce a Plateau in Principle [F013]. Zenodo. 10.5281/zenodo.22891660
Reference
Yamagishi, Y. (2026). A Naive t Value Inflates with the Number of Observations per Day [F014]. Zenodo.
DOI: 10.5281/zenodo.22891694
YOI: https://www.yamagishiyuuki.com/yoi/F014
ORCID: 0009-0006-8587-3450
PDF (English) · PDF (Japanese) · Date proof of the English PDF (OpenTimestamps .ots) · SHA256SUMS
The record page for this paper (in Japanese, with the PDFs in each language and the date proof): YOI F014. This paper is a preprint and has not been peer reviewed.