Abstract
This paper asks what sets the "seventy percent" in "seventy percent of breakouts are fakeouts" — the answer is the definition of failure. It claims neither a new mathematical theorem nor a new law.
First, applying twenty definitions of "failure" to the same breakouts (five choices of how soon it came back times four of how far), the failure rate moves from 21.5038% to 91.6747%, with a median of 70.8895% (Section 3).
Second, and this is the core of the paper, the per-instrument span is 67.3477, 67.1632, 67.4601 and 66.6121 points — nearly the same in all four series. What moves is not the market but the ruler (Section 3).
Third, extending "how soon" from 3 bars to 48 raises the median failure rate from 47.6242% to 84.4440%. Deepening "how far" from the level itself to 1.00 ATR lowers it from 80.2616% to 49.3404%. Any number can be produced, in either direction (Section 3).
Fourth, the directional information of the same breakouts has a median of +0.7580 pips, against a median spread of 0.7500 pips. The failure rate moves 67 points across twenty definitions and this value stays one number. The definition of failure concerns the exit and changes nothing about the entry's direction (Section 4).
Fifth, selecting only the breakouts that did not fail improves the directional information by a median of +48.6814 pips. But that selects after looking ahead. Whether a breakout failed is not known at the time (Section 5).
Sixth, repeating the measurement on synthetic series built from independent normal increments down to the movement inside each bar, the median difference in failure rate is −1.2751 points, with a median absolute value of 2.1631 points. A synthetic random walk has no real breakouts and no fakeouts, and gives the same rates anyway (Section 6).
Scope of this paper (scope note): No new mathematical theorem and no new law is claimed — the definition of a breakout, the true range and random walks are all known. No particular product or proponent is discussed — no real course, author, or vendor is the subject here, and none is named. What is treated is the public turn of phrase itself. Trading is not discussed — what is measured is failure rates and directional information, not trading performance including commissions, fills and money management. The scope is intraday and a small number of instruments — four series, three years, one-hour bars. Monthly time-series momentum (dozens of markets, holding one to twelve months) is documented in the literature, and this paper does not contradict it. One definition of a breakout is fixed — a close beyond the high or low of the last 20 bars. A wick beyond the level, or another number of bars, is not treated (Section 8). "Fakeout" is defined in two dimensions only — how soon and how far. Definitions that add volume or shape are not treated. The overlap is not removed — the horizon is 24 bars and there are 2 to 3 observations a day (Sections 4 and 8). No forecast is claimed. Relation to earlier papers: this series always reports, alongside a rate, what that rate would be by chance. F012 showed that the win rate moves a great deal with the placement of the barriers while the expectation does not — this paper applies the same shape to the word "fakeout". What is added here is opening the definition of failure into two dimensions and recounting twenty ways, showing that the directional information of the same breakouts does not depend on the definition, and placing the failure rate of breakouts on a synthetic random walk alongside.
1. Notation and the question
There is a way of speaking that says "seventy percent of breakouts are fakeouts" and "a real breakout does not come back".
| Statement | What it fixes | What it leaves open |
|---|---|---|
| It broke out | which level, and how it was crossed | — |
| It was a fakeout | — | how soon, and how far back, counts as failure |
| What this paper asks | once those two are fixed, how does the seventy move |
Observation 1.1: "a failure rate of 70%" says nothing on its own, because the definition of failure is not written down.
Observation 1.2: fixing failure takes at least two things: how soon it came back, and how far back it came.
Observation 1.3: the question settles by opening those two into a plane. Five deadlines times four depths gives twenty recounts. If the rate moves a great deal, the failure rate is a restatement of the definition.
Observation 1.4: and the directional information of the same breakouts is measured too. The definition of failure concerns the exit, not the entry's direction. If the failure rate moves while the directional information does not, only the definition moved.
Question: what sets the seventy in "seventy percent of breakouts are fakeouts"?
2. Writing the quantity and the design in advance
Design (declared before running and unchanged at run time)
| Item | Decision |
|---|---|
| Lattice | one-hour bars, mid price, completed bars only |
| Breakout | a close beyond the high (or low) of the last 20 bars. ★ The bar itself is not included in that high or low |
| Failure (how soon) | within 3, 6, 12, 24 or 48 bars |
| Failure (how far) | back by 0.00, 0.25, 0.50 or 1.00 ATR from the level |
| Directional information | a signal on the breakout bar and the move over the next 24 bars (with the break, in pips) |
| Baseline | synthetic series random down to the movement inside each bar (10 realisations) |
| Instruments | USDJPY, EURUSD, GBPUSD, XAUUSD |
| Period | 2019–2024. Evaluation 2022–2024 |
Observation 2.1: the high and low of the last 20 bars exclude the bar itself. Including it would put the bar into the test of whether that bar broke out.
Observation 2.2: the directional signal sits on the breakout bar. Changing the definition of failure does not change it. So against twenty failure rates there is only one directional measurement.
Observation 2.3: "how far" is measured in ATR. Fixing it in pips would mean something different in each instrument.
The breakout counts are 2,088 for USDJPY (up 1,322, down 766), 2,039 for EURUSD (up 985, down 1,054), 2,069 for GBPUSD (up 1,015, down 1,054) and 1,798 for XAUUSD (up 1,005, down 793).
3. The failure rate moves a great deal with the definition — this is the separator
Calculation 3.1 Failure rate recounted twenty ways (USDJPY, evaluation period, %)
| How soon \ How far | 0.00 ATR | 0.25 ATR | 0.50 ATR | 1.00 ATR |
|---|---|---|---|---|
| 3 bars | 67.1456 | 52.8257 | 40.5651 | 21.5038 |
| 6 bars | 73.8860 | 63.2487 | 51.7968 | 33.4451 |
| 12 bars | 79.8178 | 72.3394 | 63.7584 | 48.8015 |
| 24 bars | 85.1248 | 79.7505 | 73.5605 | 61.5163 |
| 48 bars | 88.8515 | 85.1514 | 80.2979 | 71.6002 |
Calculation 3.2 Span by instrument
| Instrument | Minimum | Maximum | Span (points) |
|---|---|---|---|
| USDJPY | 21.5038% | 88.8515% | 67.3477 |
| EURUSD | 23.7862% | 90.9493% | 67.1632 |
| GBPUSD | 24.2146% | 91.6747% | 67.4601 |
| XAUUSD | 22.9143% | 89.5265% | 66.6121 |
Calculation 3.3 How each axis acts (median of four series, %)
| Axis | Value | Median failure rate |
|---|---|---|
| How soon | 3 bars | 47.6242 |
| How soon | 6 bars | 58.7147 |
| How soon | 12 bars | 68.3801 |
| How soon | 24 bars | 78.4312 |
| How soon | 48 bars | 84.4440 |
| How far | 0.00 ATR | 80.2616 |
| How far | 0.25 ATR | 72.4909 |
| How far | 0.50 ATR | 64.0928 |
| How far | 1.00 ATR | 49.3404 |
Observation 3.4: the failure rate moves from 21.5038% to 91.6747%, with an overall median of 70.8895%. "Seventy percent are fakeouts" does come out. So do "only twenty percent are" and "ninety percent are".
Observation 3.5: ★ the per-instrument span is 66.6121 to 67.4601 points — nearly identical across the four. What moves is not the market but the ruler. A property of the market could differ from instrument to instrument.
Observation 3.6: extending the deadline raises the failure rate monotonically (47.6242% to 84.4440%). Wait long enough and price eventually comes back.
Observation 3.7: deepening the threshold lowers it monotonically (80.2616% to 49.3404%). Demand a deep retracement and failures become rarer.
Observation 3.8: ★ the two axes act in opposite directions, so any number can be produced. "Back to the level within 48 bars" gives 88.8515%; "back by 1.00 ATR within 3 bars" gives 21.5038%. The same breakouts are being counted.
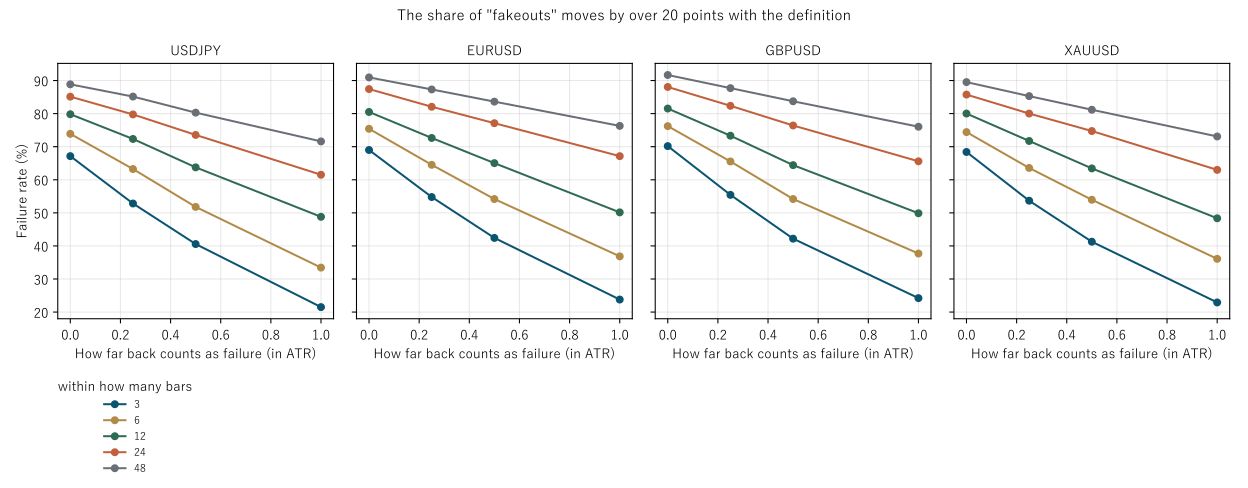
Figure 1: one panel per instrument, "how far" across, one line per "how soon". The same shape appears in every instrument.
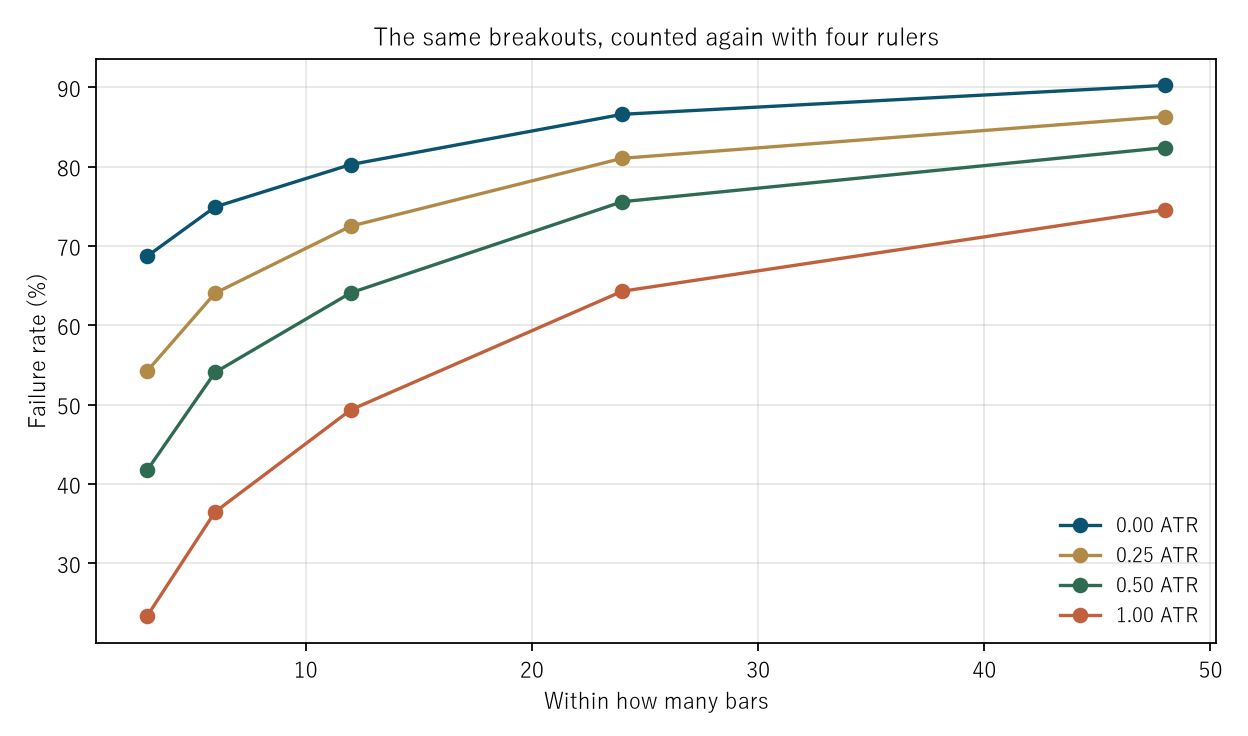
Figure 2: "how soon" across, one line per "how far". The four lines lie far apart.
4. The directional information of the same breakouts
Calculation 4.1 A signal on the breakout bar (evaluation period)
| Instrument | Count | D (pips) | Dd (daily mean) | Daily t | Days | Per day | Spread | Buy/sell |
|---|---|---|---|---|---|---|---|---|
| USDJPY | 2,084 | 4.7369 | −6.1986 | −2.05 | 711 | 2.0 | 0.60 | 1320/764 |
| EURUSD | 2,036 | −2.9264 | −7.4862 | −4.68 | 706 | 3.0 | 0.30 | 985/1051 |
| GBPUSD | 2,069 | 0.3576 | −6.6898 | −3.10 | 713 | 3.0 | 0.90 | 1015/1054 |
| XAUUSD | 1,797 | 1.1583 | −20.5466 | −3.48 | 655 | 2.0 | 3.50 | 1004/793 |
Observation 4.2: the median directional information is +0.7580 pips against a median spread of 0.7500 pips. The same order.
Observation 4.3: ★ the failure rate moved 67 points across twenty definitions, and this table is still one table. The definition of failure concerns the exit and changes nothing about the entry's direction.
Observation 4.4: D and Dd disagree in sign in all four series. The overall mean scatters from +4.7369 to −2.9264 while the daily means are all negative, from −6.1986 to −20.5466. Days with many observations are making the overall mean.
Observation 4.5: the daily t reaches 2 in absolute value in 4 of 4 cells, where chance gives about 0.2. But this must not be read as "breakouts lose". The horizon is 24 bars with 2 to 3 observations a day, so the observations overlap. As F010 and F014 showed, the overlap survives daily clustering.
5. Selecting only the breakouts that did not fail
Calculation 5.1 Selecting after looking ahead (evaluation period)
| Instrument | How soon | How far | Failure rate | Remaining count | D of the remainder | D of all | Difference |
|---|---|---|---|---|---|---|---|
| USDJPY | 3 | 0.00 | 67.1785% | 684 | 32.2260 | 4.7369 | +27.4891 |
| USDJPY | 12 | 0.25 | 72.3129% | 577 | 52.3307 | 4.7369 | +47.5938 |
| USDJPY | 24 | 0.50 | 73.5605% | 551 | 76.7590 | 4.7369 | +72.0221 |
| USDJPY | 48 | 1.00 | 71.6002% | 591 | 84.1438 | 4.7672 | +79.3766 |
| EURUSD | 3 | 0.00 | 69.0079% | 631 | 6.3745 | −2.9264 | +9.3009 |
| EURUSD | 12 | 0.25 | 72.6424% | 557 | 20.6346 | −2.9264 | +23.5610 |
| EURUSD | 24 | 0.50 | 77.1120% | 466 | 42.0089 | −2.9264 | +44.9353 |
| EURUSD | 48 | 1.00 | 76.2912% | 482 | 46.8619 | −2.9071 | +49.7690 |
| GBPUSD | 3 | 0.00 | 70.1788% | 617 | 17.0118 | 0.3576 | +16.6541 |
| GBPUSD | 12 | 0.25 | 73.3204% | 552 | 34.3677 | 0.3576 | +34.0100 |
| GBPUSD | 24 | 0.50 | 76.4137% | 488 | 58.9293 | 0.3576 | +58.5717 |
| GBPUSD | 48 | 1.00 | 76.0407% | 495 | 67.6130 | 0.3820 | +67.2310 |
| XAUUSD | 3 | 0.00 | 68.4474% | 567 | 44.8329 | 1.1583 | +43.6746 |
| XAUUSD | 12 | 0.25 | 71.7307% | 508 | 93.8529 | 1.1583 | +92.6945 |
| XAUUSD | 24 | 0.50 | 74.7357% | 454 | 154.0638 | 1.1583 | +152.9055 |
| XAUUSD | 48 | 1.00 | 73.0919% | 483 | 161.9278 | 1.3318 | +160.5961 |
Observation 5.2: the median difference is +48.6814 pips, ranging from +9.3009 to +160.5961. Very large.
Observation 5.3: ★ but this selects after looking ahead. Whether a breakout "did not fail" is not known at the time of the breakout. Some definitions take 48 bars to settle.
Observation 5.4: this number is not a trade. It is reported not to show that "picking only the real breakouts wins" is true, but to put a figure on what that "picking" is asking for.
Observation 5.5: ★ the deeper the definition, the larger the difference (+27.4891 to +79.3766 for USDJPY). Because a deeper definition looks further ahead. The size of the difference is a function of how much future was peeked at.
6. The baseline — what share of a random walk's breakouts are fakeouts
Calculation 6.1 Synthetic series whose within-bar movement is also random (10 realisations, evaluation period)
| Instrument | How soon | How far | Measured | Random walk | Difference (points) |
|---|---|---|---|---|---|
| USDJPY | 3 | 0.00 | 67.1456% | 66.8624% | +0.2832 |
| USDJPY | 12 | 0.25 | 72.3394% | 75.2980% | −2.9586 |
| USDJPY | 24 | 0.50 | 73.5605% | 76.8001% | −3.2396 |
| USDJPY | 48 | 1.00 | 71.6002% | 76.6027% | −5.0025 |
| EURUSD | 3 | 0.00 | 69.0044% | 66.8646% | +2.1398 |
| EURUSD | 12 | 0.25 | 72.6424% | 75.2829% | −2.6404 |
| EURUSD | 24 | 0.50 | 77.1120% | 76.7957% | +0.3163 |
| EURUSD | 48 | 1.00 | 76.2912% | 76.6120% | −0.3208 |
| GBPUSD | 3 | 0.00 | 70.1788% | 66.8647% | +3.3141 |
| GBPUSD | 12 | 0.25 | 73.3204% | 75.2992% | −1.9788 |
| GBPUSD | 24 | 0.50 | 76.4137% | 76.7962% | −0.3824 |
| GBPUSD | 48 | 1.00 | 76.0407% | 76.6121% | −0.5715 |
| XAUUSD | 3 | 0.00 | 68.4093% | 66.9991% | +1.4103 |
| XAUUSD | 12 | 0.25 | 71.7307% | 75.3966% | −3.6659 |
| XAUUSD | 24 | 0.50 | 74.7357% | 76.9220% | −2.1864 |
| XAUUSD | 48 | 1.00 | 73.0919% | 76.6397% | −3.5478 |
Observation 6.2: the median difference between measurement and random walk is −1.2751 points, with a median absolute value of 2.1631 points and a range from −5.0025 to +3.3141.
Observation 6.3: a synthetic random walk has no support, no resistance, nobody positioning and no pool of stop orders. Between 66.8624% and 76.9220% of its breakouts are "fakeouts" anyway.
Observation 6.4: ★ so the observation "seventy percent of breakouts are fakeouts" says nothing about the market. What it says is only that price goes back and forth.
Observation 6.5: the measurement is slightly lower (median difference −1.2751 points). That reads as fewer fakeouts than a random walk. But inside a scatter with a median absolute value of 2.1631 points, this paper does not claim it.
7. Splitting by session
Design: five non-overlapping bins in Coordinated Universal Time. The signal is the breakout of Section 4.
Calculation 7.1 Directional information in each of the five bins (evaluation period)
| Instrument | Tokyo 0–7 | London 7–12 | Overlap 12–16 | NY late 16–21 | Night 21–24 |
|---|---|---|---|---|---|
| USDJPY | 4.94 (t −0.64) | 4.40 (t 0.68) | 3.81 (t −1.34) | 3.52 (t −0.50) | 12.51 (t 1.61) |
| EURUSD | −3.25 (t −0.66) | −0.89 (t −0.98) | −3.93 (t −3.05) | −3.48 (t −0.89) | −4.30 (t −0.76) |
| GBPUSD | 1.80 (t −0.61) | 2.36 (t −0.56) | −2.00 (t −2.02) | −2.08 (t −1.05) | 8.04 (t 0.51) |
| XAUUSD | 2.90 (t −0.80) | 6.07 (t 0.01) | 5.44 (t −1.32) | −2.97 (t −0.79) | −59.68 (t −1.88) |
Observation 7.2: the daily t reaches 2 in absolute value in 2 of 20 cells, against about 0.9 by chance — somewhat more.
Observation 7.3: both are in Overlap 12–16 and both are negative. This paper does not claim them. As in Section 4, the observations overlap, so the daily t is inflated too.
Observation 7.4: XAUUSD in the night bin shows a large −59.68 pips, but its t is −1.88. The size comes from the size of gold's moves.
8. Limitations
- ★ One definition of a breakout is fixed, a close beyond the high or low of the last 20 bars. A wick beyond the level, another number of bars, or a volume condition are not treated. The conclusion that moving the definition moves the failure rate only strengthens as definitions are added.
- "Fakeout" is defined in two dimensions only, how soon and how far. Definitions adding shape or volume are not treated.
- ★ The overlap is not removed. The horizon is 24 bars with 2 to 3 observations a day. The daily t in Sections 4 and 7 is inflated. This paper does not say that breakouts lose.
- Section 5 looks ahead. Whether a breakout failed is known only later. It measures an upper bound.
- The ATR period is fixed at 14. Another period changes the actual width of "how far". The same period is used for the measurement and the random walk, so the comparison stands.
- The synthetic baseline uses independent normal increments. Volatility clustering is not included.
- Four instruments over three years. Nothing is said about other markets or other periods.
Conclusion
"Seventy percent of breakouts are fakeouts" is right. The overall median is 70.8895%.
But applying twenty definitions to the same breakouts moves the failure rate from 21.5038% to 91.6747%. "Only twenty percent are fakeouts" and "ninety percent are" come out of the same data. Extending the deadline raises it; deepening the threshold lowers it. The two axes act in opposite directions, so any number can be produced.
And the per-instrument span is 66.6121 to 67.4601 points, nearly the same in all four. What moves is not the market but the ruler.
The directional information of the same breakouts has a median of +0.7580 pips against a median spread of 0.7500 pips, and against twenty definitions there is only one such number. The definition of failure concerns the exit and changes nothing about the entry's direction.
The gap against breakouts on a synthetic random walk has a median of −1.2751 points. In a series with no support and no resistance, about seventy percent are fakeouts too.
What "seventy percent are fakeouts" says is only that price goes back and forth.
Data and reproduction
| Data | Currency ticks from Dukascopy (agreement to the millisecond, bid and ask, verified from 2019 onward). Gold from Dukascopy |
| Period | 2019–2024 (six years). Evaluation 2022–2024 |
| Instruments | USDJPY, EURUSD, GBPUSD, XAUUSD |
| Bars | One-hour, mid price, closing value of completed bars only. Bars with no ticks are not created |
| Breakout | A close beyond the high or low of the last 20 bars, that bar excluded |
| Verification | 検算/F015.py (with --zu it also writes the figures). Every number in the text is taken from 検算/F015_output.txt |
| Figures | 図/F015_zu1, 図/F015_zu2 (png, svg, English versions) |
| Random seeds | Fixed at 0–9. Re-running gives the same values |
| Audit of the foundation | _ツール/audit_bars.py (look-ahead in the bars, daylight saving, the day boundary). The record is _土台の検査.txt |
References
- Yamagishi, Y. (2026). Aligning Timeframes Only Reduces the Count by as Much as You Aligned [F010]. Zenodo. 10.5281/zenodo.22891380
- Yamagishi, Y. (2026). Placing the Take Profit and Stop Loss Forty-Nine Ways Does Not Move the Expectation [F012]. Zenodo. 10.5281/zenodo.22891608
- Yamagishi, Y. (2026). A Naive t Value Inflates with the Number of Observations per Day [F014]. Zenodo. 10.5281/zenodo.22891694
Reference
Yamagishi, Y. (2026). The Failure Rate of a "Fakeout" Is Set by the Definition [F015]. Zenodo.
DOI: 10.5281/zenodo.22891741
YOI: https://www.yamagishiyuuki.com/yoi/F015
ORCID: 0009-0006-8587-3450
PDF (English) · PDF (Japanese) · Date proof of the English PDF (OpenTimestamps .ots) · SHA256SUMS
The record page for this paper (in Japanese, with the PDFs in each language and the date proof): YOI F015. This paper is a preprint and has not been peer reviewed.