Abstract
What this paper asks is whether the result of removing the overlap depends on where you started counting — and the answer is: it does. No new mathematical theorem and no new law is claimed.
First, removing the overlap cuts the count to one hth, and the share of cells whose daily-clustered t reaches 2 in absolute value falls from 0.2750–0.3481 to 0.0443–0.1006. And contrary to the prediction, the realized D moves by a median of 1.1503 pips as well (Section 3).
Second, and this is the core. ★ Holding the thinning width fixed and running the phase from 0 to h−1, the sign of D splits in 0.8000 of the cells. At horizons of 24 and 72 bars it is 1.0000 — every cell (Section 4).
Third, the range is large too. At a horizon of 24 bars, USDJPY runs from −2.1606 to +2.6899, a range of 4.8505 pips. That is many times the spread (Section 4).
Fourth, prediction ③, written before measuring, failed. It said "the phase is the clock, so it should split more than a random draw", but the spread across phases is 0.3911, 0.6569 and 0.8382 times the random one — below 1 (Section 5).
Fifth, ★ the reason is that thinning is stratified sampling. Taking one observation every h bars from a series of overlapping observations takes one from each block, which is more representative than a random draw. So thinning is the right procedure. What this paper objects to is reporting only one phase (Section 5).
Sixth, on a synthetic random walk with zero directional information the sign splits at 0.7342, and phase ÷ random is 0.4340, 0.6302 and 0.7835. ★ The differences are only −0.0429, +0.0267 and +0.0547, so the splitting is a property of the overlapping construction, not of the market (Section 6).
Scope of this paper: No new mathematical theorem and no new law is claimed — overlapping observations, systematic sampling, stratified sampling and random walks are all known. No real course or its proponent is discussed — no real teaching material, author, or vendor is the subject here, and none is named. What this paper inspects is a procedure the author himself has been using. Trading is not discussed — what is measured is directional information, not trading performance including commissions, fills and money management. The scope is intraday and few instruments — four instruments, six years, one-hour bars. Monthly time-series momentum (dozens of markets, one to twelve month holds) is documented in the academic literature and is not contradicted here. One sweep is fixed — four families (Section 7). This paper does not say to discard thinning — what it says is that only one phase must not be reported (Section 5 and Conclusion). What the splitting across phases comes from is not decomposed — clock, weekday and index origin are not separated (Section 7). No forecast is claimed. Relation to earlier papers: F014 showed that a naive t inflates with the number of observations per day and F023 that dropping the top few days is the arithmetic of the dropping — this paper inspects the thinning used as the remedy. What is added is running the phase over all its values, comparing against a random draw of the same size, and doing the same thing on a series with zero directional information.
1. Notation and the question
Measuring h bars ahead while entering on every bar makes two neighbouring observations share h−1 of their h bars. Daily clustering folds only the overlap within a day, so the overlap across days remains. Hence the thinning: take one observation every h bars.
| What gets reported | What does not |
|---|---|
| The value after removing the overlap | Where the counting started |
| That the count fell | What another phase would have given |
| That the daily t fell | What the same procedure does on a series with no edge |
Observation 1.1: "Every h bars" has h ways to start. From the 0th, from the 1st, or from the (h−1)th. All of them go by the same name.
Observation 1.2: ★ So it can be asked: does the answer depend on the phase? If it does, reporting a single phase is having picked one of h.
Observation 1.3: The separator is the phase of the thinning. The cell, the data, the period, the instrument and the thinning width are all held fixed, and only where the counting starts is varied.
Observation 1.4: ★ And two comparison partners are needed: one is a random draw of the same size (is the phase lattice doing anything?), the other is a series with zero directional information by construction (is the splitting a property of the market?).
Question: does the answer after removing the overlap depend on where you started counting?
2. State the quantity and the design first
Predictions (written before running)
① Removing the overlap barely moves D. What moves is the count and the t.
② Changing the phase moves D — of course, since the count falls to one hth.
③ ★ But the phase at a horizon of 24 bars is "which hour of the day you enter at", so it should split more than a random draw of the same size.
④ ★ A synthetic random walk has no clock structure, so the spread across phases and across random draws should agree.
Design (declared before running and not changed during it)
| Item | Decision |
|---|---|
| Grid | One-hour bars, mid prices, completed bars only |
| Moving-average cross | Fast 3, 5, 8, 12, 20, 30 × slow 20, 30, 50, 80, 120, 200 (fast < slow) |
| RSI | Period 7, 14, 21 × threshold 20, 30, 40 |
| Outside a band | Period 10, 20, 40 × multiplier 1.5, 2.0, 2.5, 3.0 |
| High-low breakout | Period 10, 20, 50, 100 |
| Horizon | 6, 24, 72 bars |
| Thinning | One observation every h bars. Phase from 0 to h−1, all of them |
| Control | A random draw of the same size (200 draws) |
| Baseline | Synthetic random walk down to within-bar movement (5 series) |
| Instruments | USDJPY, EURUSD, GBPUSD, XAUUSD |
| Period | 2019–2024 (six years taken as one) |
Observation 2.1: ★ Changing the phase leaves the thinning width and the count essentially unchanged. All that differs is where the counting starts.
Observation 2.2: The phase is cut on the index of the entry bar. On one-hour bars, the phase at a horizon of 24 bars corresponds to the hour of the day.
Observation 2.3: The random-draw control takes the same number of observations again from the same set. If the phase lattice does nothing, the spreads should agree.
The bar counts are 36,534, 36,554, 36,535 and 34,892, and the measurable cells are 160, 158, 158 and 159.
3. What moves and what does not when the overlap is removed
Calculation 3.1 Count and D (phase 0, the version usually written)
| Instrument | Count with overlap | Count at phase 0 | Ratio | D with overlap | D at phase 0 | Median |difference| |
|---|---|---|---|---|---|---|
| USDJPY | 36,343 | 644 | 0.0417 | 0.2470 | 0.2930 | 1.1908 |
| EURUSD | 36,363 | 668 | 0.0417 | 0.2165 | 0.0500 | 0.4981 |
| GBPUSD | 36,344 | 680 | 0.0417 | 0.5352 | 0.5859 | 1.1313 |
| XAUUSD | 34,701 | 600 | 0.0417 | 1.1938 | −0.6744 | 3.2058 |
Calculation 3.2 Share of cells whose daily t reaches 2 in absolute value
| Instrument | With overlap | Phase 0 | Mean over phases | |
|---|---|---|---|---|
| USDJPY | measured | 0.2750 | 0.0688 | 0.0451 |
| USDJPY | random | 0.3846 | 0.1192 | 0.0513 |
| EURUSD | measured | 0.3481 | 0.0570 | 0.0263 |
| EURUSD | random | 0.3667 | 0.1192 | 0.0499 |
| GBPUSD | measured | 0.3165 | 0.0443 | 0.0291 |
| GBPUSD | random | 0.3808 | 0.1115 | 0.0500 |
| XAUUSD | measured | 0.2956 | 0.1006 | 0.0407 |
| XAUUSD | random | 0.4146 | 0.1322 | 0.0498 |
Observation 3.3: The count falls to 0.0417, one hth. And the share of cells whose daily t reaches 2 falls from 0.2750–0.3481 to 0.0443–0.1006. Less than a third.
Observation 3.4: ★ Prediction ① half failed. It said "D barely moves", but the realized value moves by a median of 1.1503 pips. XAUUSD goes from +1.1938 to −0.6744, a change of sign.
Observation 3.5: ★ The expectation does not change; the spread does. With the count cut to one hth, the spread around the same expectation grows by √h. D moved for that reason, not because thinning distorted it.
Observation 3.6: Phase 0 shows more cells with |t|≥2 than the mean over phases (measured 0.0629 against 0.0349, a difference of +0.0279). ★ But the same happens on the synthetic random walk (0.1192 against 0.0499, +0.0693). This is a product of the index origin, not of the clock.
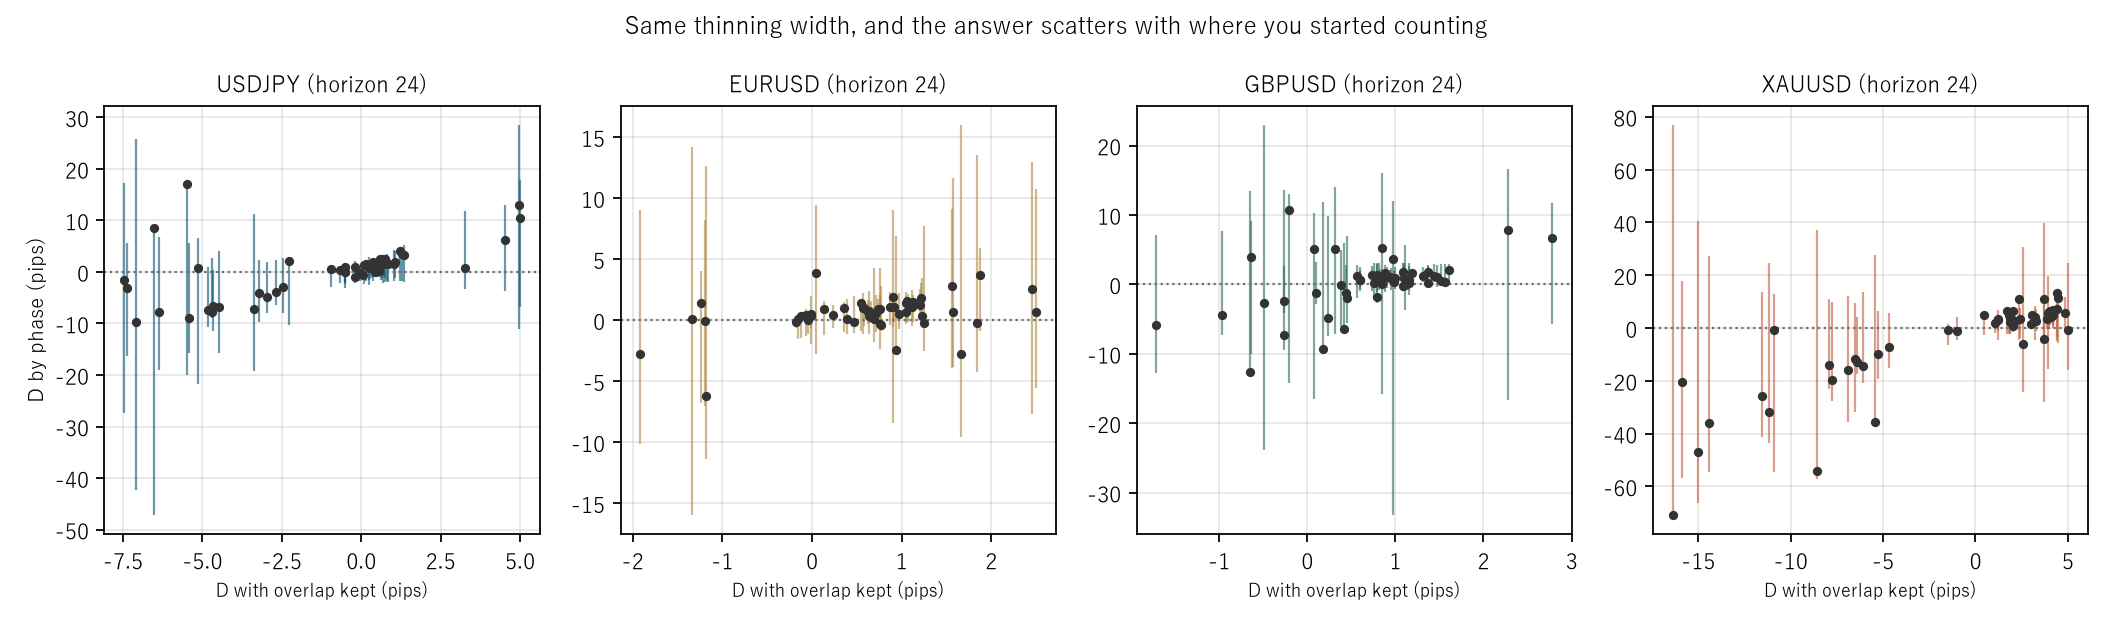
Figure 1: horizontal is D with the overlap kept, vertical is D by phase (horizon 24). The vertical line is that cell's range over its 24 phases, and the dot is phase 0.
4. Does changing the phase change the answer?
Calculation 4.1 D by phase (medians, pips)
| Instrument | Horizon | Phases | D min | D max | Range | Cells whose sign splits |
|---|---|---|---|---|---|---|
| USDJPY | 6 | 6 | −0.0800 | 0.4622 | 0.5422 | 0.3571 |
| USDJPY | 24 | 24 | −2.1606 | 2.6899 | 4.8505 | 1.0000 |
| USDJPY | 72 | 72 | −10.5521 | 12.2166 | 22.7687 | 1.0000 |
| EURUSD | 6 | 6 | −0.0879 | 0.2554 | 0.3433 | 0.5000 |
| EURUSD | 24 | 24 | −1.0221 | 2.2563 | 3.2785 | 0.9815 |
| EURUSD | 72 | 72 | −5.7332 | 6.8096 | 12.5428 | 1.0000 |
| GBPUSD | 6 | 6 | −0.2166 | 0.5022 | 0.7189 | 0.8036 |
| GBPUSD | 24 | 24 | −1.1432 | 2.9903 | 4.1335 | 0.8704 |
| GBPUSD | 72 | 72 | −8.3394 | 12.2613 | 20.6007 | 1.0000 |
| XAUUSD | 6 | 6 | 0.0918 | 1.5334 | 1.4415 | 0.3214 |
| XAUUSD | 24 | 24 | −4.5191 | 8.0146 | 12.5337 | 0.8889 |
| XAUUSD | 72 | 72 | −20.9590 | 28.4987 | 49.4577 | 1.0000 |
Observation 4.2: ★ This is the core. The sign of D splits across phases in 0.8000 of the cells overall. At horizons of 24 and 72 bars it is 1.0000 — every cell.
Observation 4.3: The range is large too. At a horizon of 24 bars, USDJPY runs from −2.1606 to +2.6899, a range of 4.8505 pips; at 72 bars XAUUSD reaches 49.4577 pips.
Observation 4.4: The longer the horizon, the more it splits. At 6 bars it is 0.3214 to 0.8036, and at 72 bars all four are 1.0000. ★ Larger h leaves fewer observations, so this is prediction ② as written.
Observation 4.5: ★ The procedure goes by one name, and the sign of its answer changes with where the counting started. When one writes "removing the overlap flipped the sign", that the flip was not produced by the choice of phase cannot be checked from a single phase.
5. Is the splitting the smaller count, or the phase itself?
Calculation 5.1 Spread across phases against spread across random draws
| Instrument | Horizon | Spread across phases | Spread across random draws | Ratio |
|---|---|---|---|---|
| USDJPY | 6 | 0.2539 | 0.4659 | 0.5450 |
| USDJPY | 24 | 1.4567 | 1.9767 | 0.7369 |
| USDJPY | 72 | 5.5741 | 5.8799 | 0.9480 |
| EURUSD | 6 | 0.1181 | 0.3089 | 0.3821 |
| EURUSD | 24 | 0.7929 | 1.2824 | 0.6183 |
| EURUSD | 72 | 2.9554 | 3.8265 | 0.7723 |
| GBPUSD | 6 | 0.2066 | 0.4485 | 0.4607 |
| GBPUSD | 24 | 1.1092 | 1.8503 | 0.5995 |
| GBPUSD | 72 | 5.1333 | 5.7056 | 0.8997 |
| XAUUSD | 6 | 0.4994 | 1.1281 | 0.4427 |
| XAUUSD | 24 | 3.3680 | 4.8563 | 0.6935 |
| XAUUSD | 72 | 11.9868 | 14.2856 | 0.8391 |
Observation 5.2: ★ Prediction ③ failed. It said "the phase is the clock, so it splits more than a random draw", but the ratio is 0.3911 at 6 bars, 0.6569 at 24 and 0.8382 at 72 — all below 1.
Observation 5.3: ★ The way it failed is informative. Taking one observation every h bars cuts the series of overlapping observations into blocks of h and takes one from each. That is stratified sampling, and it is more representative than a random draw, so its spread is smaller.
Observation 5.4: ★ Thinning is therefore the right procedure. It gives a better estimate than drawing the same number at random. What this paper objects to is not the thinning but reporting only one phase.
Observation 5.5: The ratio approaches 1 as h grows (0.3911 → 0.6569 → 0.8382). ★ Longer blocks make the overlap between neighbouring observations relatively smaller, so the gain from stratifying shrinks.
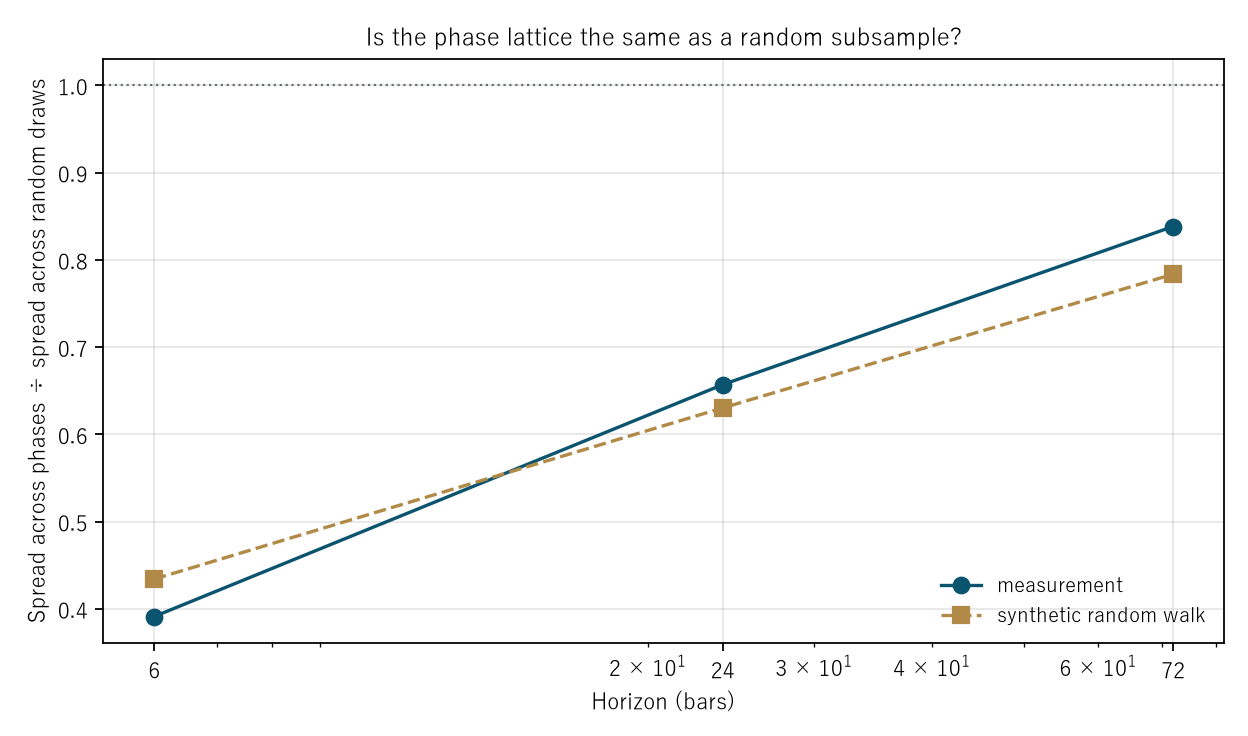
Figure 2: horizontal is the horizon, vertical is "spread across phases ÷ spread across random draws". The dashed line at 1 is where the phase would be just a random subsample.
6. Baseline — do the same thing on a series with zero directional information
Calculation 6.1 The same thing on a synthetic random walk (5 series)
| Instrument | Horizon | Measured phase÷random | Random-walk phase÷random | Measured split | Random-walk split |
|---|---|---|---|---|---|
| USDJPY | 6 | 0.3562 | 0.4433 | 0.3571 | 0.4618 |
| USDJPY | 24 | 0.6793 | 0.6423 | 1.0000 | 0.8077 |
| USDJPY | 72 | 0.9525 | 0.7651 | 1.0000 | 0.9633 |
| EURUSD | 6 | 0.3638 | 0.4281 | 0.5000 | 0.4582 |
| EURUSD | 24 | 0.5911 | 0.6331 | 0.9815 | 0.8115 |
| EURUSD | 72 | 0.7676 | 0.7829 | 1.0000 | 0.9633 |
| GBPUSD | 6 | 0.4063 | 0.4366 | 0.8036 | 0.4655 |
| GBPUSD | 24 | 0.5976 | 0.6448 | 0.8704 | 0.8077 |
| GBPUSD | 72 | 0.8308 | 0.7808 | 1.0000 | 0.9633 |
| XAUUSD | 6 | 0.4450 | 0.4287 | 0.3214 | 0.4562 |
| XAUUSD | 24 | 0.7705 | 0.6085 | 0.8889 | 0.8077 |
| XAUUSD | 72 | 0.7473 | 0.7974 | 1.0000 | 0.9592 |
Observation 6.2: ★ Prediction ④ held. Phase ÷ random is 0.4340, 0.6302 and 0.7835 on the random walk against 0.3911, 0.6569 and 0.8382 on the measurement — essentially the same, with differences of only −0.0429, +0.0267 and +0.0547.
Observation 6.3: ★ The gain from stratifying is therefore not a property of the market. It is a property of having made overlapping observations. The synthetic series has the same overlap and shows the same gain.
Observation 6.4: ★ The splitting is the same too. It is 0.8000 on the measurement against 0.7342 on the random walk, a difference of +0.0658. Even on a series with zero directional information, changing the phase splits the sign.
Observation 6.5: So "removing the overlap flipped the sign" says nothing on its own. ★ The flip happens at a rate of 0.7342 on a series that is right about nothing.
Observation 6.6: This paper does not decompose what the splitting comes from — clock, weekday, or index origin. The phase at a horizon of 24 bars corresponds to the clock, but at 6 and 72 bars it does not. All three split in the same way, so the clock alone does not explain it.
7. Limitations
- ★ Prediction ① half failed and prediction ③ failed outright. D did move, and the spread across phases was smaller than across random draws. This paper writes those failures and does not hide them.
- ★ This paper does not say to discard thinning. As Section 5 shows, thinning works correctly as stratified sampling. What it says is that only one phase must not be reported.
- The splitting across phases is not decomposed into clock, weekday and index origin.
- One sweep is fixed. Four families. Other families or granularities give other figures.
- The thinning width is set equal to the horizon. Taking it longer reduces the overlap further but also the count. That trade-off is not measured.
- The daily t per phase is unstable, since each phase has few days. The share with |t|≥2 in Section 3 must be read with that in mind.
- The synthetic series uses independent normal increments. Volatility clustering is not included.
- Four instruments over six years. Nothing is said about other markets or other periods.
Conclusion
Removing the overlap cuts the count to 0.0417, and the share of cells whose daily t reaches 2 in absolute value falls from 0.2750–0.3481 to 0.0443–0.1006. That much is well known.
But holding the thinning width fixed and changing only where the counting starts, the sign of D splits in 0.8000 of the cells. At horizons of 24 and 72 bars it is 1.0000 — every cell. The range is 4.8505 pips for USDJPY at a horizon of 24 bars and 49.4577 pips for XAUUSD at 72.
The answer after removing the overlap depends on where you started counting.
Prediction ③, written before measuring, failed. The spread across phases is 0.3911 to 0.8382 times the spread across random draws — below 1. ★ The way it failed is informative. Taking one observation every h bars takes one from each block: stratified sampling, more representative than random. ★ So thinning is the right procedure.
And on a synthetic random walk with zero directional information, the sign splits at 0.7342 and phase ÷ random is 0.4340, 0.6302 and 0.7835, essentially matching the measurement. Both the splitting and the gain are properties of the overlapping construction, not of the market.
★ What a report of a de-overlapped result therefore needs is the median and the range over all phases. A single phase is one value out of h, and how much of it was a choice cannot be read from that one value.
Data and reproduction
| Data | FX is Dukascopy-derived tick data (from 2019 onward, confirmed identical down to the millisecond, bid and ask). Gold is Dukascopy |
| Period | 2019–2024 (six years taken as one) |
| Instruments | USDJPY, EURUSD, GBPUSD, XAUUSD |
| Bars | One-hour bars, mid prices, closes of completed bars only. No bar is made where there are no ticks |
| Sweep | Moving-average cross, RSI, outside a band, high-low breakout × horizons of 6, 24 and 72 bars |
| Thinning | One observation every h bars, with the phase from 0 to h−1, all of them |
| Control | A random draw of the same size, 200 draws |
| Verification | 検算/F024.py (--zu also writes the figures). Every figure in the text comes from 検算/F024_output.txt |
| Figures | 図/F024_zu1, 図/F024_zu2 (png, svg, English versions) |
| Random seeds | Fixed. Re-running gives the same values |
| Foundation check | _ツール/audit_bars.py (bar look-ahead, daylight saving, day boundaries). The record is _土台の検査.txt |
References
- Yamagishi, Y. (2026). A Naive t Value Inflates with the Number of Observations per Day [F014]. Zenodo. 10.5281/zenodo.22891694
- Yamagishi, Y. (2026). That the Sign Changes When You Drop the Top Few Days Is a Property of How You Dropped Them [F023]. Zenodo. 10.5281/zenodo.22892131
Reference
Yamagishi, Y. (2026). The Answer You Get After Removing the Overlap Depends on the Phase of the Thinning [F024]. Zenodo.
DOI: 10.5281/zenodo.22892446
YOI: https://www.yamagishiyuuki.com/yoi/F024
ORCID: 0009-0006-8587-3450
PDF (English) · PDF (Japanese) · Date proof of the English PDF (OpenTimestamps .ots) · SHA256SUMS
The record page for this paper (in Japanese, with the PDFs in each language and the date proof): YOI F024. This paper is a preprint and has not been peer reviewed.