Abstract
What this paper asks is whether the annualized Sharpe ratio depends on the interval it was measured on — and the answer is: it does, and the dependence can be written as an identity. No new mathematical theorem and no new law is claimed.
First, the same series gives a different annualized Sharpe at a different interval. The hourly-over-weekly ratio runs from 0.8808 to 1.4094 (median 0.9375) (Section 3).
Second, ★ what moves is only the denominator. The mean times bars per year stays at 0.060000 to 0.060657, while the standard deviation times √bars per year runs from 0.084779 to 0.091200 (Section 5).
Third, and this is the core. ★ The gap can be written with the variance ratio. The difference between the Sharpe ratio and 1 ÷ √variance ratio has a median of −0.000832. Annualizing assumes returns are independent, and the variance ratio is exactly the quantity that measures whether that assumption holds (Section 4).
Fourth, the agreement is a check, not a discovery. It is close to an identity, so it is a failure to agree that should make one suspect the arithmetic (Section 4).
Fifth, but the ratio breaks when the denominator is near zero. GBPUSD always-buy has annualized Sharpes of −0.0320 and −0.0227, essentially zero, so its ratio of 0.7095 means nothing and the difference is −0.271083 (Section 4).
Sixth, ★ and on a synthetic random walk the ratio still scatters from 0.8689 to 1.0422. The measured variance ratio has a median of 0.9493, below 1, but the random walk drops to 0.8001 too, so this paper does not claim mean reversion (Section 6).
Scope of this paper: No new mathematical theorem and no new law is claimed — the Sharpe ratio, the variance ratio and the √ rule for annualizing are all known. No real course or its proponent is discussed — no real teaching material, author, or vendor is the subject here, and none is named. Trading is not discussed — no costs are included, so the figures here are not trading performance (Section 7). The Sharpe ratio = 1 ÷ √variance ratio is close to an identity — the agreement is a check, not a discovery (Section 4). Mean reversion is not claimed — the measured variance ratio falls below 1, but the synthetic random walk falls just as far (Section 6). No risk-free rate is subtracted — the Sharpe ratio here is mean ÷ standard deviation (Section 7). Four intervals are fixed — one hour, four hours, one day, one week (Section 2). The weekly sample is small — 290 to 304 observations per instrument, so the variance ratio is unstable there (Section 7). The scope is intraday and few instruments — four instruments, six years, one-hour bars. Monthly time-series momentum (dozens of markets, one to twelve month holds) is documented in the academic literature and is not contradicted here. No forecast is claimed.
1. Notation and the question
A single annualized Sharpe ratio is often reported and left at that.
| What gets reported | What does not |
|---|---|
| The annualized Sharpe ratio | Which interval's returns were stretched by the √ |
| The period and the instrument | Whether the independence assumption was checked |
| The annualized figure | What another interval would give |
Observation 1.1: ★ Annualizing assumes returns are independent. The variance of k periods is k times the variance of one only under independence, and only then can it be divided back by √k.
Observation 1.2: ★ Without independence, each interval gives a different annualized Sharpe. All from the same data, and all different.
Observation 1.3: The separator is the interval the returns are measured on. The data, the period, the instrument and the series are all held fixed, and only how many bars are summed before measuring is varied.
Observation 1.4: ★ And the size of the gap can be written with the variance ratio: the variance of k periods ÷ (k × the variance of one). Under independence it is 1.
Question: does the annualized Sharpe ratio depend on the interval it was measured on?
2. State the quantity and the design first
Predictions (written before running)
① If returns are independent, every interval gives the same annualized Sharpe ratio.
② If they are not, it shifts, and the direction is set by the variance ratio. Above 1 (positive autocorrelation) means the longer interval gives a smaller Sharpe.
③ ★ The ratio of annualized Sharpe ratios should match 1 ÷ √variance ratio. That is close to an identity, so agreement is a check, not a discovery.
④ ★ On a synthetic random walk with zero directional information, the variance ratio should be 1 and the ratio 1.
Design (declared before running and not changed during it)
| Item | Decision |
|---|---|
| Grid | One-hour bars, mid prices, completed bars only |
| Intervals | 1 bar (one hour) / 4 (four hours) / 24 (one day) / 120 (one week) |
| Series | Always buy (log returns) / multiplied by the sign of the SMA(20) slope |
| Annualizing | √(bars per year). Bars per year comes from the actual bar count |
| Measured | Annualized Sharpe ratio / variance ratio / 1 ÷ √variance ratio |
| Costs | Not included. No risk-free rate subtracted |
| Baseline | Synthetic random walk down to within-bar movement (3 series) |
| Instruments | USDJPY, EURUSD, GBPUSD, XAUUSD |
| Period | 2019–2024 |
Observation 2.1: ★ The sign comes from a quantity known as of the previous bar. The slope of the moving average as of bar i is used for the return from i to i+1. There is no look-ahead.
Observation 2.2: Bars per year comes from the actual bar count. FX stops at the weekend, so rather than dividing by calendar time, the actual number of bars is counted: 5,852 to 6,094 one-hour bars per year.
Observation 2.3: When summing k bars, the remainder is dropped. At one week (120 bars) up to 119 bars are lost, which out of 34,891 to 36,553 bars barely touches the mean.
3. Measuring the same series on four intervals
Calculation 3.1 Annualized Sharpe by interval (always buy)
| Instrument | Interval | Count | Per year | Annualized Sharpe |
|---|---|---|---|---|
| USDJPY | one hour | 36,533 | 6,090 | 0.6672 |
| USDJPY | one day | 1,522 | 254 | 0.6600 |
| USDJPY | one week | 304 | 51 | 0.7155 |
| EURUSD | one hour | 36,553 | 6,094 | −0.2261 |
| EURUSD | one week | 304 | 51 | −0.2237 |
| GBPUSD | one hour | 36,534 | 6,091 | −0.0320 |
| GBPUSD | one week | 304 | 51 | −0.0227 |
| XAUUSD | one hour | 34,891 | 5,852 | 0.7973 |
| XAUUSD | one day | 1,453 | 244 | 0.8103 |
| XAUUSD | one week | 290 | 49 | 0.8076 |
Calculation 3.2 Annualized Sharpe by interval (medians across four instruments)
| Series | One hour | Four hours | One day | One week | Hour ÷ week |
|---|---|---|---|---|---|
| Always buy | 0.3176 | 0.3159 | 0.3143 | 0.3464 | 0.9170 |
| Sign of the slope | 0.2739 | 0.2827 | 0.2636 | 0.2920 | 0.9382 |
Observation 3.3: The same series gives a different annualized Sharpe at a different interval. The hourly-over-weekly ratio runs from 0.8808 to 1.4094 (median 0.9375).
Observation 3.4: ★ XAUUSD on the sign of the slope gives 0.9053 hourly and 1.0278 weekly. The same six years and the same trading, and whether the reported figure is below or above 1 changes.
Observation 3.5: Across all 16 combinations the annualized Sharpe runs from −0.4307 to 1.0278. This paper does not claim those levels, since neither costs nor a risk-free rate are included.
Observation 3.6: The count collapses with the interval, from 36,533 hourly observations to 304 weekly. ★ The spread of the estimate grows by the same amount.
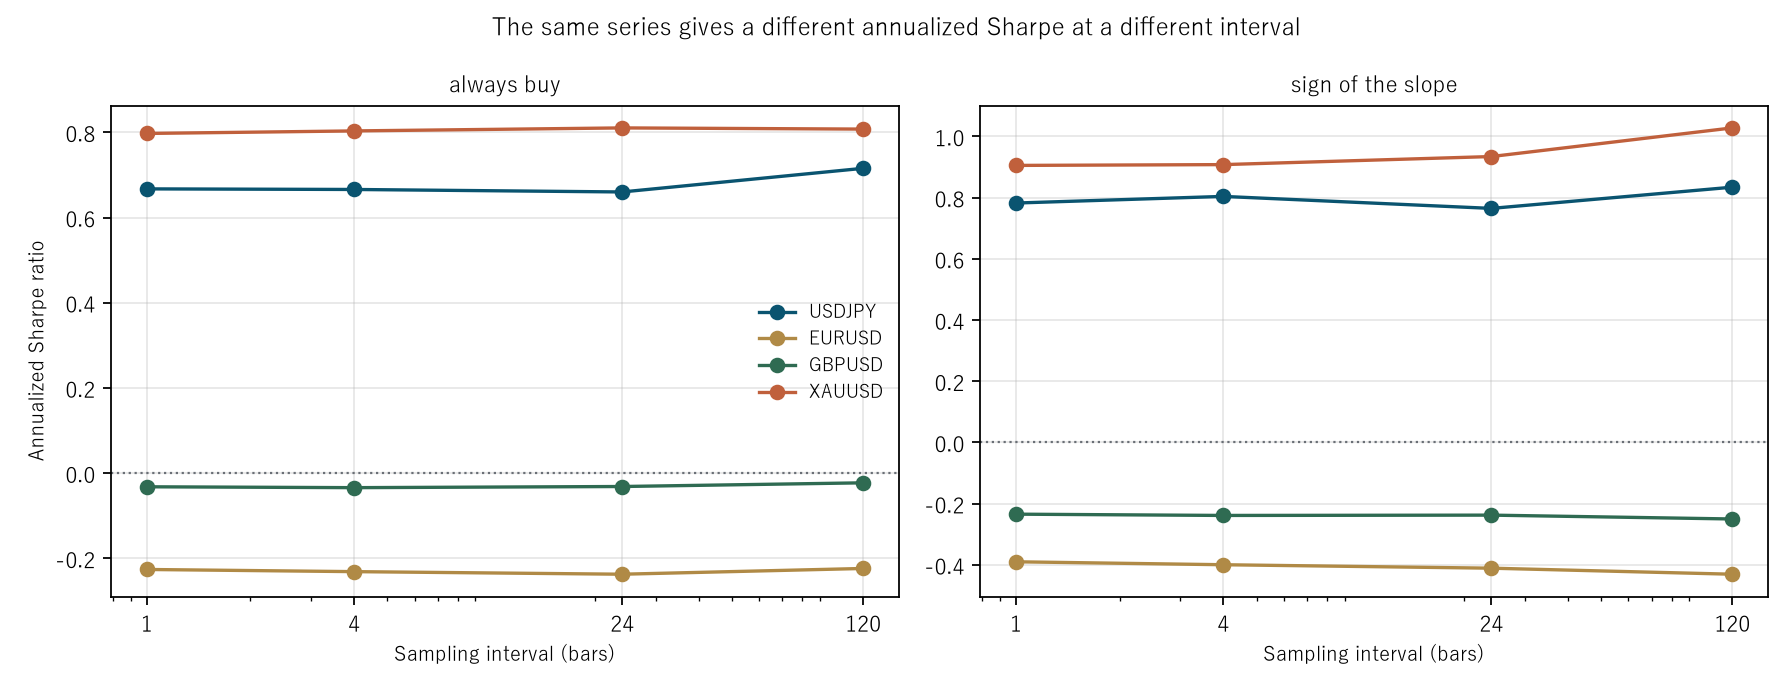
Figure 1: horizontal is the sampling interval (log scale), vertical is the annualized Sharpe ratio. Left is always buy, right is the sign of the slope.
4. The direction of the gap is set by the variance ratio
Calculation 4.1 Variance ratio against the Sharpe ratio
| Series | Instrument | Interval | Variance ratio | 1 ÷ √VR | Sharpe ratio | Difference |
|---|---|---|---|---|---|---|
| Always buy | USDJPY | four hours | 1.0096 | 0.9952 | 0.9979 | 0.0027 |
| Always buy | USDJPY | one day | 1.0286 | 0.9860 | 0.9892 | 0.0032 |
| Always buy | USDJPY | one week | 0.8889 | 1.0607 | 1.0723 | 0.0116 |
| Always buy | XAUUSD | one day | 0.9512 | 1.0253 | 1.0163 | −0.0090 |
| Always buy | GBPUSD | one week | 1.0400 | 0.9806 | 0.7095 | −0.2711 |
| Sign of the slope | USDJPY | one week | 0.8778 | 1.0673 | 1.0662 | −0.0011 |
| Sign of the slope | EURUSD | one week | 0.7520 | 1.1532 | 1.1041 | −0.0491 |
| Sign of the slope | GBPUSD | one day | 0.9906 | 1.0047 | 1.0134 | 0.0087 |
| Sign of the slope | XAUUSD | four hours | 0.9948 | 1.0026 | 1.0029 | 0.0003 |
| Sign of the slope | XAUUSD | one week | 0.7634 | 1.1445 | 1.1354 | −0.0092 |
Observation 4.2: ★ This is the core. The difference between the Sharpe ratio and 1 ÷ √variance ratio has a median of −0.000832. The gap can be written with the variance ratio.
Observation 4.3: The agreement is a check, not a discovery. Annualizing is the act of dividing by √k, and the variance ratio measures the departure from that k-fold growth, so the two write the same thing from opposite sides. ★ It is a failure to agree that should make one suspect the arithmetic.
Observation 4.4: And one case did fail to agree. GBPUSD always-buy at one week differs by −0.2711. ★ Its annualized Sharpes are −0.0320 and −0.0227, essentially zero, so the ratio of 0.7095 means nothing. When the denominator is near zero, the ratio breaks.
Observation 4.5: The variance ratio runs from 0.7520 to 1.0521 (median 0.9493), above 1 in 4 of 24 cases. Most fall below 1 — variance growing less than k-fold — but whether that is mean reversion is settled in Section 6.
Observation 4.6: ★ Annualizing makes an assumption: that returns are independent, so the variance of k periods is k times the variance of one. The variance ratio is exactly the quantity that measures whether that assumption holds.
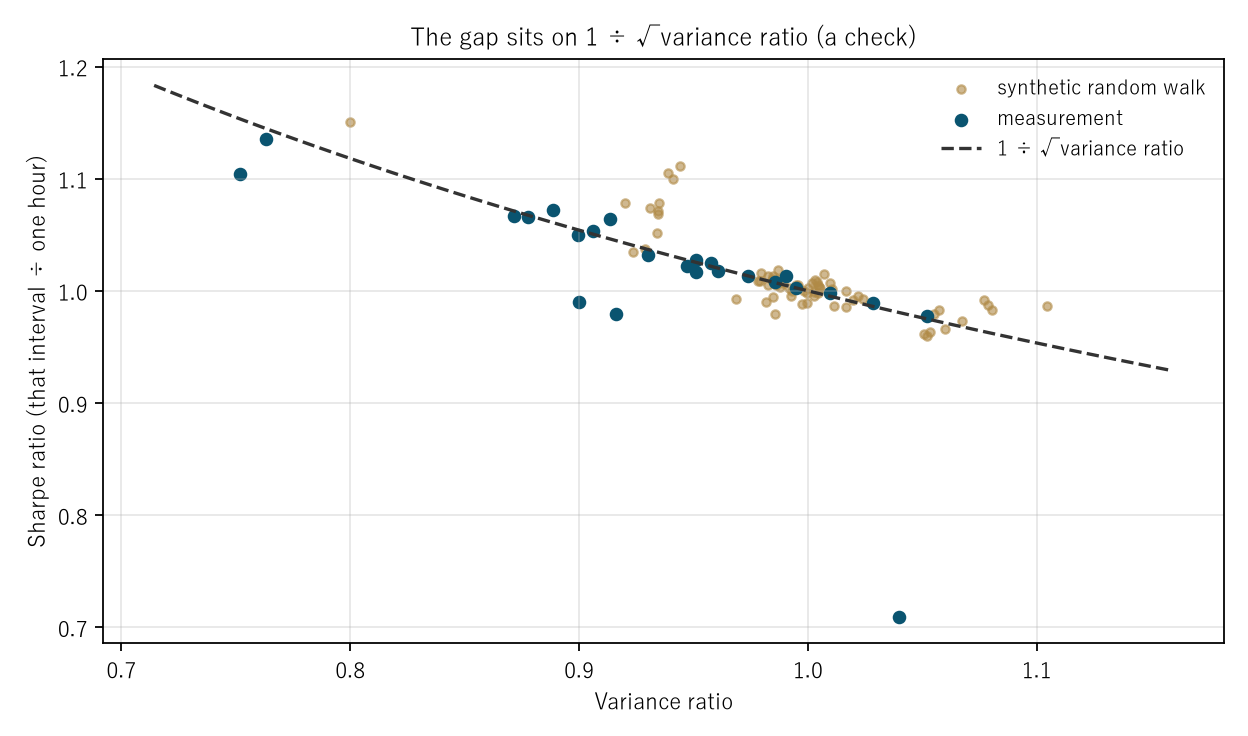
Figure 2: horizontal is the variance ratio, vertical is the Sharpe ratio (that interval ÷ one hour). The dashed line is 1 ÷ √variance ratio; points on it mean the identity holds.
5. Is it the numerator that moves, or the denominator?
Calculation 5.1 Mean and standard deviation, printed as they are (USDJPY)
| Series | Interval | Mean | Standard deviation | Mean × per year | SD × √per year |
|---|---|---|---|---|---|
| Always buy | one hour | 0.00000985 | 0.00115227 | 0.060000 | 0.089924 |
| Always buy | four hours | 0.00003951 | 0.00231560 | 0.060163 | 0.090355 |
| Always buy | one day | 0.00023720 | 0.00572508 | 0.060194 | 0.091200 |
| Always buy | one week | 0.00119514 | 0.01190036 | 0.060657 | 0.084779 |
| Sign of the slope | one hour | 0.00001155 | 0.00115195 | 0.070327 | 0.089899 |
| Sign of the slope | four hours | 0.00004630 | 0.00224689 | 0.070489 | 0.087675 |
| Sign of the slope | one day | 0.00027790 | 0.00578841 | 0.070521 | 0.092209 |
| Sign of the slope | one week | 0.00138425 | 0.01182304 | 0.070254 | 0.084229 |
Observation 5.2: ★ The mean times bars per year is essentially the same at every interval: 0.060000 to 0.060657 for always buy, 0.070254 to 0.070521 for the sign of the slope.
Observation 5.3: ★ That is as it must be. The sum of log returns does not depend on how many are grouped together, so if this moved, the arithmetic would be broken.
Observation 5.4: ★ What moves is the standard deviation times √bars per year: 0.084779 to 0.091200 for always buy, 0.084229 to 0.092209 for the sign of the slope.
Observation 5.5: ★ So the annualized Sharpe moves because of the denominator. The same profit is divided by a different amount of "risk".
Observation 5.6: And which interval is right is not settled here. ★ What settles it is the time scale on which the account is watched, not the data. Someone who looks at the account daily and someone who looks weekly face a different size of risk from the same trading.
6. Baseline — do the same thing on a series with zero directional information
Calculation 6.1 Measurement against synthetic random walk (medians across four instruments)
| Series | Interval | Variance ratio | Annualized Sharpe | |
|---|---|---|---|---|
| Always buy | one hour | measured | 1.0000 | 0.3176 |
| Always buy | one hour | random | 1.0000 | 0.4494 |
| Always buy | one day | measured | 0.9337 | 0.3143 |
| Always buy | one day | random | 1.0008 | 0.4532 |
| Always buy | one week | measured | 0.9369 | 0.3464 |
| Always buy | one week | random | 1.0514 | 0.4409 |
| Sign of the slope | one day | measured | 0.9604 | 0.2636 |
| Sign of the slope | one day | random | 0.9875 | 0.4896 |
| Sign of the slope | one week | measured | 0.8174 | 0.2920 |
| Sign of the slope | one week | random | 0.9401 | 0.4786 |
Observation 6.2: Prediction ④ held at the median. The random walk's variance ratio has a median of 0.9958 (the theoretical value is 1) and its hourly-over-weekly ratio a median of 0.9834.
Observation 6.3: But the random walk scatters widely too. Its variance ratio runs from 0.8001 to 1.1044 and its ratio from 0.8689 to 1.0422. ★ That a series built independent scatters this much is because the weekly sample is only 290 to 304 observations.
Observation 6.4: ★ So the measured variance ratio falling below 1 (median 0.9493) cannot be taken as evidence of mean reversion. The random walk falls to 0.8001 as well. That this baseline has no magnitude structure was measured in [F033].
Observation 6.5: The measured ratio's median of 0.9375 is lower than the random walk's 0.9834. ★ That may be a sign of mean reversion, but the ranges overlap, so this paper does not claim it as an effect.
Observation 6.6: ★ The identity side, by contrast, holds equally on both. What this paper claims is that side: the annualized Sharpe depends on the interval, and the dependence can be written with the variance ratio.
7. Limitations
- The Sharpe ratio = 1 ÷ √variance ratio is close to an identity. The agreement is a check, not a discovery. This paper says so.
- The ratio breaks when the denominator is near zero. GBPUSD always-buy has a Sharpe of essentially zero, so its ratio of 0.7095 means nothing.
- Mean reversion is not claimed. The measured variance ratio falls below 1, but the synthetic random walk falls just as far.
- The weekly sample is small: 290 to 304 observations per instrument, so the variance ratio is unstable there.
- No risk-free rate is subtracted. The Sharpe ratio here is mean ÷ standard deviation.
- No costs are included. The figures here are therefore not trading performance.
- Four intervals are fixed, and the remainder is dropped when summing.
- Four instruments over six years. Nothing is said about other markets or other periods.
Conclusion
The same series was measured on four intervals: one hour, four hours, one day and one week. The ratio of annualized Sharpe ratios (hour over week) runs from 0.8808 to 1.4094, with a median of 0.9375. ★ XAUUSD on the sign of the slope gives 0.9053 hourly and 1.0278 weekly: the same six years and the same trading, and whether the reported figure is below or above 1 changes.
★ What moves is only the denominator. The mean times bars per year stays at 0.060000 to 0.060657, because the sum of log returns does not depend on how many are grouped together (if it moved, the arithmetic would be broken). What moves is the standard deviation times √bars per year (0.084779 to 0.091200).
The same profit is divided by a different amount of "risk".
★ And the gap can be written with the variance ratio. The difference between the Sharpe ratio and 1 ÷ √variance ratio has a median of −0.000832. The agreement is a check, not a discovery. Annualizing assumes returns are independent so that the variance of k periods is k times the variance of one, and the variance ratio is exactly the quantity that measures whether that holds.
One case did fail to agree. GBPUSD always-buy at one week differs by −0.2711, because its annualized Sharpes of −0.0320 and −0.0227 are essentially zero and the ratio of 0.7095 means nothing. When the denominator is near zero, the ratio breaks.
The measured variance ratio has a median of 0.9493, below 1, but this paper does not claim mean reversion, because the synthetic random walk falls to 0.8001 as well. With only 290 to 304 weekly observations, even an independently built series scatters this much.
★ So a report of an annualized Sharpe ratio needs the interval it was measured on. And which interval is right is not settled by the data. What settles it is the time scale on which the account is watched. Someone who looks daily and someone who looks weekly face a different size of risk from the same trading.
Data and reproduction
| Data | FX is Dukascopy-derived tick data (from 2019 onward, confirmed identical down to the millisecond, bid and ask). Gold is Dukascopy |
| Period | 2019–2024 (six years) |
| Instruments | USDJPY, EURUSD, GBPUSD, XAUUSD |
| Bars | One-hour bars, mid prices, closes of completed bars only. No bar is made where there are no ticks |
| Intervals | 1, 4, 24 and 120 bars (one hour, four hours, one day, one week). The remainder is dropped |
| Series | Always buy (log returns) / multiplied by the sign of the SMA(20) slope |
| Annualizing | √(bars per year), with bars per year from the actual bar count |
| Costs | Not included. No risk-free rate subtracted |
| Verification | 検算/F032.py (--zu also writes the figures). Every figure in the text comes from 検算/F032_output.txt |
| Figures | 図/F032_zu1, 図/F032_zu2 (png, svg, English versions) |
| Random seeds | Fixed. Re-running gives the same values |
| Foundation check | _ツール/audit_bars.py (bar look-ahead, daylight saving, day boundaries). The record is _土台の検査.txt |
References
- Yamagishi, Y. (2026). A Synthetic Random Walk Has No Volatility Clustering [F033]. Zenodo. 10.5281/zenodo.22893674
Reference
Yamagishi, Y. (2026). The Sharpe Ratio Belongs to the Interval You Measured It On [F032]. Zenodo.
DOI: 10.5281/zenodo.22893620
YOI: https://www.yamagishiyuuki.com/yoi/F032
ORCID: 0009-0006-8587-3450
PDF (English) · PDF (Japanese) · Date proof of the English PDF (OpenTimestamps .ots) · SHA256SUMS
The record page for this paper (in Japanese, with the PDFs in each language and the date proof): YOI F032. This paper is a preprint and has not been peer reviewed.