Abstract
What this paper asks is this: when someone says a correlation broke down, is it the correlation that broke or the window — and the answer depends on the length of the window. No new mathematical theorem and no new law is claimed.
First, a single correlation number means nothing until the window length is fixed. Rolling six pairs of one-hour returns through non-overlapping windows, the range of the values across windows has a median of 1.7901 for one-day windows and 0.4860 for three-month windows. The two series, the period and the sampling interval are the same; only the window length differs (Section 4).
Second, even a pair with a strong full-period correlation takes the opposite sign in short windows. The share of one-day windows with the opposite sign has a median of 0.1000 across the six pairs. EURUSD-GBPUSD, at +0.6769 over the whole period, falls to −0.4309 in a one-day window (Section 4).
Third, ★ part of that scatter has nothing to do with the correlation. A synthetic pair whose true correlation is fixed and constant still gives a one-day range of 1.1231 and a sign-flip share of 0.0355. The correlation cannot move by construction, yet it appears to move (Section 5).
Fourth, and this is the core of the paper: ★ prediction ③ failed. The synthetic pair does not account for all of it. The ratio of the standard deviations (measurement ÷ synthetic) is 1.6108 in one-day windows but widens to 5.7564 in three-month windows. In short windows most of the scatter is the window; in long windows most of it is real variation (Sections 5 and 7).
Fifth, ★ the way they shrink separates them. The synthetic pair's standard deviation shrinks 8.1360 times from one day to three months, close to the 7.7460 that 1/√window predicts. The measurement shrinks only 2.2767 times. What fails to shrink is what is really moving (Section 5).
Sixth, some things do not move. The difference between the mean of the windowed correlations and the full-period value has a median of 0.0095 across 24 combinations. The window length changes not the one number itself but only the scatter of its estimate (Section 6).
Scope of this paper: no new mathematical theorem and no new law is claimed — estimation error in correlation, the Epps effect and time-varying correlation are all known. No real course, author, or vendor is the subject here, and none is named. No trading is discussed — this paper treats only how a correlation is measured, and measures neither the merits of diversification nor any trading performance (Section 7). No mechanism for time-varying correlation is offered — why it moves is not the question here (Section 7). The size of the variation is not estimated — the paper shows only that the measurement scatters more than the synthetic pair, and does not model the real movement (Section 7). One-hour bars and six pairs are fixed (Section 7). The scope is intraday and few instruments — four instruments over six years. Results documented at longer holding periods, such as monthly time-series momentum, are not contradicted. No prediction is claimed.
1. Notation and the question
"These two are correlated at 0.8, so they are not diversification." "The correlation broke down in March." Both are written often.
| What gets said | What does not get said |
|---|---|
| The correlation is 0.8 | Over what length of window it was measured |
| The correlation broke down | Whether a short enough window makes it look broken when it is not |
| The two are uncorrelated, so this is diversification | From what sampling interval the returns were taken |
Observation 1.1: A correlation is not a number but an estimate. With few points in the window, the estimate scatters even when the true value does not move. Line the scattered estimates up in time and the correlation appears to move.
Observation 1.2: ★ So separating "appears to move" from "moves" requires a pair known not to move. Run the same procedure on a synthetic pair whose true correlation is fixed and constant, and see whether the measurement scatters more.
Observation 1.3: The separator is the length of the window measured over. The instruments, the period and the sampling interval are all held fixed, and only the window length is changed.
Question: when a correlation appears to move, is it the correlation that moves or the window?
2. State the quantities and the design first
Declared before the run and unchanged during it.
| Grid | 1-hour bars (mid price, completed bars only) |
| Alignment | Only timestamps common to all four instruments (inner join) |
| Pairs | Six pairs from four instruments |
| Intervals | 1 / 4 / 24 / 120 bars (one hour, four hours, one day, one week) |
| Windows | 24 / 120 / 480 / 1440 bars (one day, one week, one month, three months). Non-overlapping. Remainders discarded |
| Quantities | Pearson correlation; per-window minimum, maximum, range and standard deviation; share of windows whose sign differs from the full period; window mean minus full period |
| Baseline | A synthetic pair whose true correlation is fixed at the full-period value (3 draws) |
| Separator | The length of the window measured over |
| Instruments and period | USDJPY, EURUSD, GBPUSD, XAUUSD / 2019–2024 |
Observation 2.1: The windows do not overlap. Overlapping rolling windows share points with their neighbours, which makes the scatter look artificially small. What the answer depends on once the overlap is removed was measured in [F024]. This paper does not overlap them in the first place.
Observation 2.2: ★ The baseline is not the one this series usually uses. The usual synthetic random walk builds a single series; that it is zero for direction and zero for magnitude as well was measured in [F033]. What is needed here is the relation between two series, so a pair carrying a correlation was built anew.
Observation 2.3: The construction is simple. From two independent normal draws z₁ and z₂, take x = z₁ and y = ρ·z₁ + √(1−ρ²)·z₂. The per-bar correlation is then identically ρ and does not move in time. For ρ, each pair's full-period value is used.
Observation 2.4: Aligning four instruments costs bars. The common timestamps number 33,502, which is 0.9165 to 0.9602 of the original bars. After alignment there are 33,501 returns.
Predictions (written before measuring)
① A longer interval raises the absolute value of the correlation (the Epps effect; known).
② A shorter window widens the range of the rolling correlation, and the widening should be close to 1/√window.
③ A synthetic pair whose true correlation is fixed and constant should widen by the same amount. ⇒ A correlation that appears to move in a short window is not, on its own, evidence that the relation changed.
④ Even a pair with a strong full-period correlation should produce windows with the opposite sign when the window is short.
⑤ The mean of the rolling correlations should be close to the full-period value (a check, not a finding).
3. The same two series at four intervals
Calculation 3.1 The full-period correlation at each interval
The data and the period are the same; only how many bars are summed before taking the correlation differs.
| Pair | One hour | Four hours | One day | One week | Week ÷ hour |
|---|---|---|---|---|---|
| USDJPY-EURUSD | −0.4303 | −0.4305 | −0.4294 | −0.4365 | 1.0144 |
| USDJPY-GBPUSD | −0.3448 | −0.3545 | −0.3396 | −0.3346 | 0.9704 |
| USDJPY-XAUUSD | −0.3658 | −0.3690 | −0.3519 | −0.3656 | 0.9994 |
| EURUSD-GBPUSD | +0.6769 | +0.6851 | +0.6642 | +0.7804 | 1.1529 |
| EURUSD-XAUUSD | +0.3687 | +0.3662 | +0.3787 | +0.5075 | 1.3764 |
| GBPUSD-XAUUSD | +0.3192 | +0.3307 | +0.3277 | +0.4354 | 1.3643 |
Observation 3.2: The week ÷ hour ratio of absolute values has a median of 1.0836 and a range of 0.9704 to 1.3764. It exceeds 1 for 4 of the six pairs.
Observation 3.3: Prediction ① held, but the size is small. The median absolute value rises only from 0.3673 at one hour to 0.4360 at one week. ★ One-hour bars are already coarse enough that the Epps effect has almost died out. What this section establishes is that the interval does not move the answer much.
Observation 3.4: ★ The two pairs that move most both include gold (1.3764 and 1.3643). Gold and foreign exchange overlap differently in trading hours, so a fine interval may not capture what moved together, but this paper does not measure that.
Observation 3.5: The count falls with the interval. The 33,501 returns at one hour become 279 at one week.
4. The same two series rolled through four window lengths
The sampling interval is fixed at one hour. Only the window length differs.
Calculation 4.1 Summary by window length (median of the six pairs)
| Window | Windows | Range | SD | Sign flipped | Mean − full period |
|---|---|---|---|---|---|
| One day | 1,395 | 1.7901 | 0.2936 | 0.1000 | +0.0023 |
| One week | 279 | 1.2002 | 0.2128 | 0.0466 | +0.0037 |
| One month | 69 | 0.8121 | 0.1674 | 0.0145 | +0.0023 |
| Three months | 23 | 0.4860 | 0.1289 | 0.0000 | −0.0021 |
Observation 4.2: ★ The range moves 3.6836 times, from 1.7901 at one day to 0.4860 at three months. The one-day range of 1.7901 is close to nine tenths of the entire interval a correlation can occupy (−1 to +1, a width of 2).
Observation 4.3: The share of windows with the opposite sign falls from 0.1000 at one day to 0.0000 at three months. ★ One window in ten carries the opposite sign to the full period.
Calculation 4.4 The strongest pair and the weakest
| Pair (full period) | Window | Minimum | Maximum | Range | Sign flipped |
|---|---|---|---|---|---|
| EURUSD-GBPUSD (+0.6769) | One day | −0.4309 | +0.9795 | 1.4104 | 0.0122 |
| EURUSD-GBPUSD (+0.6769) | Three months | +0.4338 | +0.8405 | 0.4067 | 0.0000 |
| GBPUSD-XAUUSD (+0.3192) | One day | −0.9235 | +0.9735 | 1.8970 | 0.1505 |
| GBPUSD-XAUUSD (+0.3192) | Three months | −0.1550 | +0.6376 | 0.7926 | 0.0435 |
Observation 4.5: ★ Even the pair at +0.6769 over the whole period falls to −0.4309 in a one-day window. The very pair described as highly correlated moves the other way if you look at one particular day.
Observation 4.6: It is worse for the weak pair. GBPUSD-XAUUSD scatters from −0.9235 to +0.9735 in one-day windows, and a sign-flip share of 0.0435 survives even at three months.
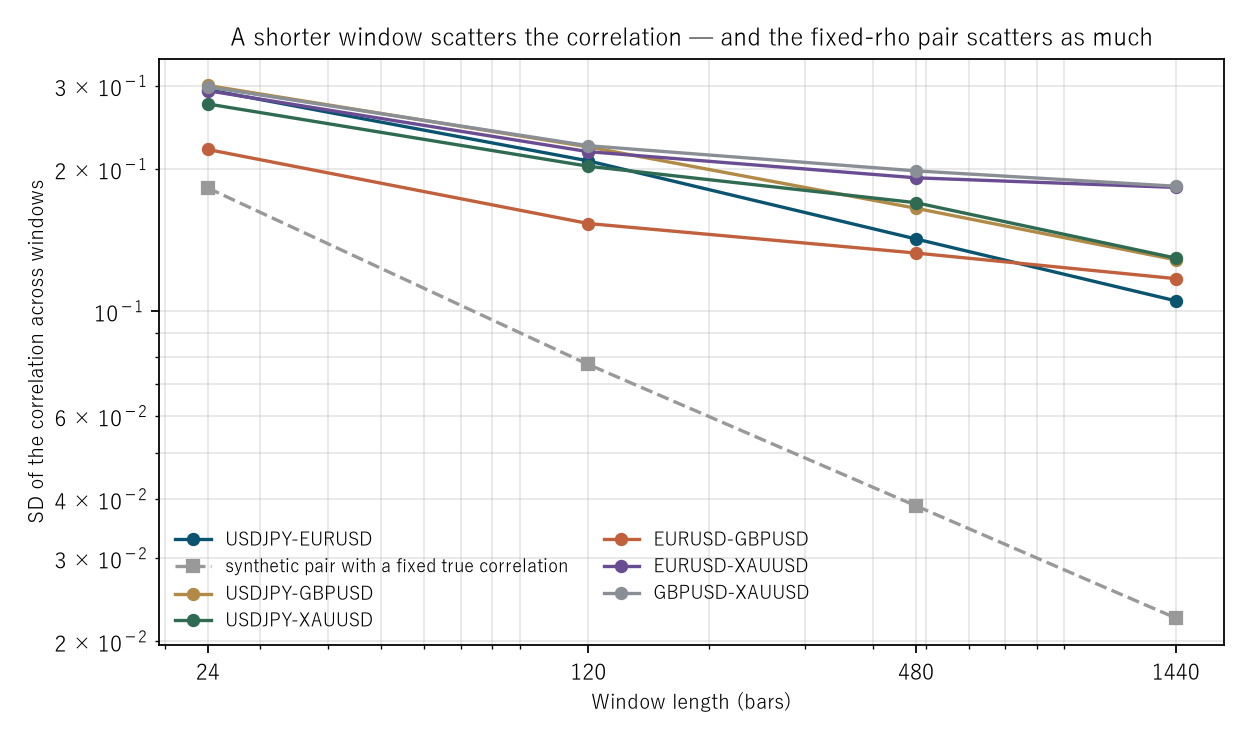
Figure 1: window length on the horizontal axis and the standard deviation of the correlation across windows on the vertical (both logarithmic). The coloured lines are the six measured pairs; the grey dashed line is the synthetic pair with a fixed true correlation.
5. The baseline — the same procedure on a pair with a fixed correlation
By construction this pair's correlation does not move in time. Measured through windows, it scatters anyway.
Calculation 5.1 The synthetic pair (median of six pairs × 3 draws) and the ratio to the measurement
| Window | Synthetic range | Synthetic SD | Synthetic sign flipped | Range ratio | SD ratio |
|---|---|---|---|---|---|
| One day | 1.1231 | 0.1823 | 0.0355 | 1.5939 | 1.6108 |
| One week | 0.4243 | 0.0771 | 0.0000 | 2.8283 | 2.7601 |
| One month | 0.1831 | 0.0387 | 0.0000 | 4.4339 | 4.3252 |
| Three months | 0.0980 | 0.0224 | 0.0000 | 4.9585 | 5.7564 |
Observation 5.2: Even a pair whose correlation does not move gives a one-day range of 1.1231 and a sign-flip share of 0.0355. ★ A correlation that appears to move in a short window is not by itself evidence that the relation changed.
Observation 5.3: ★ But prediction ③ failed. The ratio of standard deviations has a median of 3.5426: the measurement scatters distinctly more than the synthetic pair. "The window explains all of it" does not hold.
Observation 5.4: ★ The way it failed is the answer. The ratio widens from 1.6108 at one day to 5.7564 at three months — the longer the window, the wider it gets. In short windows most of the scatter is the window; in long windows most of it is real variation.
Calculation 5.5 The difference in how they shrink
| One day | Three months | Shrink factor | |
|---|---|---|---|
| Synthetic pair | 0.1823 | 0.0224 | 8.1360 |
| Measurement | 0.2936 | 0.1289 | 2.2767 |
| 1/√window predicts | — | — | 7.7460 |
Observation 5.6: ★ The synthetic pair sits on 1/√window (8.1360 against 7.7460). Estimation scatter is set by the number of points in the window alone, so it must.
Observation 5.7: ★ The measurement does not. It shrinks only 2.2767 times. Something remains that a longer window does not remove, and that is what is really moving. ★ This paper does not estimate how large that part is. What it shows is that it remains.
Observation 5.8: The sign flips take the same shape. In one-day windows the measurement is 0.1000 against 0.0355 on the synthetic pair (which flips too), but beyond one week the synthetic pair goes to 0.0000 while the measurement keeps 0.0466 down to 0.0145.
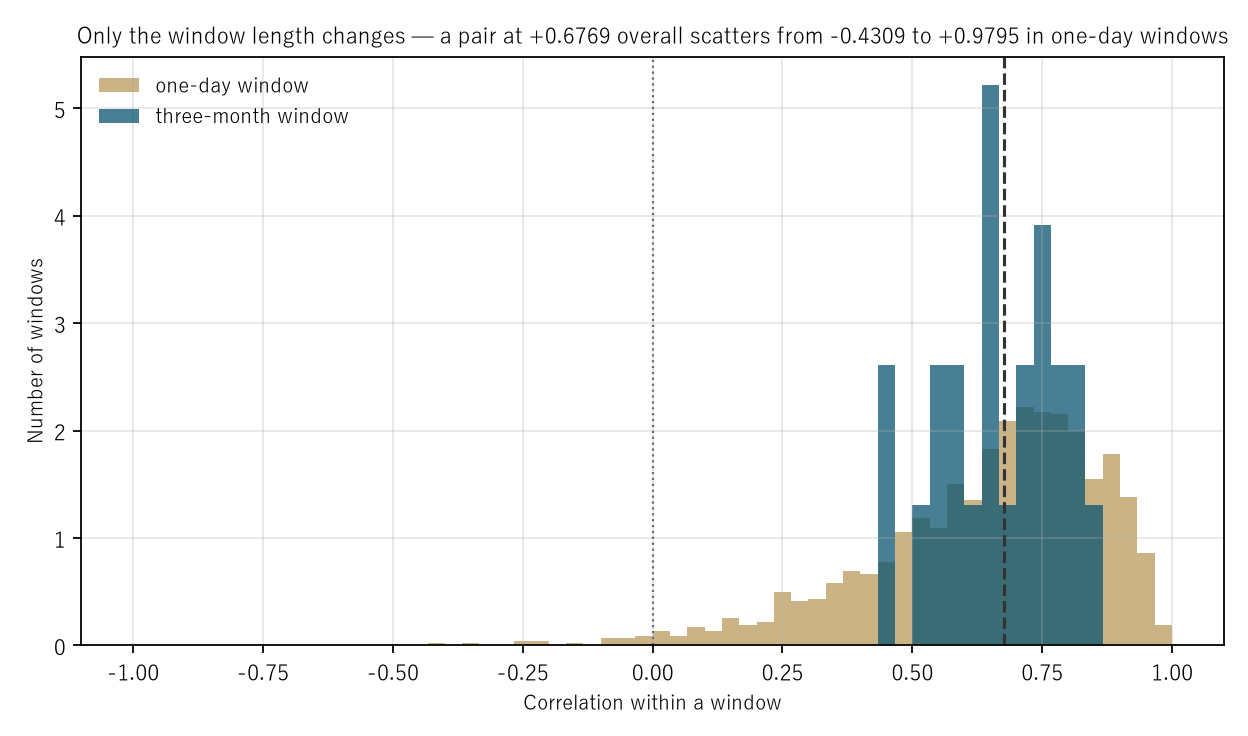
Figure 2: the distribution of windowed correlations for EURUSD-GBPUSD, the pair with the largest full-period absolute correlation. The lighter histogram is one-day windows, the darker is three-month windows, and the dashed line is the full-period value.
6. What does not move (checks)
Agreement here is a check, not a finding.
Observation 6.1: A correlation does not change when a series is multiplied by a constant or shifted by one. Multiplying one side by 137 and adding 5, and multiplying the other by 0.011 and subtracting 3, leaves an absolute difference of at most 0.000000 across the six pairs.
Observation 6.2: corr(A,B) and corr(B,A) are the same. The absolute difference is at most 0.000000 across the six pairs.
Observation 6.3: ★ The mean of the windowed correlations returns to the full-period value. The absolute difference has a median of 0.0095 and a maximum of 0.0642 across 24 combinations. Prediction ⑤ held.
Observation 6.4: ★ That is what licenses the conclusion. The full-period correlation is one and the same number whatever window length is used. What the window length changes is not that number but only the scatter of its estimate. ★ When someone says a correlation broke down, what broke is not the mean but the appearance of the scatter around it.
7. Limitations
- Prediction ③ failed. The synthetic pair does not account for the scatter; the measurement scattered 3.5426 times as much. This paper writes that failure and uses the way it failed — the ratio widening with the window — as the answer.
- The size of the variation is not estimated. That the measurement scatters more than the synthetic pair is shown; how much the real correlation moves is not modelled.
- No mechanism for the variation is offered. Why it moves is not the question here.
- Prediction ① barely moved anything. At one-hour bars the Epps effect has almost died out, and the median absolute value rises only from 0.3673 to 0.4360. A finer grid could give a different answer.
- Why the interval matters more for pairs including gold is not investigated. Different overlap in trading hours is a plausible reading, but it was not measured.
- Aligning four instruments costs bars. Using only common timestamps leaves 0.9165 to 0.9602 of the original bars.
- The windows do not overlap. The scatter under overlapping windows is not measured here.
- One-hour bars, six pairs, six years. Nothing is claimed about other markets, other periods or other bar sizes.
Conclusion
"These two are correlated at 0.8, so they are not diversification." "The correlation broke down in March." Neither sentence says over what length of window it was measured.
Six pairs of one-hour returns were rolled through non-overlapping windows. The range of the values across windows has a median of 1.7901 for one-day windows — close to nine tenths of the entire interval a correlation can occupy (a width of 2). For three-month windows it falls to 0.4860. The two series, the period and the sampling interval are the same; only the window length differs.
★ Even EURUSD-GBPUSD, at +0.6769 over the whole period, falls to −0.4309 in a one-day window. Across the six pairs, the median share of one-day windows carrying the opposite sign to the full period is 0.1000.
★ But part of that scatter has nothing to do with the correlation. A synthetic pair whose true correlation is fixed and constant still gives a one-day range of 1.1231 and a sign-flip share of 0.0355. It cannot move by construction, yet it appears to move.
★ And the prediction failed. The measurement scatters more than the synthetic pair: the ratio of standard deviations has a median of 3.5426. "The window explains all of it" did not hold.
★ The way it failed is the answer. The ratio widens from 1.6108 at one day to 5.7564 at three months — the longer the window, the wider it gets. The synthetic pair shrinks 8.1360 times, as 1/√window requires, while the measurement shrinks only 2.2767 times. In short windows most of the scatter is the window; in long windows most of it is real variation.
Meanwhile the mean of the windowed correlations returns to the full-period value (median difference 0.0095). What the window length changes is not the one number itself but only the scatter of its estimate.
So what is needed when reporting a correlation as a single number is the length of the window. ★ And what is needed when saying a correlation broke down is the same window measured on a pair that cannot move. If it did not scatter more than that, what broke was not the correlation but the window.
Data and reproduction
| Data | Foreign exchange from Dukascopy-derived ticks (from 2019 onward, matching to the millisecond, bid and ask, has been verified). Gold from Dukascopy |
| Period | 2019–2024 (six years) |
| Instruments | USDJPY, EURUSD, GBPUSD, XAUUSD (six pairs) |
| Bars | 1-hour, mid price, closes of completed bars only. Bars with no ticks are not created |
| Alignment | Only timestamps common to all four instruments (33,502 bars, 33,501 returns) |
| Quantity | Pearson correlation of log returns |
| Intervals | 1, 4, 24, 120 bars |
| Windows | 24, 120, 480, 1440 bars. Non-overlapping. Remainders discarded |
| Baseline | A synthetic pair with the true correlation fixed at the full-period value (3 draws): x = z₁, y = ρ·z₁ + √(1−ρ²)·z₂ |
| Verification | 検算/F034.py (--zu also writes the figures). Every number in the text comes from 検算/F034_output.txt |
| Figures | 図/F034_zu1, 図/F034_zu2 (png, svg, English versions) |
| Random seeds | Fixed. Re-running gives the same values |
| Substrate check | _ツール/audit_bars.py (bar look-ahead, daylight saving, day boundary). The record is _土台の検査.txt |
References
- Yamagishi, Y. (2026). The Answer You Get After Removing the Overlap Depends on the Phase of the Thinning [F024]. Zenodo. 10.5281/zenodo.22892446
- Yamagishi, Y. (2026). A Synthetic Random Walk Has No Volatility Clustering [F033]. Zenodo. 10.5281/zenodo.22893674
Reference
Yamagishi, Y. (2026). In a Short Window the Window Moves the Correlation; in a Long Window the Correlation Moves [F034]. Zenodo.
DOI: 10.5281/zenodo.22893806
YOI: https://www.yamagishiyuuki.com/yoi/F034
ORCID: 0009-0006-8587-3450
PDF (English) · PDF (Japanese) · Date proof of the English PDF (OpenTimestamps .ots) · SHA256SUMS
The record page for this paper (in Japanese, with the PDFs in each language and the date proof): YOI F034. This paper is a preprint and has not been peer reviewed.