Abstract
What this paper asks is this: when a threshold is written as a number, what does that number belong to — and the answer is that the number belongs to the grid while the ordering does not. No new mathematical theorem and no new law is claimed.
First, the same "twenty pips" is a completely different event on a different grid. For USDJPY, a bar moving more than twenty pips is the top 0.0048 on five-minute bars and the top 0.2747 on four-hour bars. One event in two hundred and one event in four are written with the same number (Section 3).
Second, ★ the threshold giving the same firing rate moves 7.0304 times when the grid is made 48 times longer. And that factor sits on the diffusive prediction √48 = 6.9282 to within +0.1022 (Section 3).
Third, and this is the core of the paper: ★ line them up by firing rate and the shape overlaps across grids. The layer ratio — the four-hour forward move on the fired side divided by the same quantity over everything — has a maximum ÷ minimum across the four grids of 1.0315 at the median. The threshold moves 7.0304 times; the layer ratio moves 1.0315 times (Section 4).
Fourth, the ordering does not belong to the grid either. Lowering the firing rate from 0.30 to 0.01 raises the layer ratio, and it is monotone in all 16 combinations (Section 4).
Fifth, ★ prediction ④ failed. Direction did belong to the grid. The daily t exceeds 2 in absolute value in 18 of 64 combinations — 13 of 16 on five-minute bars and 0 on four-hour bars. All 18 are negative, that is, on the mean-reverting side (Section 5).
Sixth, but that direction does not become a trade. The median D is −0.3929 pips on five-minute bars against a median measured spread of 0.7000 pips (Section 5). On the synthetic random walk the threshold ratio still appears at 6.5909 times while the layer ratio has a median of 0.9998, that is, 1 (Section 6).
Scope of this paper: no new mathematical theorem and no new law is claimed — the √ scaling of quantiles under diffusion, volatility clustering and short-horizon mean reversion are all known. No real course, author, or vendor is the subject here, and none is named. No trading is discussed — no performance net of cost is reported, and the direction in Section 5 stays at the level of the measured spread (Section 7). No mechanism for the mean reversion is offered — why it appears only on fine grids is not measured (Section 7). One signal quantity is fixed — only the absolute move of the previous bar is used, not ATR or a standard deviation (Section 7). One forward horizon is fixed — only four hours of wall-clock time (Section 7). The scope is intraday and few instruments — four instruments over six years. Results documented at longer holding periods, such as monthly time-series momentum, are not contradicted. No prediction is claimed.
1. Notation and the question
"Once it moves twenty pips." "Once it exceeds 1.5 times the ATR." A threshold is always written as a number.
| What gets said | What does not get said |
|---|---|
| Enter once it exceeds twenty pips | Twenty pips measured on which bar |
| This threshold worked best | Whether that number names the same event on another grid |
| Lowering the threshold raises the count | Whether what is added is of the same kind |
Observation 1.1: ★ Twenty pips on a five-minute bar and twenty pips on a four-hour bar are not the same event. One four-hour bar is 48 five-minute bars, so how often that move is reached differs entirely.
Observation 1.2: So "what the threshold is" has no meaning until the grid is named. ★ What, then, moves and what does not when the grid changes?
Observation 1.3: The separator is the grid, the length of the bar. The instruments, the period, the signal quantity and the forward horizon are all held fixed, and only the grid is changed.
Question: when a threshold is written as a number, what does that number belong to?
2. State the quantities and the design first
Declared before the run and unchanged during it.
| Grids | 5m / 15m / 1h / 4h (mid price, completed bars only) |
| Signal quantity | Absolute move of the previous bar (pips) |
| Firing rates | 0.30 / 0.10 / 0.05 / 0.01 (cut at the upper quantile) |
| Forward horizon | Four hours of wall-clock time (48 bars on 5m, 16 on 15m, 4 on 1h, 1 on 4h) |
| Quantities | Threshold (pips); layer ratio (|forward move| on the fired side ÷ all); D and the daily t |
| Baseline | Synthetic random walk down to within the bar (3 draws) |
| Separator | The grid (the length of the bar) |
| Instruments and period | USDJPY, EURUSD, GBPUSD, XAUUSD / 2019–2024 |
Observation 2.1: ★ Lining them up by firing rate is the point. Fix the threshold as a number and the count changes by tens of times across grids, mixing a difference in count with a difference in kind. Cut at the same upper share and the counts match.
Observation 2.2: ★ The forward horizon is matched in wall-clock time. "24 bars ahead" would compare two hours on five-minute bars with four days on four-hour bars. Every grid looks four hours ahead.
Observation 2.3: The decision is made at the close of bar i and the view runs forward from there. There is no look-ahead.
Observation 2.4: The counts run from 9,440 bars to 438,456 bars depending on the grid. Four-hour bars are the fewest.
Predictions (written before measuring)
① The threshold giving the same firing rate (in pips) moves a lot when the grid goes from five minutes to four hours (48 times).
② Under diffusion the threshold is proportional to the square root of the bar length. Five minutes to four hours is 48 times, so it should be √48 = 6.9282 times.
③ Line them up by firing rate and the forward move that follows should be nearly the same across grids. ⇒ The number belongs to the grid; the ordering does not.
④ Direction (D) should stay near 0 on every grid and at every firing rate.
⑤ On the synthetic random walk ① and ② should reproduce, but the layer ratio in ③ should be 1 (that the synthetic random walk has no magnitude structure was measured in [F033]).
3. How far the threshold for the same firing rate moves across grids
Calculation 3.1 Threshold (pips, median of the four instruments)
| Firing rate | 5m | 15m | 1h | 4h | 4h ÷ 5m |
|---|---|---|---|---|---|
| 0.30 | 2.8500 | 4.9250 | 9.9250 | 19.9675 | 7.0061 |
| 0.10 | 5.9500 | 10.3250 | 20.8550 | 41.9750 | 7.0546 |
| 0.05 | 8.2250 | 14.3250 | 29.0500 | 58.3250 | 7.0912 |
| 0.01 | 15.2500 | 26.4500 | 54.2038 | 105.0217 | 6.8867 |
Observation 3.2: ★ The 4h ÷ 5m ratio has a median of 7.0304 and a range of 6.8867 to 7.0912. Prediction ① held.
Observation 3.3: ★ And it sits on the diffusive prediction. Against √48 = 6.9282, the median deviation is +0.1022. Make the bar 48 times longer and the threshold for the same firing rate becomes √48 times larger.
Calculation 3.4 How different an event the same "twenty pips" is across grids
| Instrument | Top share on 5m | Top share on 4h |
|---|---|---|
| USDJPY | 0.0048 | 0.2747 |
| EURUSD | 0.0016 | 0.1976 |
| GBPUSD | 0.0044 | 0.3271 |
| XAUUSD | 0.0545 | 0.6138 |
Observation 3.5: ★ For EURUSD, twenty pips is the top 0.0016 on five-minute bars and the top 0.1976 on four-hour bars. One bar in six hundred and one bar in five are written with the same number.
Observation 3.6: The instrument matters too. On the same five-minute grid, twenty pips is the top 0.0016 for EURUSD and the top 0.0545 for XAUUSD. The number belongs to the grid and to the instrument. That the "overbought 70" of RSI belongs to the bar size was measured in [F004]. This paper confirms it for a threshold measured on the price itself.
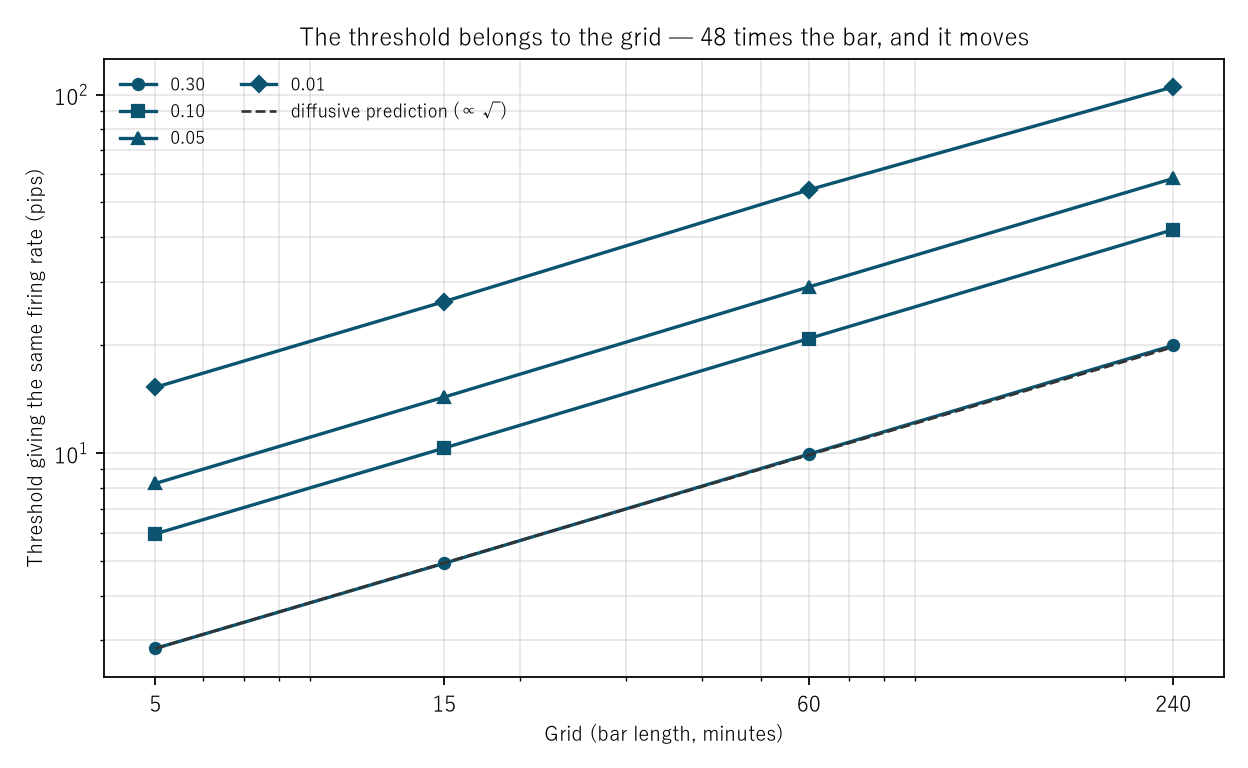
Figure 1: grid (bar length in minutes) on the horizontal axis and the threshold giving the same firing rate (pips) on the vertical, both logarithmic. The markers are firing rates; the dashed line is the diffusive prediction, proportional to the square root of the bar length.
4. Lined up by firing rate, is the shape the same across grids?
The forward horizon is matched in wall-clock time. Every grid looks four hours ahead.
Calculation 4.1 Layer ratio (four-hour forward move on the fired side ÷ all, median of the four instruments)
| Firing rate | 5m | 15m | 1h | 4h | Max ÷ min |
|---|---|---|---|---|---|
| 0.30 | 1.2874 | 1.2975 | 1.2832 | 1.2585 | 1.0310 |
| 0.10 | 1.5516 | 1.5649 | 1.5575 | 1.5221 | 1.0281 |
| 0.05 | 1.7305 | 1.7328 | 1.7509 | 1.6967 | 1.0319 |
| 0.01 | 2.1834 | 2.2467 | 2.3611 | 2.2183 | 1.0813 |
Observation 4.2: ★ This is the core of the paper: the threshold moves 7.0304 times while the layer ratio moves 1.0315 times. Make the grid 48 times longer and, lined up by firing rate, the shape still overlaps.
Observation 4.3: The layer ratio itself moves a great deal with the firing rate, from 1.2874 at 0.30 to 2.3611 at 0.01. What does not move is the comparison across grids, not the comparison across firing rates.
Calculation 4.4 Layer ratio by instrument (firing rate 0.05)
| Instrument | 5m | 15m | 1h | 4h | Max ÷ min |
|---|---|---|---|---|---|
| USDJPY | 1.9560 | 1.9635 | 1.9567 | 1.9925 | 1.0187 |
| EURUSD | 1.7073 | 1.6844 | 1.6941 | 1.5965 | 1.0694 |
| GBPUSD | 1.7537 | 1.7772 | 1.7728 | 1.7172 | 1.0350 |
| XAUUSD | 1.6897 | 1.6884 | 1.7290 | 1.6763 | 1.0314 |
Observation 4.5: The same holds instrument by instrument. Max ÷ min stays between 1.0187 and 1.0694. ★ The four instruments sit at different levels (1.5965 to 1.9925), yet the property of not moving with the grid is common to all of them.
Observation 4.6: ★ The ordering does not belong to the grid either. Lowering the firing rate from 0.30 to 0.01 raised the layer ratio monotonically in all 16 combinations. "The stricter the threshold, the larger the move that follows" holds in the same direction on every grid.
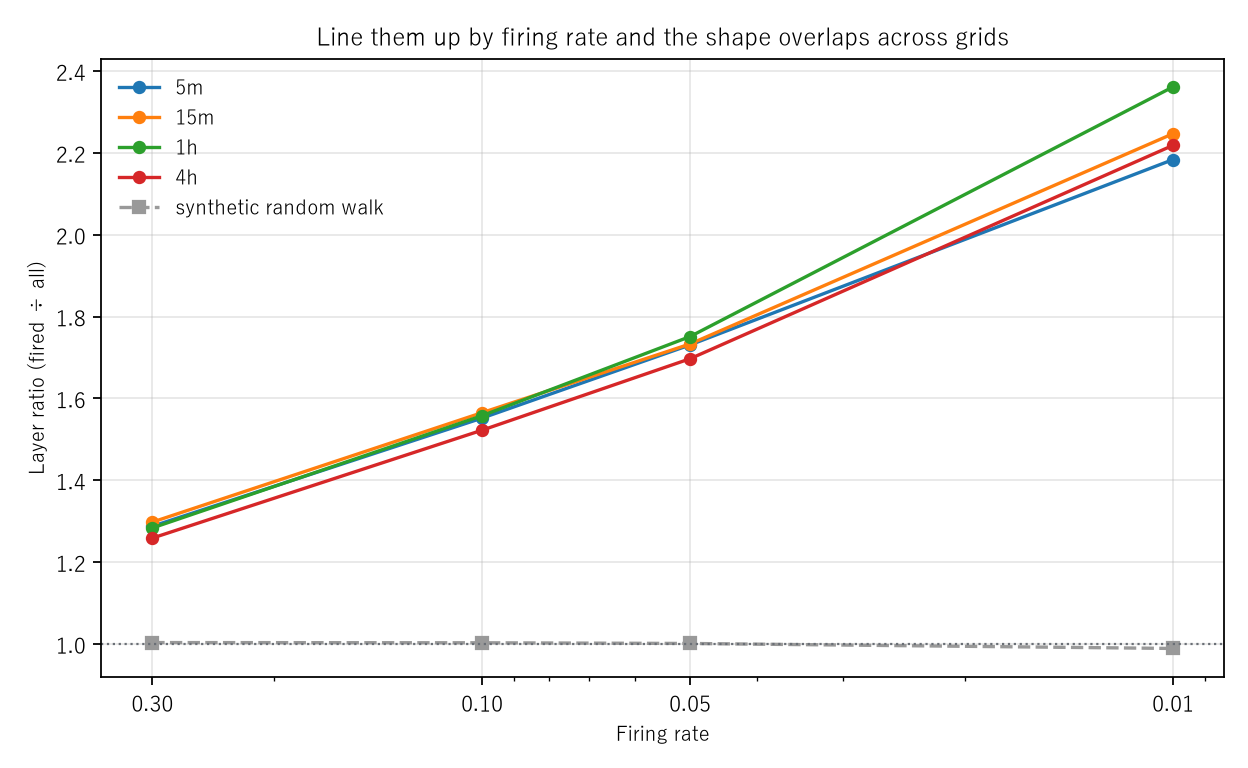
Figure 2: firing rate on the horizontal axis (stricter to the right) and the layer ratio on the vertical. The four solid lines are the four grids; the grey dashed line is the synthetic random walk. The dotted line is 1, where firing tells you nothing about the move that follows.
5. What about direction — prediction ④ failed
What happens when you go with the move right after a large one?
Calculation 5.1 Daily t (median of the four instruments)
| Firing rate | 5m | 15m | 1h | 4h |
|---|---|---|---|---|
| 0.30 | −4.1513 | −2.5204 | −0.8296 | −0.4167 |
| 0.10 | −3.8014 | −1.7188 | −0.8868 | −0.3439 |
| 0.05 | −3.0412 | −1.1898 | −0.8400 | +0.0361 |
| 0.01 | −1.9831 | −1.1045 | −0.1251 | +0.6607 |
Observation 5.2: ★ Prediction ④ failed. The daily t exceeds 2 in absolute value in 18 of 64 combinations. It did not stay near 0 on every grid.
Calculation 5.3 The failure has a shape
| Grid | |t|≥2 | of which negative | Median t | Median D | Median measured spread |
|---|---|---|---|---|---|
| 5m | 13 | 13 | −3.0412 | −0.3929 | 0.7000 |
| 15m | 5 | 5 | −1.6337 | −0.4642 | 0.7000 |
| 1h | 0 | 0 | −0.6719 | −0.1123 | 0.7000 |
| 4h | 0 | 0 | −0.2611 | −0.3846 | 0.7000 |
Observation 5.4: ★ It appears on fine grids and vanishes on four-hour bars. Five-minute bars give 13 of 16, fifteen-minute bars 5, and one-hour and four-hour bars 0. All 18 are negative, that is, on the mean-reverting side.
Observation 5.5: ★ So direction belongs to the grid as well — but it belongs differently. The shape of the magnitude did not move when the grid changed; direction disappears as the grid is coarsened.
Observation 5.6: That direction does not become a trade, however. The median D is −0.3929 pips on five-minute bars and −0.4642 pips on fifteen-minute bars. The median measured spread is 0.7000 pips, and both are below it. ★ Flip the sign and the cost still eats it first.
Observation 5.7: The mechanism is not measured. ★ Why it appears only on fine grids is not investigated here.
6. The baseline — the same procedure on a synthetic random walk
A series with, by construction, neither directional information nor magnitude structure.
Calculation 6.1 Threshold and layer ratio on the synthetic random walk (median of four instruments × 3 draws)
| Firing rate | Threshold 5m | Threshold 4h | 4h ÷ 5m | Layer ratio 5m | Layer ratio 4h |
|---|---|---|---|---|---|
| 0.30 | 4.6032 | 30.4873 | 6.6231 | 0.9985 | 1.0109 |
| 0.10 | 7.2987 | 48.0262 | 6.5801 | 0.9971 | 1.0029 |
| 0.05 | 8.7007 | 57.4394 | 6.6017 | 0.9960 | 1.0046 |
| 0.01 | 11.4450 | 75.0068 | 6.5537 | 0.9902 | 1.0657 |
Observation 6.2: The threshold ratio appears on the synthetic random walk too. 4h ÷ 5m has a median of 6.5909, close to the diffusive 6.9282. ★ That the threshold grows as a square root is not a property of the market but the arithmetic of adding independent increments.
Observation 6.3: ★ But the layer ratio is 1. The median is 0.9998, with a range of 0.9781 to 1.0657. Right after a large move, what follows is no different from everything else.
Observation 6.4: ★ The measurement is not like that. At a firing rate of 0.01 the layer ratio has a median of 2.2325 across the four grids. Prediction ⑤ held: a layer ratio above 1 is a property of the market, and a threshold growing as a square root is arithmetic.
Observation 6.5: These two can be separated only because what the baseline is zero about has been measured. That the synthetic random walk has no magnitude structure was measured in [F033]. This paper uses that result directly.
7. Limitations
- Prediction ④ failed. Direction appeared on the mean-reverting side on five- and fifteen-minute bars (18 of 64 combinations). This paper writes that failure and shows its shape grid by grid.
- No mechanism for the mean reversion is offered. Why it appears only on fine grids is not measured.
- No trading is discussed. No performance net of cost is reported, and D stays at the level of the measured spread, 0.7000 pips.
- One signal quantity is fixed. Only the absolute move of the previous bar is used, not ATR or a standard deviation.
- One forward horizon is fixed. Only four hours of wall-clock time.
- Four firing rates are fixed, from 0.30 down to 0.01; nothing finer is examined.
- The median spread comes out the same on all four grids. It aggregates tick spreads onto bars and does not separate by grid. It cannot be used for an argument about execution.
- Four instruments, six years. Nothing is claimed about other markets or other periods.
Conclusion
"Once it moves twenty pips." A threshold is always written as a number. But that number has no meaning until the bar it was measured on is named.
For USDJPY, a bar moving more than twenty pips is the top 0.0048 on five-minute bars and the top 0.2747 on four-hour bars. For EURUSD it is 0.0016 and 0.1976. ★ One bar in six hundred and one bar in five are written with the same number.
The threshold giving the same firing rate moves 7.0304 times when the grid is made 48 times longer. ★ And that factor sits on the diffusive prediction √48 = 6.9282 to within +0.1022. That the threshold grows as a square root is not a property of the market: the synthetic random walk gives 6.5909 times. It is the arithmetic of adding independent increments.
★ But line them up by firing rate and the shape overlaps across grids. The layer ratio's max ÷ min has a median of 1.0315. The threshold moves 7.0304 times; the layer ratio moves 1.0315 times. And the ordering — a stricter threshold gives a larger move afterwards — holds in all 16 combinations.
So what is being discarded is the number "twenty", and what is being kept is the ordering: the stricter the threshold, the larger the move. ★ The number belongs to the grid; the ordering does not.
★ One prediction failed. Direction belonged to the grid too. The daily t exceeds 2 in absolute value in 18 of 64 combinations — 13 of 16 on five-minute bars and 0 on four-hour bars — and all 18 are negative, on the mean-reverting side. The shape of the magnitude does not move when the grid changes; direction disappears as the grid is coarsened.
That direction does not become a trade, however. The median D is −0.3929 pips on five-minute bars against a median measured spread of 0.7000 pips. Flip the sign and the cost still eats it first.
So what is needed when reporting a threshold is not the number but the firing rate. ★ Write "twenty pips" and the method becomes a different method the moment the grid changes; write "the top 5%" and it stays the same method.
Data and reproduction
| Data | Foreign exchange from Dukascopy-derived ticks (from 2019 onward, matching to the millisecond, bid and ask, has been verified). Gold from Dukascopy |
| Period | 2019–2024 (six years) |
| Instruments | USDJPY, EURUSD, GBPUSD, XAUUSD |
| Bars | 5m, 15m, 1h, 4h. Mid price, closes of completed bars only. Bars with no ticks are not created |
| Signal quantity | Absolute move of the previous bar (pips) |
| Firing rates | 0.30, 0.10, 0.05, 0.01 (cut at the upper quantile) |
| Forward horizon | Four hours of wall-clock time (48 bars on 5m, 16 on 15m, 4 on 1h, 1 on 4h) |
| Quantities | Threshold (pips); layer ratio; D = (trend-following sign × forward move) and the daily t |
| Baseline | Synthetic random walk down to within the bar (3 draws), built by adding differences of constant spread |
| Verification | 検算/F035.py (--zu also writes the figures). Every number in the text comes from 検算/F035_output.txt |
| Figures | 図/F035_zu1, 図/F035_zu2 (png, svg, English versions) |
| Random seeds | Fixed. Re-running gives the same values |
| Substrate check | _ツール/audit_bars.py (bar look-ahead, daylight saving, day boundary). The record is _土台の検査.txt |
References
- Yamagishi, Y. (2026). The "Overbought 70" of RSI Belongs to the Bar Size You Chose [F004]. Zenodo. 10.5281/zenodo.22881156
- Yamagishi, Y. (2026). A Synthetic Random Walk Has No Volatility Clustering [F033]. Zenodo. 10.5281/zenodo.22893674
Reference
Yamagishi, Y. (2026). Change the Grid and the Threshold Moves While the Shape Does Not [F035]. Zenodo.
DOI: 10.5281/zenodo.22893852
YOI: https://www.yamagishiyuuki.com/yoi/F035
ORCID: 0009-0006-8587-3450
PDF (English) · PDF (Japanese) · Date proof of the English PDF (OpenTimestamps .ots) · SHA256SUMS
The record page for this paper (in Japanese, with the PDFs in each language and the date proof): YOI F035. This paper is a preprint and has not been peer reviewed.