Abstract
What this paper asks is this: when someone writes "tested out of sample", what does that answer belong to — and the answer is that it belongs to where the boundary was placed. No new mathematical theorem and no new law is claimed.
First, move the split point in half-year steps and the selected cell changes. Across 9 split points, the number of distinct cells selected has a median of 3.5 over the four instruments. GBPUSD is stable at 2 kinds while USDJPY scatters into 5 (Section 3).
Second, ★ the evaluation answer swings from moving the boundary alone. The 36 evaluation values of D run from −14.3878 to 6.5793, a span of 20.9671 pips. The sign changes for 2 of the four instruments (Section 4).
Third, and this is the core of the paper: ★ prediction ③ failed. The rank correlation was not 0 but strongly negative. The rank correlation between the selection-period D and the evaluation-period D has a median of −0.6105, and −0.6606 with the mirrors removed. Only 5 of 36 combinations are positive (Section 5).
Fourth, ★ the selected cell is worse than an ordinary cell in the evaluation period. Its rank there has a median of 0.1053, the bottom tenth of the 20 cells. It beat the median cell in only 3 of 36 combinations, by a median of −1.7166 pips (Section 5).
Fifth, ★ on the synthetic random walk the selected cell lands in the middle. The rank has a median of 0.5263 and it beats the median cell 0.5833 of the time. On a series with nothing to select, selecting costs nothing. The loss is on the measurement side (Section 6).
Sixth, the swing itself, however, is not a property of the market. The standard deviation of the evaluation D is 3.7211 on the measurement and 3.3769 on the random walk, a ratio of 1.1019. ★ That the answer swings when the boundary moves is a property of the procedure (Section 6).
Scope of this paper: no new mathematical theorem and no new law is claimed — the winner's curse, selection bias and walk-forward testing are all known. No real course, author, or vendor is the subject here, and none is named. No trading is discussed — no performance net of cost is reported, and the daily t fails to reach 2 in all 36 combinations (Section 7). One family of cells is fixed — only moving-average crosses, 10 pairs × trend/revert (Section 7). Mirrors are included — 10 of the 20 cells are the sign flips of the other 10 and are not independent (Sections 5 and 7). Part of the negative rank correlation is arithmetic — with the mirrors removed the synthetic random walk gives −0.3879 (Sections 6 and 7). No walk-forward is implemented — split points were tried one at a time (Section 7). The scope is intraday and few instruments — four instruments over six years on one-hour bars. Results documented at longer holding periods, such as monthly time-series momentum, are not contradicted. No prediction is claimed.
1. Notation and the question
"Selected on 2019–2021 and tested on 2022–2024." This series has written that many times itself.
| What gets said | What does not get said |
|---|---|
| It was tested out of sample | Who set that boundary, and how |
| It was profitable outside the period too | Whether the same holds when the boundary shifts |
| The best setting in the selection period was taken | Whether that setting survives a different boundary |
Observation 1.1: ★ The boundary between "2019–2021" and "2022–2024" is one point somebody chose. The data did not name that date.
Observation 1.2: And the boundary decides two things at once: which period selects and which period evaluates. ★ Move the first and what gets selected changes; move the second and the market being evaluated changes.
Observation 1.3: The separator is the split point. The instruments, the period, the family of cells and the forward horizon are all held fixed, and only the one boundary point is moved.
Question: when someone writes "tested out of sample", what does that answer belong to?
2. State the quantities and the design first
Declared before the run and unchanged during it.
| Grid | 1-hour bars (mid price, completed bars only) |
| Cells | 10 moving-average cross pairs × trend/revert = 20 |
| Forward horizon | 24 bars (one day) |
| Split points | Every six months from 2020-01-01 to 2024-01-01, 9 in all |
| Selection rule | The single cell with the largest D in the selection period |
| Quantities | The selected cell; the evaluation D and daily t; the rank correlation between selection and evaluation; the rank in the evaluation period; the full-period D |
| Baseline | Synthetic random walk down to within the bar (3 draws) |
| Separator | The split point |
| Instruments and period | USDJPY, EURUSD, GBPUSD, XAUUSD / 2019–2024 |
Observation 2.1: The selection rule is the most naive possible: take the single cell with the largest selection-period D. ★ Practice would do something cleverer, but cleverness mixes the effect of the cleverness with the effect of the boundary.
Observation 2.2: The number of cells is fixed at 20. That the best value rises with the number of cells looked at was measured in [F022]. This paper does not move the cell count.
Observation 2.3: ★ 10 of the 20 cells are the sign flips of the other 10. Trend and revert are the same signal with the sign changed, so these are not 20 independent cells. Section 5 also reports the version with the mirrors removed.
Observation 2.4: The split point changes the lengths of the two periods a great deal. For USDJPY they run from 6,220 selection bars and 30,290 evaluation bars to 30,307 selection bars and 6,203 evaluation bars.
Predictions (written before measuring)
① Moving the split point changes the selected cell.
② The evaluation answer (the D of the selected cell) changes sign with the split point.
③ The rank correlation between the selection D and the evaluation D varies with the split point and is close to 0 on average.
④ The synthetic random walk should swing by the same amount. ⇒ The swing is a property of the procedure, not of the market.
⑤ The full-period D does not depend on the split point (a check, not a finding).
3. Move the split point and the selected cell changes
The data, the period and the cells are all the same. Only the one boundary point differs.
Calculation 3.1 The nine split points for USDJPY
| Split | Selection bars | Evaluation bars | Selected cell | Selection D | Evaluation D | Evaluation t |
|---|---|---|---|---|---|---|
| 2020-01-01 | 6,220 | 30,290 | 50/200 revert | 3.2614 | −0.8297 | −0.4935 |
| 2020-07-01 | 9,318 | 27,192 | 20/80 trend | 3.2462 | −1.7914 | −0.6305 |
| 2021-01-01 | 12,450 | 24,060 | 50/200 revert | 2.8888 | −1.6989 | −1.0008 |
| 2021-07-01 | 15,504 | 21,006 | 50/200 revert | 2.4898 | −2.0746 | −1.1108 |
| 2022-01-01 | 18,669 | 17,841 | 40/160 revert | 2.5224 | −1.7557 | −0.9459 |
| 2022-07-01 | 21,767 | 14,743 | 5/50 trend | 2.3757 | −2.0499 | −0.3094 |
| 2023-01-01 | 24,906 | 11,604 | 20/50 trend | 1.5721 | −3.1167 | −0.8239 |
| 2023-07-01 | 27,342 | 9,168 | 40/160 revert | 2.1143 | −4.5934 | −1.1972 |
| 2024-01-01 | 30,307 | 6,203 | 40/160 revert | 2.2884 | −8.6462 | −1.8407 |
Observation 3.2: ★ On the same data and the same 20 cells, five different cells get selected: 50/200 revert, 20/80 trend, 40/160 revert, 5/50 trend and 20/50 trend. Trend and revert trade places.
Observation 3.3: Stability differs by instrument. The number of distinct selected cells has a median of 3.5 across the four instruments, with a range of 2 to 5. GBPUSD picks 20/80 trend at 8 of the 9 split points.
Observation 3.4: Prediction ① held. ★ But what "changes" means differs by instrument; GBPUSD stays put.
4. How far the evaluation answer swings with the split point
Calculation 4.1 The swing by instrument
| Instrument | Min evaluation D | Max evaluation D | Span | Positive | |t|≥2 |
|---|---|---|---|---|---|
| USDJPY | −8.6462 | −0.8297 | 7.8165 | 0 | 0 |
| EURUSD | −3.1962 | −0.2009 | 2.9953 | 0 | 0 |
| GBPUSD | −3.2216 | 0.5430 | 3.7647 | 1 | 0 |
| XAUUSD | −14.3878 | 6.5793 | 20.9671 | 2 | 0 |
Observation 4.2: ★ The 36 evaluation values of D run from −14.3878 to 6.5793, a span of 20.9671 pips. For 2 of the four instruments, moving the boundary alone changes the sign.
Observation 4.3: ★ And almost all of them are negative. Only 3 of 36 are positive. The cell that was best in the selection period is nearly always negative in the evaluation period.
Observation 4.4: None of them is significant, however. The daily t exceeds 2 in absolute value in 0 of 36 combinations. ★ They are negative but not significant; it has not been shown that they are negative.
Observation 4.5: USDJPY at 2024-01-01 has an evaluation D of −8.6462 over only 6,203 bars. ★ Push the boundary toward an end and the evaluation period shortens, and the answer swings further.
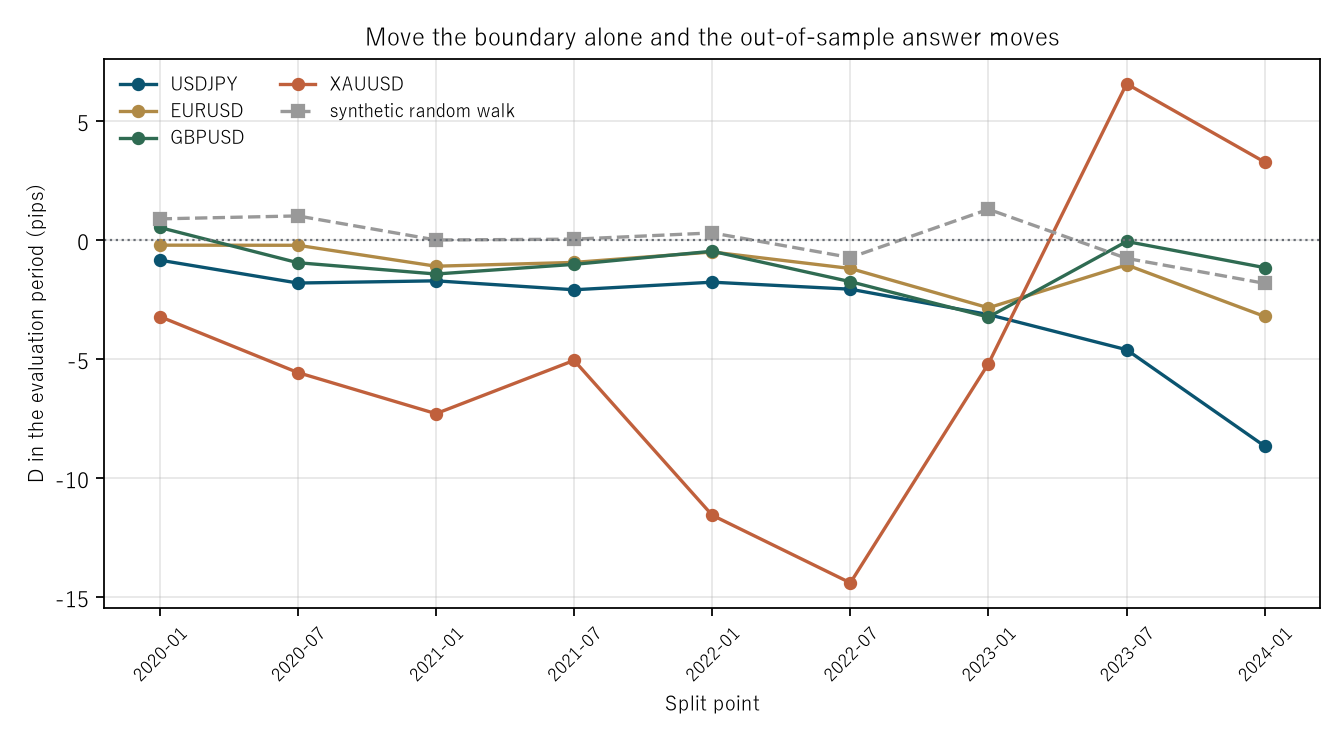
Figure 1: split point on the horizontal axis and the evaluation-period D of the selected cell (pips) on the vertical. The coloured lines are the four instruments; the grey dashed line is the median over the synthetic random walks. The dotted line is 0.
5. Where the selected cell lands in the evaluation period — prediction ③ failed
Calculation 5.1 Rank correlation between the selection D and the evaluation D (by split point)
| Split | USDJPY | EURUSD | GBPUSD | XAUUSD | Median |
|---|---|---|---|---|---|
| 2020-01-01 | −0.7684 | 0.4767 | 0.5789 | −0.2962 | 0.0902 |
| 2021-01-01 | −0.5684 | −0.8481 | −0.6541 | −0.6226 | −0.6383 |
| 2022-01-01 | −0.6632 | −0.1985 | 0.0256 | −0.6872 | −0.4308 |
| 2023-01-01 | −0.7940 | −0.9143 | −0.9338 | −0.2947 | −0.8541 |
| 2024-01-01 | −0.8030 | −0.9098 | −0.4647 | 0.1504 | −0.6338 |
Observation 5.2: ★ Prediction ③ failed. The rank correlation is not 0 but strongly negative. The median is −0.6105, the range −0.9338 to 0.5789, and only 5 of 36 are positive.
Observation 5.3: Removing the mirrors does not change it. Measured over the 10 trend cells alone the median is −0.6606, with only 1 of 36 positive. ★ This is not a story that "which of trend and revert worked" can explain on its own.
Calculation 5.4 Where the selected cell ranks in the evaluation period
| Measurement | Synthetic random walk | |
|---|---|---|
| Evaluation D − median cell (pips) | −1.7166 | 0.0894 |
| Rank in evaluation (1 is best) | 0.1053 | 0.5263 |
| Share beating the median cell | 0.0833 | 0.5833 |
Observation 5.5: ★ The selected cell lands in the bottom tenth of the 20 cells in the evaluation period. The median rank is 0.1053. It beat the median cell in only 3 of 36 combinations, by a median of −1.7166 pips.
Observation 5.6: ★ On the synthetic random walk it lands in the middle: median rank 0.5263 and a 0.5833 share beating the median cell. On a series with nothing to select, selecting costs nothing.
Observation 5.7: ★ So the loss is on the measurement side. Knowing that a cell was best in the selection period tells you only that it is worse than ordinary in the evaluation period.
Observation 5.8: Of the selected cells, 24 of 36 are trend-following. ★ The bias is toward trend, but not exclusively.
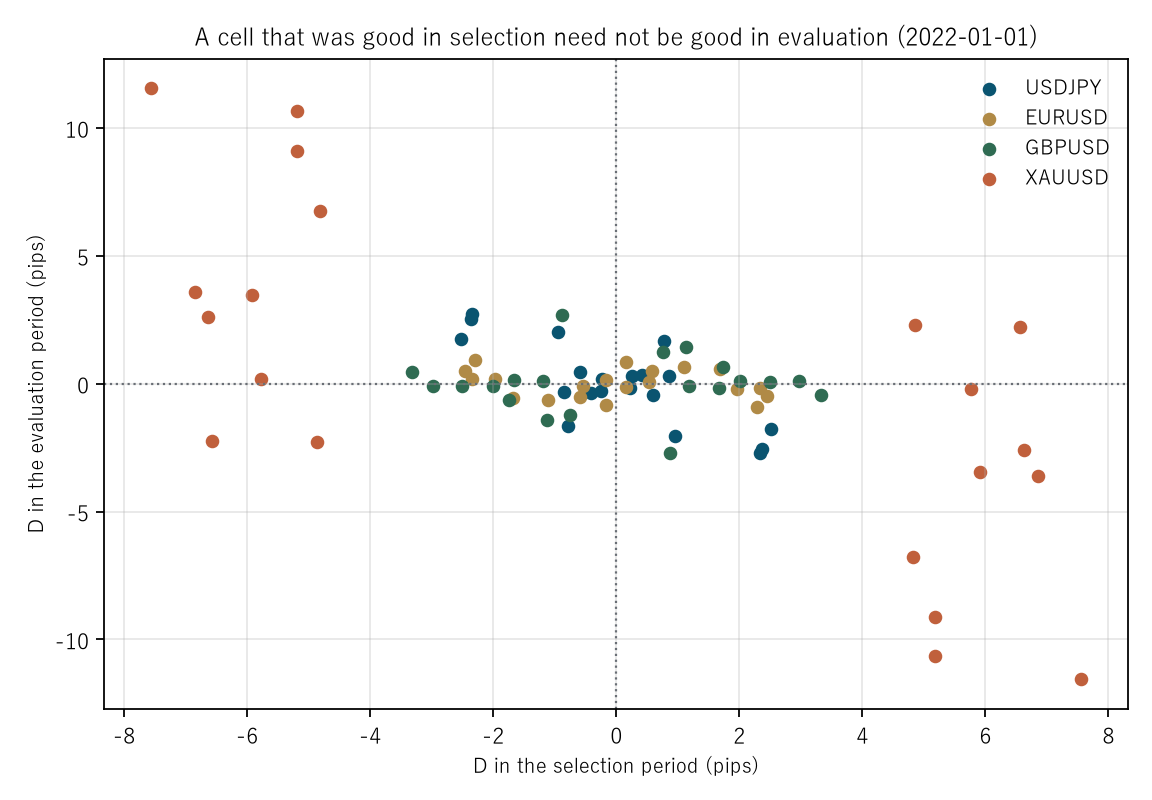
Figure 2: selection-period D on the horizontal axis and evaluation-period D on the vertical (both in pips). The split point is fixed at 2022-01-01 and all 20 cells are plotted. A cloud running to the lower right means what was good in selection was bad in evaluation.
6. The baseline, and what does not move
Calculation 6.1 Measurement against synthetic random walk
| Measurement | Synthetic random walk | |
|---|---|---|
| Span of the evaluation D | 20.9671 | 22.2217 |
| SD of the evaluation D | 3.7211 | 3.3769 |
| Share positive | 0.0833 | 0.5833 |
| Share with |t|≥2 | 0.0000 | 0.0463 |
| Median rank correlation | −0.6105 | 0.0662 |
| Median rank correlation, mirrors removed | −0.6606 | −0.3879 |
| Distinct cells selected | 3.5 | 2.5 |
Observation 6.2: ★ The swing itself is not a property of the market. The ratio of the standard deviations of the evaluation D is 1.1019. A series with nothing to select swings just as much when the boundary moves. Prediction ④ held. What this baseline is zero about was measured in [F033].
Observation 6.3: ★ Part of the negative rank correlation is arithmetic. With the mirrors removed the synthetic random walk gives −0.3879. The two periods divide up one whole, so if the full-period D is the same, a higher selection-period D forces a lower evaluation-period D.
Observation 6.4: So the measured −0.6606 must not be attributed wholly to the market. ★ The comparison is not against 0 but against −0.3879, a difference of −0.2727.
Observation 6.5: With the mirrors included, however, the synthetic random walk gives +0.0662. ★ Why the arithmetic is diluted there is not measured in this paper.
Calculation 6.6 What does not move (checks)
Observation 6.7: The full-period D is one and the same number wherever the split is placed. The full-period best cell is 5/20 trend for USDJPY, 10/40 trend for EURUSD, 5/50 trend for GBPUSD and 5/20 trend for XAUUSD.
Observation 6.8: Trend and revert are the same signal with the sign changed. The absolute value of the sum of their two D values is at most 0.000000 across all 40 pairs. ★ Agreement here is a check, not a finding.
Observation 6.9: ★ And the full-period best cell is not the cell chosen at a split point. They agreed in 3 of 36 combinations. "The best chosen after seeing everything" and "the best chosen from before the boundary only" are different things.
7. Limitations
- Prediction ③ failed. The rank correlation was not 0 but −0.6105. This paper writes that failure and tries to separate the arithmetic part from the market part by comparing against the random walk's −0.3879.
- Part of the negative rank correlation is arithmetic. The two periods divide up one whole. The paper shows the difference of −0.2727 and does not decompose it rigorously.
- Mirrors are included. 10 of the 20 cells are the sign flips of the other 10 and are not independent.
- One family of cells is fixed. Only moving-average crosses; no other indicator is measured.
- One selection rule is fixed. Only the single largest selection-period D.
- No walk-forward is implemented. Split points were tried one at a time, not rolled forward repeatedly.
- No trading is discussed. No performance net of cost is reported, and the daily t fails to reach 2 in all 36 combinations.
- Four instruments, six years, one-hour bars. Nothing is claimed about other markets, other periods or other bar sizes.
Conclusion
"Selected on 2019–2021 and tested on 2022–2024." But that boundary is one point somebody chose.
The boundary was moved in half-year steps. The selected cell changes into a median of 3.5 kinds across the 9 split points, and for USDJPY trend and revert trade places. The evaluation D runs from −14.3878 to 6.5793, a span of 20.9671 pips, and the sign changes for 2 of the four instruments.
★ But that swing is not a property of the market. The ratio to the random walk's standard deviation is 1.1019. A series with nothing to select swings just as much when the boundary moves.
★ One prediction failed. The rank correlation was not 0 but strongly negative: median −0.6105, −0.6606 with the mirrors removed, and only 5 of 36 positive. A cell that ranked high in the selection period ranks low in the evaluation period.
★ Part of that is arithmetic. With the mirrors removed the synthetic random walk gives −0.3879. The two periods divide up one whole, so if the full-period D is the same, one side being high forces the other to be low. The comparison is against −0.3879, not 0, a difference of −0.2727.
★ But something remains that arithmetic does not explain. The selected cell's rank in the evaluation period has a median of 0.1053, the bottom tenth of the 20 cells. On the synthetic random walk it is 0.5263, the middle. The share beating the median cell is 0.0833 on the measurement against 0.5833 on the random walk.
★ On a series with nothing to select, selecting costs nothing. The loss is on the measurement side. Knowing that a cell was best in the selection period tells you only that it is worse than ordinary in the evaluation period.
None of it is significant, however. The daily t exceeds 2 in absolute value in 0 of 36 combinations. They are negative but not significant; it has not been shown that they are negative.
So what is needed when writing "tested out of sample" is the version with the boundary moved. ★ The answer from one boundary is one of nine values that could have been reported, and it happens to be the one that was.
Data and reproduction
| Data | Foreign exchange from Dukascopy-derived ticks (from 2019 onward, matching to the millisecond, bid and ask, has been verified). Gold from Dukascopy |
| Period | 2019–2024 (six years) |
| Instruments | USDJPY, EURUSD, GBPUSD, XAUUSD |
| Bars | 1-hour, mid price, closes of completed bars only. Bars with no ticks are not created |
| Cells | 10 moving-average cross pairs (5/20, 5/50, 10/40, 10/100, 20/50, 20/80, 20/200, 40/160, 50/200, 12/26) × trend/revert = 20 |
| Forward horizon | 24 bars (one day) |
| Split points | Every six months from 2020-01-01 to 2024-01-01, 9 in all |
| Selection rule | The single cell with the largest selection-period D |
| Quantities | Evaluation D and daily t; rank correlation (with and without mirrors); rank in the evaluation period; full-period D |
| Baseline | Synthetic random walk down to within the bar (3 draws), built by adding differences of constant spread |
| Verification | 検算/F036.py (--zu also writes the figures). Every number in the text comes from 検算/F036_output.txt |
| Figures | 図/F036_zu1, 図/F036_zu2 (png, svg, English versions) |
| Random seeds | Fixed. Re-running gives the same values |
| Substrate check | _ツール/audit_bars.py (bar look-ahead, daylight saving, day boundary). The record is _土台の検査.txt |
References
- Yamagishi, Y. (2026). The Best Value Is a Function of How Many Cells You Looked At [F022]. Zenodo. 10.5281/zenodo.22892093
- Yamagishi, Y. (2026). A Synthetic Random Walk Has No Volatility Clustering [F033]. Zenodo. 10.5281/zenodo.22893674
Reference
Yamagishi, Y. (2026). The Out-of-Sample Answer Belongs to Where You Split It [F036]. Zenodo.
DOI: 10.5281/zenodo.22893898
YOI: https://www.yamagishiyuuki.com/yoi/F036
ORCID: 0009-0006-8587-3450
PDF (English) · PDF (Japanese) · Date proof of the English PDF (OpenTimestamps .ots) · SHA256SUMS
The record page for this paper (in Japanese, with the PDFs in each language and the date proof): YOI F036. This paper is a preprint and has not been peer reviewed.