Abstract
What this paper asks is the difference between choosing a stop width as a number and setting it as a pre-declared multiple of σ — and the answer is that a number names a different quantity on each instrument, and the gain from choosing after the fact is matched on a synthetic random walk. No new mathematical theorem and no new law is claimed.
First, the same "twenty pips" is a different quantity on each instrument. The standard deviation σ of the 24-bar forward move runs from 43.1287 to 167.3431 pips across the instruments, a factor of 3.8801. Twenty pips is 0.4637σ for EURUSD and 0.1195σ for XAUUSD (Section 3).
Second, the best width in pips in the selection period is all over the place: 20 / 50 / 50 / 100 pips across the four instruments (Section 5).
Third, setting it as a multiple of σ moves toward agreement. The best multiple in the selection period is 1σ / 6σ / 1σ / 1σ. ★ EURUSD alone breaks ranks, so this is not enough to call it agreement (Section 5).
Fourth, and this is the core of the paper: ★ prediction ③ failed. The gain from hindsight was not smaller than the standard error. It was smaller in only 2 of the four instruments. USDJPY buys +2.1432 pips against a standard error of 0.7053, and XAUUSD +3.8800 against 1.4490 (Section 5).
Fifth, ★ but that gain is evidence of nothing. Running the same procedure on a synthetic random walk buys a median of +1.8017 pips in the numeric family — more than the measurement's +0.8007 (Section 6).
Sixth, ★ prediction ④ failed too. The expectation does move with the width, from −1.0502 to 4.6842 across 44 combinations, a span of 5.7345 pips. But that happens on the random walk as well: the span across the five σ multiples has a median of 1.7123 pips on the measurement and 0.8354 on the random walk (Sections 4 and 6).
Scope of this paper: no new mathematical theorem and no new law is claimed — overfitting, selection bias and volatility-normalized stops are all known. No real course, author, or vendor is the subject here, and none is named. No trading is discussed — neither cost nor slippage is included, and everything is measured on mid prices (Section 7). Stops are neither recommended nor rejected — the paper compares only how the width is chosen (Section 7). No take-profit is used — the exit is time or stop only (Section 7). The inside of the bar is not examined — stop hits are judged on bar highs and lows (Section 7). Predictions ③ and ④ failed — the hindsight gain exceeded one standard error, and the expectation moved with the width (Sections 5, 6 and 7). The scope is intraday and few instruments — four instruments over six years on one-hour bars. Results documented at longer holding periods, such as monthly time-series momentum, are not contradicted. No prediction is claimed.
1. Notation and the question
"A twenty-pip stop worked best." This gets written often.
| What gets said | What does not get said |
|---|---|
| A twenty-pip stop was best | Whether the twenty was fixed before seeing the results |
| Changing the width changed the result | Whether the same change appears on a series with nothing in it |
| This width is optimal | What twenty pips is, in σ, for that instrument |
Observation 1.1: ★ Choosing a width after seeing the results is hindsight. There are infinitely many numbers, so a best one will always be found.
Observation 1.2: A multiple of σ, by contrast, can be declared in advance. ★ Fix the multiple first and estimate σ on the selection period only, and there is no room left to move the number after seeing the evaluation result.
Observation 1.3: The separator is how the width is decided. The instruments, the period, the entry and the holding time are all held fixed, and only "a number or a multiple of σ" is changed.
Question: does a width chosen as a number buy anything over a width set as a multiple of σ?
2. State the quantities and the design first
Declared before the run and unchanged during it.
| Grid | 1-hour bars (mid price, completed bars only) |
| Entry | Every bar. Direction is the sign of the previous bar (trend-following) |
| Exit | The close 24 bars later, or the stop level on the first bar whose adverse extreme crosses it |
| Widths | Numbers 10 / 20 / 30 / 50 / 100 pips; multiples 1 / 2 / 3 / 4 / 6 σ |
| σ | The standard deviation of the 24-bar forward move over the selection period (2019-01-01 to 2022-01-01) only. The evaluation period is not seen |
| Pre-declared width | 4σ |
| Quantities | Expectation (pips), win rate, stop-hit share, worst single trade, standard error of one trade, daily t |
| Baseline | Synthetic random walk down to within the bar (3 draws) |
| Separator | How the width is decided (a number, or a multiple of σ) |
| Instruments and period | USDJPY, EURUSD, GBPUSD, XAUUSD / 2019–2024 |
Observation 2.1: ★ The choice of 4σ as the pre-declared width was not made in this paper. It is the value this series already uses as its "seatbelt". It was not chosen by looking at the evaluation result.
Observation 2.2: σ is estimated on the selection period only: 44.8971, 43.1287, 71.2644 and 167.3431 pips across the four instruments.
Observation 2.3: Counts run from 17,396 to 18,668 in the selection period and 17,471 to 17,867 in the evaluation period. ★ Entering every bar means the positions overlap, so the daily t is reported alongside.
Observation 2.4: Stop hits are judged on bar highs and lows. ★ The order of moves inside a bar is not examined, so the handling of a bar that goes and comes back is fixed to one convention.
Predictions (written before measuring)
① The best width in pips in the selection period moves a great deal across instruments.
② Set as a multiple of σ, the best lands near the same multiple across instruments.
③ The gain bought by a width chosen after the fact is smaller than the standard error of one trade.
④ The expectation barely moves with the width; what moves is the win rate and the worst single trade.
(This prediction comes from [F012], where placing the take profit and stop loss forty-nine ways did not move the expectation.)
⑤ A "best width" appears on a synthetic random walk too (that is, one can always be chosen).
3. A width set as a number is a different quantity on each instrument
Calculation 3.1 σ, and how many σ twenty pips is
| Instrument | σ (pips) | 4σ | 20 pips in σ | 100 pips in σ |
|---|---|---|---|---|
| USDJPY | 44.8971 | 179.5883 | 0.4455 | 2.2273 |
| EURUSD | 43.1287 | 172.5147 | 0.4637 | 2.3186 |
| GBPUSD | 71.2644 | 285.0577 | 0.2806 | 1.4032 |
| XAUUSD | 167.3431 | 669.3726 | 0.1195 | 0.5976 |
Observation 3.2: ★ σ runs from 43.1287 to 167.3431 pips across instruments, a factor of 3.8801.
Observation 3.3: ★ So the same "twenty pips" is 0.4637σ for EURUSD and 0.1195σ for XAUUSD. The first allows nearly half of one trade's own scatter; the second allows an eighth. The same number names a different strictness.
Observation 3.4: The same holds for "a hundred pips": 2.3186σ for EURUSD and 0.5976σ for XAUUSD. One is a width at which the stop effectively does nothing; the other is a width it hits often.
4. What moves and what does not when the width changes
Calculation 4.1 USDJPY (evaluation period 2022–2024)
| Width set by | Width (pips) | Expectation | Win rate | Stop-hit | Worst trade | SE of one | Daily t |
|---|---|---|---|---|---|---|---|
| none | — | 0.6609 | 0.5044 | 0.0000 | −702.30 | 0.7411 | 0.5420 |
| 10 pips | 10.00 | 1.8045 | 0.1254 | 0.8724 | −10.00 | 0.2953 | 2.2953 |
| 20 pips | 20.00 | 2.6196 | 0.2306 | 0.7541 | −20.00 | 0.3920 | 2.1356 |
| 50 pips | 50.00 | 3.3791 | 0.4048 | 0.4825 | −50.00 | 0.5443 | 2.4722 |
| 100 pips | 100.00 | 2.4459 | 0.4838 | 0.2221 | −100.00 | 0.6421 | 1.3862 |
| 1σ | 44.90 | 3.3832 | 0.3866 | 0.5203 | −44.90 | 0.5244 | 2.3987 |
| 4σ | 179.59 | 1.2400 | 0.5021 | 0.0687 | −179.59 | 0.7053 | 0.4154 |
| 6σ | 269.38 | 0.4631 | 0.5041 | 0.0233 | −269.38 | 0.7342 | 0.1368 |
Observation 4.2: ★ The win rate moves a great deal with the width, from 0.1254 at 10 pips to 0.5041 at 6σ. Tighten the width and the win rate falls while the stop-hit share rises to 0.8724.
Observation 4.3: ★ The worst single trade is the width itself. With a stop it is fixed at minus the width; without one it is −702.30 pips for USDJPY and −1056.95 for XAUUSD. That follows from the definition: a check, not a finding.
Observation 4.4: ★ Prediction ④ failed. The expectation moves with the width too, from −1.0502 to 4.6842 across 44 combinations, a span of 5.7345 pips.
Observation 4.5: How it moves differs by instrument. XAUUSD rises from 1.1628 at 10 pips to 4.6842 at 1σ and then falls to 0.9727 at 6σ. GBPUSD is negative at every width, between −1.0502 and −0.3652.
Calculation 4.6 Why the expectation moves (★ added afterwards)
This part is after the fact. It was measured only once prediction ④ had failed.
| Instrument | Direction = previous sign | Direction = random | Drift in the evaluation period |
|---|---|---|---|
| USDJPY | 2.9201 | 2.5428 | 5.6539 |
| EURUSD | 0.2512 | 0.2171 | −1.3693 |
| GBPUSD | 0.5045 | 0.3997 | −1.3651 |
| XAUUSD | 3.8800 | 3.8183 | 10.9192 |
Observation 4.7: Randomizing the direction barely shrinks the span (median 1.7123 to 1.4713). ★ A stop is an asymmetric operation, so drift still enters from one side even with a random direction. This control did not separate them.
Observation 4.8: ★ What separates them is the baseline in Section 6 — a series built from increments that carry no drift by construction.
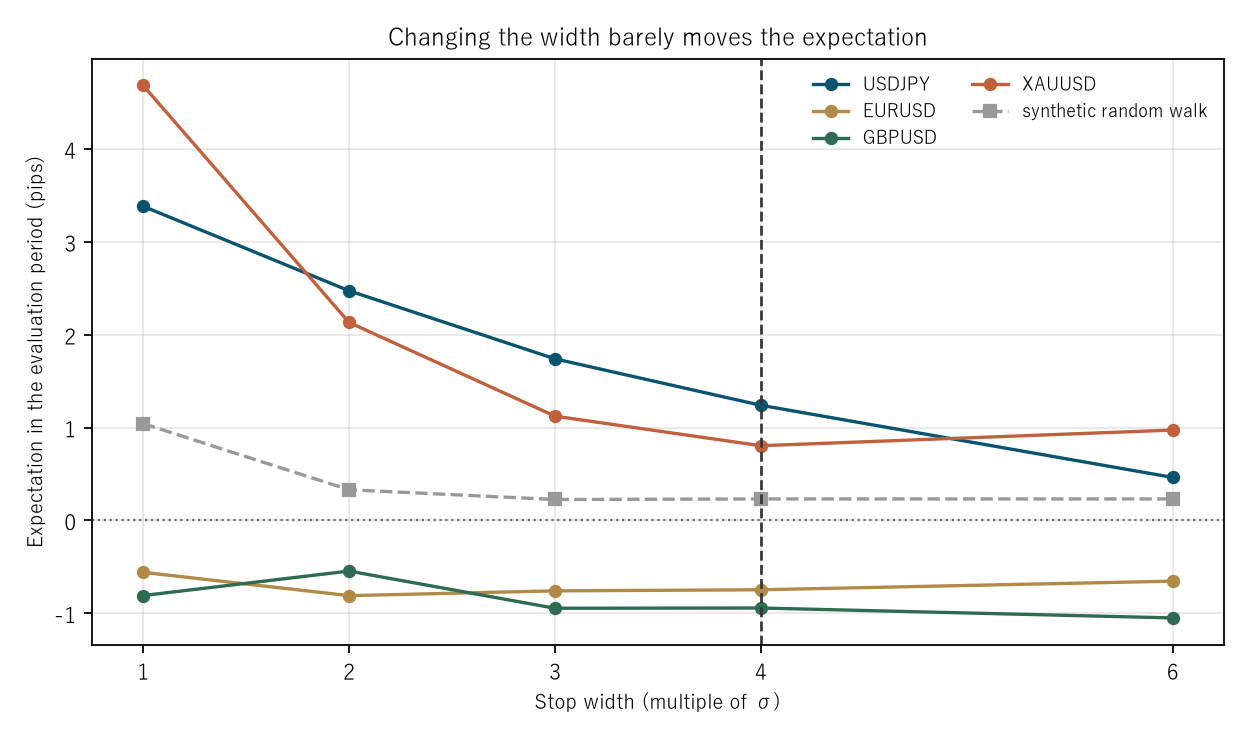
Figure 1: stop width as a multiple of σ on the horizontal axis and the evaluation-period expectation (pips) on the vertical. The coloured lines are the four instruments, the grey dashed line is the median over the synthetic random walks, and the vertical dashed line is the pre-declared 4σ.
5. What a width chosen after the fact bought
The best width in the selection period is taken and compared in the evaluation period against the pre-declared 4σ.
Calculation 5.1 The chosen widths and their evaluation-period results
| Instrument | Best in selection (number) | Best in selection (multiple) | Eval, number | Eval, multiple | Eval, 4σ |
|---|---|---|---|---|---|
| USDJPY | 20 pips | 1σ | 2.6196 | 3.3832 | 1.2400 |
| EURUSD | 50 pips | 6σ | −0.8184 | −0.6545 | −0.7472 |
| GBPUSD | 50 pips | 1σ | −0.7219 | −0.8093 | −0.9436 |
| XAUUSD | 100 pips | 1σ | 4.5433 | 4.6842 | 0.8043 |
Observation 5.2: Prediction ① held. The best number is 20 / 50 / 50 / 100 pips, scattered across instruments.
Observation 5.3: Prediction ② half held. The best multiple is 1σ / 6σ / 1σ / 1σ, with three of four landing on 1σ. ★ But EURUSD alone sits at 6σ, so this is not enough to call it agreement.
Calculation 5.4 The hindsight gain against the standard error of one trade
| USDJPY | EURUSD | GBPUSD | XAUUSD | Median | |
|---|---|---|---|---|---|
| Hindsight (number) − 4σ | +1.3796 | −0.0712 | +0.2217 | +3.7390 | +0.8007 |
| Hindsight (multiple) − 4σ | +2.1432 | +0.0927 | +0.1343 | +3.8800 | +1.1388 |
| SE of one trade | 0.7053 | 0.4023 | 0.5356 | 1.4490 | 0.6205 |
Observation 5.5: ★ Prediction ③ failed. The gain was smaller than the standard error of one trade in only 2 of the four instruments for the numeric family and 2 for the multiple family. On USDJPY and XAUUSD the hindsight width buys a clearly large difference.
Observation 5.6: The width that was best in the selection period was rarely best in the evaluation period: 1 of four for numbers and 2 for multiples.
Observation 5.7: ★ So the numbers in this paper cannot be used to say "hindsight buys nothing". What they say is only that it did not turn out that way on these four instruments. What, then, is this gain? That is settled in the next section.
6. The baseline — the same procedure on a synthetic random walk
A series on which, by construction, there is no width to choose.
Calculation 6.1 Measurement against synthetic random walk
| Measurement | Synthetic random walk | |
|---|---|---|
| Median hindsight (number) − 4σ | 0.8007 | 1.8017 |
| Median hindsight (multiple) − 4σ | 1.1388 | 0.8354 |
| Median SE of one trade | 0.6205 | 0.5671 |
| Median span of expectation over the 5 multiples | 1.7123 | 0.8354 |
Observation 6.2: ★ Here is the answer: the hindsight width buys a gain on the synthetic random walk too. A median of +1.8017 pips in the numeric family — more than the measurement's +0.8007.
Observation 6.3: ★ So "the hindsight gain exceeded the standard error" is evidence of nothing. A larger gain than the measurement's is available on a series where there is nothing to choose.
Observation 6.4: Prediction ⑤ held. A best width in the selection period is always determined on the random walk as well: it could be chosen in all 12 combinations. The evaluation expectations scatter from −0.3432 to 5.3144.
Observation 6.5: ★ The expectation moving with the width also happens on the random walk. The span across the five σ multiples has a median of 1.7123 pips on the measurement and 0.8354 on the random walk. The measurement is about twice as large, but the order of magnitude is the same.
Observation 6.6: ★ So "changing the stop width changed the expectation" says nothing on its own. The same thing happens on a series where there is nothing to choose. What that baseline is zero about was measured in [F033].
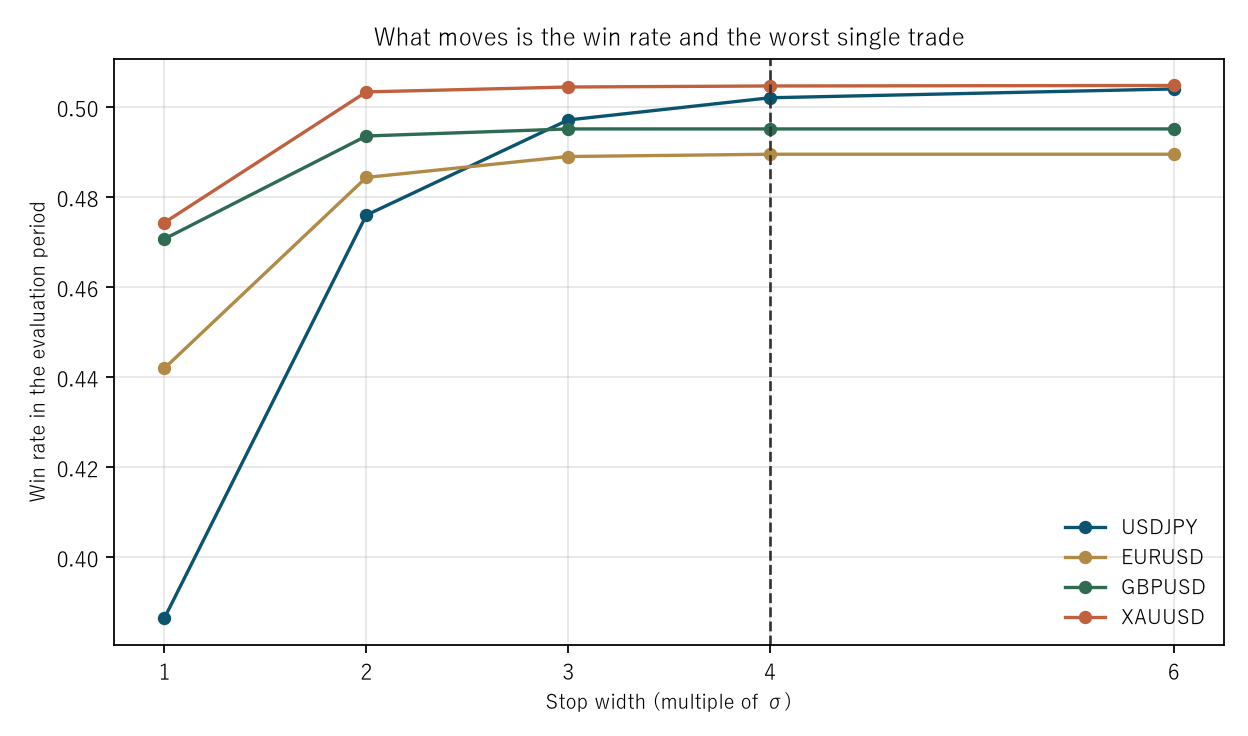
Figure 2: stop width as a multiple of σ on the horizontal axis and the evaluation-period win rate on the vertical. The coloured lines are the four instruments and the vertical dashed line is the pre-declared 4σ. That a tighter width lowers the win rate is common to all four.
7. Limitations
- Predictions ③ and ④ failed. The hindsight gain exceeded the standard error, and the expectation moved with the width. This paper writes those failures and, by comparing against the synthetic random walk, gets as far as "there is a difference, but it is not evidence".
- It is not shown that hindsight buys nothing. What is shown is only that the same gain is available on a synthetic random walk.
- No take-profit is used. The exit is time or stop only; a form with a take-profit is not measured.
- One entry is fixed. Every bar, direction from the previous bar's sign; no other entry is measured.
- The holding time is fixed at 24 bars.
- The inside of the bar is not examined. Stop hits are judged on bar highs and lows.
- No cost is included. Everything is on mid prices, with no slippage and no rejected fills.
- Four instruments, six years, one-hour bars. Nothing is claimed about other markets or other periods.
Conclusion
"A twenty-pip stop worked best." But twenty against what?
The standard deviation σ of the 24-bar forward move runs from 43.1287 to 167.3431 pips across the four instruments, a factor of 3.8801. ★ So the same "twenty pips" is 0.4637σ for EURUSD and 0.1195σ for XAUUSD. One allows nearly half of one trade's own scatter; the other allows an eighth. The same number names a different strictness.
The best number in the selection period is 20 / 50 / 50 / 100 pips, scattered across instruments. Set as a multiple it is 1σ / 6σ / 1σ / 1σ, with three of four on 1σ — but EURUSD breaks ranks, so this is not enough to call it agreement.
★ Two predictions failed. The gain bought by a hindsight width over the pre-declared 4σ was smaller than the standard error of one trade in only 2 of the four instruments; USDJPY buys +2.1432 pips (standard error 0.7053) and XAUUSD +3.8800 (standard error 1.4490). The expectation moves with the width too, from −1.0502 to 4.6842 across 44 combinations, a span of 5.7345 pips.
★ But the baseline invalidates both at once. Run the same procedure on a synthetic random walk and the hindsight gain in the numeric family has a median of +1.8017 pips — more than the measurement's +0.8007. The span of the expectation is 1.7123 pips on the measurement against 0.8354 on the random walk: the same order of magnitude.
★ On a series with nothing to choose, a larger gain than the measurement's is available. So neither "the hindsight gain exceeded the standard error" nor "changing the width changed the expectation" is evidence of anything on its own.
What clearly moves is the win rate and the worst single trade. The win rate runs from 0.0527 to 0.5048, and the worst single trade is fixed at minus the width with a stop and opens to −1056.95 pips without one. ★ That the worst trade equals the width follows from the definition: a check, not a finding.
So what is needed when reporting a stop width is not the number but how the number was decided. ★ A number chosen after seeing the results looks just as good on a synthetic random walk. Declare the multiple first and estimate σ on the selection period only, and at least the room to move it afterwards is gone.
Data and reproduction
| Data | Foreign exchange from Dukascopy-derived ticks (from 2019 onward, matching to the millisecond, bid and ask, has been verified). Gold from Dukascopy |
| Period | 2019–2024 (six years) |
| Instruments | USDJPY, EURUSD, GBPUSD, XAUUSD |
| Bars | 1-hour, mid price, completed bars only. Bars with no ticks are not created |
| Entry | Every bar. Direction is the sign of the previous bar |
| Exit | The close 24 bars later; on the first bar whose adverse extreme crosses the stop, at that level |
| Widths | Numbers 10, 20, 30, 50, 100 pips; multiples 1, 2, 3, 4, 6 σ |
| σ | Standard deviation of the 24-bar forward move over the selection period (2019-01-01 to 2022-01-01) |
| Split | Selection 2019-01-01 to 2022-01-01; evaluation 2022-01-01 to 2025-01-01 |
| Quantities | Expectation, win rate, stop-hit share, worst single trade, standard error of one trade, daily t |
| Baseline | Synthetic random walk down to within the bar (3 draws), built by adding differences of constant spread |
| Verification | 検算/F037.py (--zu also writes the figures). Every number in the text comes from 検算/F037_output.txt |
| Figures | 図/F037_zu1, 図/F037_zu2 (png, svg, English versions) |
| Random seeds | Fixed. Re-running gives the same values |
| Substrate check | _ツール/audit_bars.py (bar look-ahead, daylight saving, day boundary). The record is _土台の検査.txt |
References
- Yamagishi, Y. (2026). Placing the Take Profit and Stop Loss Forty-Nine Ways Does Not Move the Expectation [F012]. Zenodo. 10.5281/zenodo.22891608
- Yamagishi, Y. (2026). A Synthetic Random Walk Has No Volatility Clustering [F033]. Zenodo. 10.5281/zenodo.22893674
Reference
Yamagishi, Y. (2026). Choosing a Stop Width as a Number Is Hindsight [F037]. Zenodo.
DOI: 10.5281/zenodo.22893941
YOI: https://www.yamagishiyuuki.com/yoi/F037
ORCID: 0009-0006-8587-3450
PDF (English) · PDF (Japanese) · Date proof of the English PDF (OpenTimestamps .ots) · SHA256SUMS
The record page for this paper (in Japanese, with the PDFs in each language and the date proof): YOI F037. This paper is a preprint and has not been peer reviewed.