Abstract
What this paper asks is which choice of reference changes the answer when a record kept only to the minute is matched against a market that moves in milliseconds — and the answer is that it is not the reference but whether the recorder reacted inside the minute. No new mathematical theorem and no new law is claimed.
First, ★ prediction ① failed. When the direction comes from outside the minute, referencing the minute's first tick creates no bias. Across 24 combinations of four instruments and six years the median is −0.0038 pips, positive in 8 of them (Sections 3 and 6).
Second, ★ prediction ② failed too. Switching to the minute's mean gives −0.0088 pips. Since ① was already zero there is nothing to compare; both are under 0.01 pips (Sections 3 and 7).
Third, and this is the core of the paper: ★ what creates the bias is whether the recorder reacted to what happened inside the minute. When they did, the bias against the minute's first tick is 0.7944 pips (Section 4).
Fourth, ★ switching the reference to the minute's mean then cuts it to 0.2139 pips — a fall of 0.5805 pips, a factor of 3.7141. The choice of reference matters only when there was a reaction (Section 4).
Fifth, ★ the within-minute rank separates the two under either reference: 49.5483 when the direction came from outside and 61.1288 when it reacted. The rank is affected neither by the rounding nor by the choice of reference (Sections 3 and 4).
Sixth, ★ most of the reaction effect is not the market's. The synthetic random walk gives 0.6544 pips against the first tick. Of the measured 0.7944, a share of 0.8238 is explained by the random walk, leaving 0.1400 pips for the market (Section 5).
Scope of this paper: no new mathematical theorem and no new law is claimed — timestamp rounding, systematic error and rank statistics are all known. No real course, author, or vendor is the subject here, and none is named. No real trading record is examined — the records are synthesized from ticks, and no one's results are being audited (Section 7). No trading is discussed — neither cost nor slippage is included, and everything is on mid prices (Section 7). Predictions ① and ② failed — with the direction from outside the minute, the reference created no bias (Sections 3 and 7). One form of reaction is fixed — only the sign of the within-minute move; partial reactions are not measured (Section 7). The scope is intraday and few instruments — four instruments over six years, 20,000 minutes sampled per instrument-year. Results documented at longer holding periods, such as monthly time-series momentum, are not contradicted. No prediction is claimed.
1. Notation and the question
A trading record is often kept only to the minute. The market moves in milliseconds.
| What gets said | What does not get said |
|---|---|
| The record was matched against the market price | Against which point inside that minute |
| The recorded price was worse than the market | Whether the recorder saw something inside that minute and acted |
| Rounding has little effect | That a statistic robust to rounding exists |
Observation 1.1: ★ The true fill behind a minute-rounded record is somewhere inside that minute. Where, nobody knows.
Observation 1.2: So a reference point has to be chosen. ★ The minute's first tick, or the minute's mean. The choice looks like a detail of preprocessing. That a choice of convention can manufacture an answer was measured in [F040].
Observation 1.3: The separator is the reference point. The records, the minutes, the instruments and the period are all held fixed, and only what they are compared against is changed.
Question: which choice of reference changes the answer when a minute-rounded record is matched against a millisecond market?
2. State the quantities and the design first
Declared before the run and unchanged during it.
| Source | Ticks (mid price), grouped by minute |
| Sample | 20,000 minutes at random per instrument-year (at least 10 ticks, the previous minute contiguous, fixed seed) |
| Record | The mid at a uniformly random instant inside the minute. The timestamp is rounded to the minute |
| References | A the minute's first tick / B the minute's mean / C the within-minute rank (0–100) |
| Directions | P1 the sign of the previous minute / P2 the sign of the within-minute move / P3 random |
| Quantities | (record − reference) × direction (pips), within-minute rank, the minute's move |
| Baseline | The ticks inside the minute replaced by a synthetic random walk of the same count and the same per-step scatter |
| Separator | The reference point (the first tick, the mean, or the rank) |
| Instruments and period | USDJPY, EURUSD, GBPUSD, XAUUSD / 2019–2024 |
Observation 2.1: ★ The record is drawn at a uniformly random instant inside the minute. If real fill times are uniform inside the minute, this is the right model.
Observation 2.2: ★ Having three ways to set the direction is the point. P1 uses only information from outside the minute, P2 is someone who looked inside it and reacted, and P3 is the control.
Observation 2.3: P2 is positive by definition. ★ It is placed there as an upper bound, not as a finding.
Observation 2.4: The sample is 120,000 minutes per instrument and 480,000 in total.
Predictions (written before measuring)
① Referencing the minute's first tick makes a record entered on the previous minute's direction look systematically biased (not zero).
② Referencing the minute's mean brings that bias to about 0.
③ With a random direction the bias is 0 under every reference.
④ The within-minute rank stays near 50 when the direction came from the previous minute.
⑤ On a synthetic random walk the bias in ① disappears (there is no one-minute momentum).
3. How much the answer changes with the reference
The same records, the same minutes. Only what they are compared against differs.
Calculation 3.1 Median over four instruments and six years
| Direction | Reference A, first tick | Reference B, minute mean | Reference C, rank |
|---|---|---|---|
| P1 previous minute's sign | −0.0038 | −0.0088 | 49.5483 |
| P2 within-minute sign | 0.7944 | 0.2139 | 61.1288 |
| P3 random | −0.0008 | −0.0012 | 50.0255 |
Observation 3.2: ★ Prediction ① failed. P1 against reference A is −0.0038 pips. The minute's move (the mean distance from the record to the first tick) is 0.7944 pips, so this is only −0.0048 of it.
Observation 3.3: ★ Prediction ② failed too. Reference B gives −0.0088 pips, farther from 0 than A. Since ① was already zero, there is nothing to compare.
Observation 3.4: The same holds instrument by instrument. P1 against reference A is 0.0115 for USDJPY, −0.0042 for EURUSD, −0.0090 for GBPUSD and −0.0112 for XAUUSD. ★ The signs do not agree and none exceeds 0.02 pips.
Observation 3.5: ★ The within-minute rank is 49.5483, right beside 50. Prediction ④ held.
Observation 3.6: The minute's move differs by instrument (0.7701, 0.5524, 0.7627 and 1.9812 pips). ★ The P1 bias stays at zero regardless.
4. What creates the bias is the reaction, not the reference
Calculation 4.1 What changes with how the direction is set
| Direction | Reference A | Reference B | Reference C |
|---|---|---|---|
| Previous minute's sign (no look-ahead) | −0.0038 | −0.0088 | 49.5483 |
| Within-minute sign (reacted) | 0.7944 | 0.2139 | 61.1288 |
| Random (control) | −0.0008 | −0.0012 | 50.0255 |
Observation 4.2: ★ This is the core of the paper: what creates the bias is not the reference but whether there was a reaction. With one it is 0.7944 pips against reference A; without one, −0.0038.
Observation 4.3: P2 against reference A is about the same as the minute's move, 0.7944 pips. ★ By definition the record sits where the price moved to from the first tick, so it must be. A check, not a finding.
Observation 4.4: Prediction ③ held. P3 gives −0.0008 pips against reference A and 50.0255 against reference C.
Calculation 4.5 By how much does changing the reference reduce the reaction effect? (★ added afterwards)
This part is after the fact. Once predictions ① and ② had failed, the question was re-posed and measured.
| Reference A, first tick | Reference B, minute mean | A ÷ B | |
|---|---|---|---|
| Direction from outside the minute | −0.0038 | −0.0088 | 0.4324 |
| Direction from inside the minute | 0.7944 | 0.2139 | 3.7141 |
Observation 4.6: ★ With a reaction, switching the reference from the first tick to the mean takes 0.7944 to 0.2139 pips, a fall of 0.5805. A factor of 3.7141.
Observation 4.7: ★ With the direction from outside the minute it is 0.0038 or 0.0088 pips either way, both under 0.01. The choice of reference matters only when there was a reaction.
Observation 4.8: ★ The within-minute rank separates the two independently of either reference: 61.1288 with a reaction and 49.5483 without. The rank is affected neither by the rounding nor by the choice of reference.
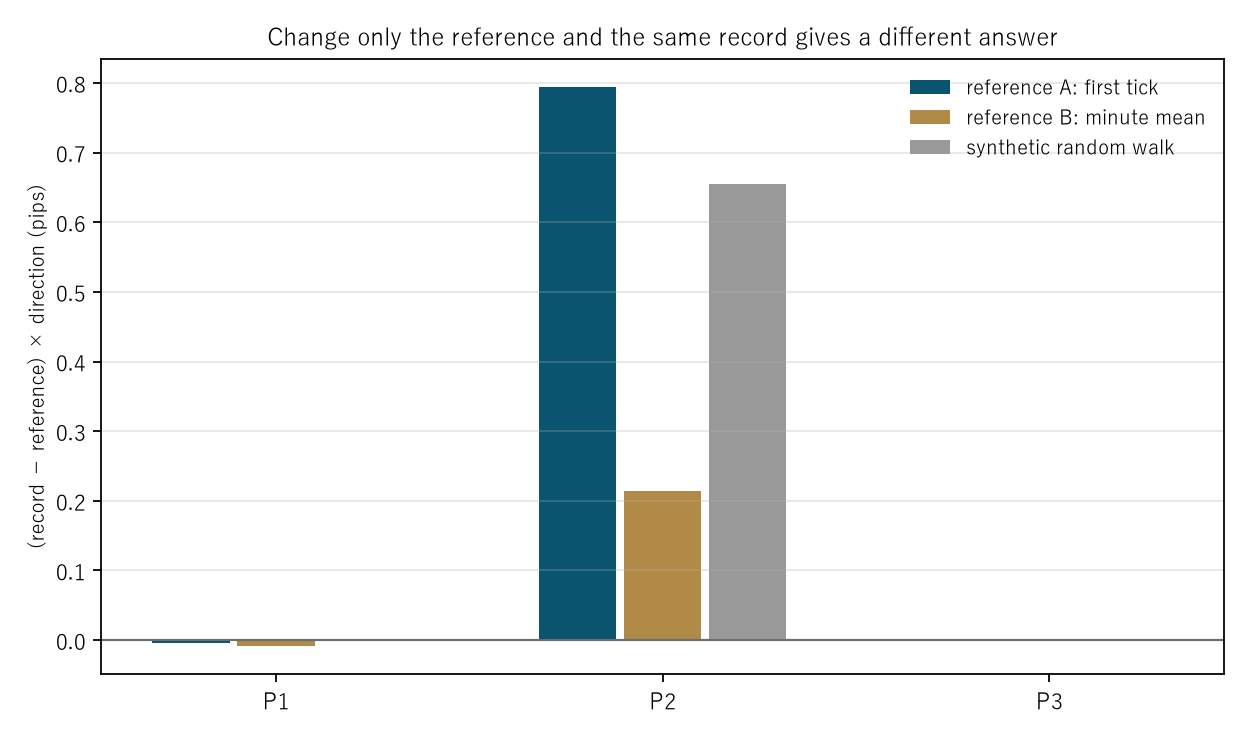
Figure 1: (record − reference) × direction (pips) for the three ways of setting the direction. From the left: reference A (first tick), reference B (minute mean), and reference A on the synthetic random walk.
5. The baseline — replacing the inside of the minute with a random walk
The same tick count and the same per-step scatter. The only difference is that there is no one-minute momentum.
Calculation 5.1 Measurement against synthetic random walk
| Direction | A, meas. | A, RW | B, meas. | B, RW | C, meas. | C, RW |
|---|---|---|---|---|---|---|
| P1 | −0.0038 | 0.0007 | −0.0088 | −0.0002 | 49.5483 | 49.9556 |
| P2 | 0.7944 | 0.6544 | 0.2139 | 0.2094 | 61.1288 | 62.8083 |
| P3 | −0.0008 | 0.0018 | −0.0012 | 0.0010 | 50.0255 | 50.0561 |
Observation 5.2: Prediction ⑤ held. The measurement is −0.0038 against the random walk's 0.0007 pips. ★ Though since the measurement was already zero, there was nothing to make disappear. What this baseline is zero about was measured in [F033].
Calculation 5.3 How much of the reaction effect is the market's? (★ added afterwards)
| Measurement | Random walk | Difference | Share from the random walk | |
|---|---|---|---|---|
| Reference A | 0.7944 | 0.6544 | 0.1400 | 0.8238 |
| Reference B | 0.2139 | 0.2094 | 0.0045 | 0.9789 |
| Reference C | 61.1288 | 62.8083 | −1.6795 | 1.1509 |
Observation 5.4: ★ Most of the reaction effect is not the market's. The random walk explains 0.8238 of it under reference A and 0.9789 under reference B.
Observation 5.5: ★ For the rank the random walk is even larger (62.8083 against 61.1288). The share is 1.1509, above 1.
Observation 5.6: ★ So "the record of someone who reacted looks worse than the minute's first tick" is not a property of the market. It comes from the arithmetic of recording where the price moved to inside the minute.
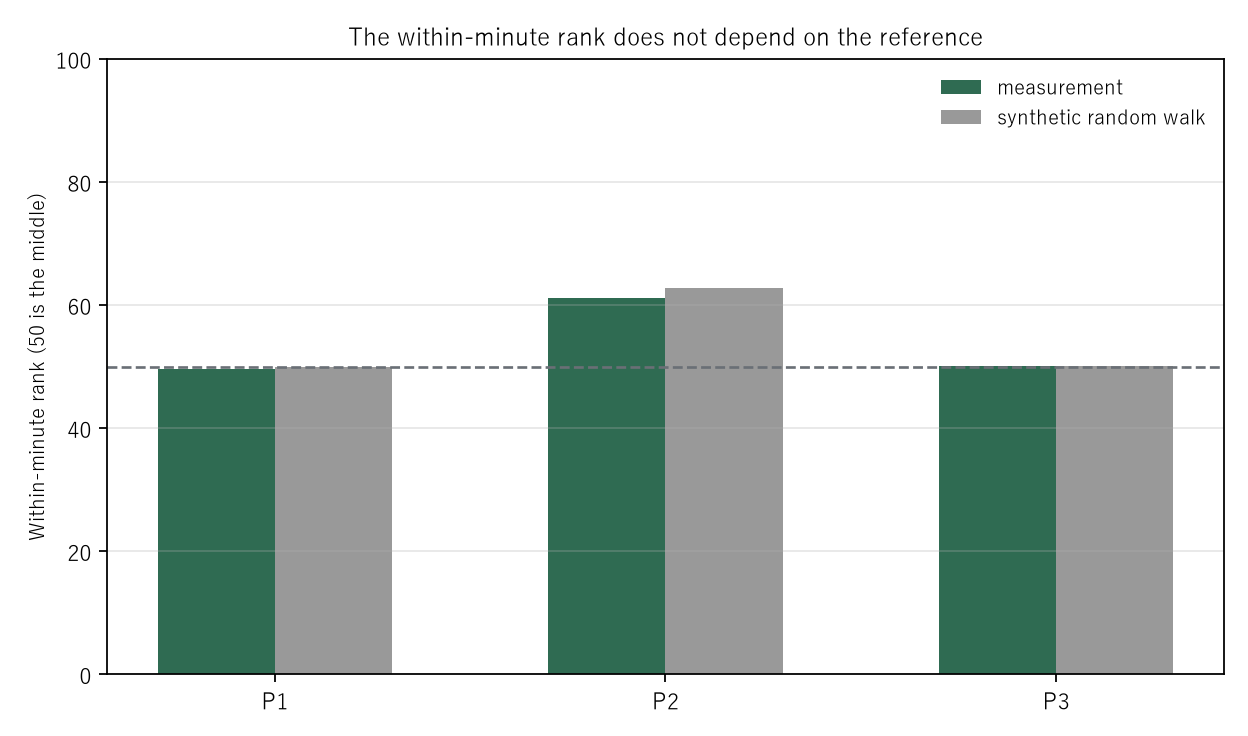
Figure 2: the within-minute rank (0–100) for the three ways of setting the direction. The darker bars are the measurement, the lighter ones the synthetic random walk, and the dashed line is 50.
6. Year by year
Calculation 6.1 P1 against reference A (pips)
| Year | USDJPY | EURUSD | GBPUSD | XAUUSD | Median |
|---|---|---|---|---|---|
| 2019 | −0.0100 | −0.0058 | −0.0038 | −0.0100 | −0.0079 |
| 2020 | 0.0116 | −0.0163 | −0.0411 | −0.0574 | −0.0287 |
| 2021 | 0.0099 | −0.0027 | 0.0032 | −0.0124 | 0.0003 |
| 2022 | 0.0254 | −0.0155 | −0.0252 | −0.0563 | −0.0203 |
| 2023 | 0.0460 | −0.0010 | 0.0019 | −0.0021 | 0.0004 |
| 2024 | 0.0115 | 0.0049 | −0.0141 | −0.0038 | 0.0006 |
Observation 6.2: ★ Across 24 combinations the median is −0.0038 pips, the range −0.0574 to 0.0460, and 8 are positive. The signs do not agree.
Observation 6.3: Reference B is the same: median −0.0088, range −0.0571 to 0.0004, with 1 positive. ★ It leans slightly negative, but the size is in the hundredths of a pip.
Observation 6.4: Reference C ranges from 48.9215 to 49.9028. ★ All 24 sit just below 50.
Observation 6.5: USDJPY in 2023 alone is a little larger at 0.0460. ★ The mechanism is not measured.
7. Limitations
- Predictions ① and ② failed. With the direction from outside the minute, the reference created no bias. This paper writes those failures and re-poses the question as "the reference, or the reaction".
- No real trading record is examined. The records are synthesized from ticks, and no one's results are audited.
- Fill times are assumed uniform inside the minute. If they are skewed in practice, the results change.
- One form of reaction is fixed: only the sign of the within-minute move; partial reactions are not measured.
- No trading is discussed. Neither cost nor slippage is included, and everything is on mid prices.
- The sample is capped at 20,000 minutes per instrument-year. Using every minute would shift the values slightly.
- The mechanism behind USDJPY's larger 2023 value is not measured.
- Four instruments, six years. Nothing is claimed about other markets or other periods.
Conclusion
A trading record is often kept only to the minute; the market moves in milliseconds. To match them, a reference point has to be chosen.
★ Two predictions failed. When the direction comes from outside the minute, no reference creates a bias. It is −0.0038 pips against the minute's first tick and −0.0088 against the mean. Across 24 combinations the range is −0.0574 to 0.0460, with 8 positive: the signs do not even agree.
★ What creates the bias is not the reference. It is whether the recorder reacted to what happened inside the minute. With a reaction, the bias against the first tick is 0.7944 pips. That is about the minute's move of 0.7944 pips — a value that follows from the definition.
★ Only then does the reference matter. Switching to the mean cuts it to 0.2139 pips: a fall of 0.5805, a factor of 3.7141.
★ And most of the reaction effect is not the market's. The synthetic random walk gives 0.6544 pips against the first tick. Of the measured 0.7944, a share of 0.8238 is explained by the random walk, leaving 0.1400 pips for the market. Under reference B, 0.9789 is the random walk and only 0.0045 pips remain.
★ Only the within-minute rank is affected neither by the rounding nor by the reference. It is 49.5483 when the direction came from outside and 61.1288 with a reaction — and 62.8083 on the random walk, larger than the measurement.
So what matters when matching a minute-rounded record is not where the reference was taken. ★ It is whether the recorder saw something inside that minute and acted. And of "it looks like a worse fill", a share of 0.8238 comes from arithmetic, not the market.
Data and reproduction
| Data | Foreign exchange from Dukascopy-derived ticks (from 2019 onward, matching to the millisecond, bid and ask, has been verified). Gold from Dukascopy |
| Period | 2019–2024 (six years) |
| Instruments | USDJPY, EURUSD, GBPUSD, XAUUSD |
| Source | Tick mid prices, grouped by minute |
| Sample | 20,000 minutes at random per instrument-year (at least 10 ticks, the previous minute contiguous). 480,000 minutes in total |
| Record | The mid at a uniformly random instant inside the minute; the timestamp rounded to the minute |
| References | A the minute's first tick / B the minute's mean / C the within-minute rank (0–100) |
| Directions | P1 the previous minute's sign / P2 the within-minute sign / P3 random |
| Quantities | (record − reference) × direction (pips), within-minute rank, the minute's move |
| Baseline | The ticks inside the minute replaced by a synthetic random walk of the same count and per-step scatter |
| Verification | 検算/F041.py (--zu also writes the figures). Every number in the text comes from 検算/F041_output.txt |
| Figures | 図/F041_zu1, 図/F041_zu2 (png, svg, English versions) |
| Random seeds | Fixed. Re-running gives the same values |
| Substrate check | _ツール/audit_bars.py (bar look-ahead, daylight saving, day boundary). The record is _土台の検査.txt |
References
- Yamagishi, Y. (2026). A Synthetic Random Walk Has No Volatility Clustering [F033]. Zenodo. 10.5281/zenodo.22893674
- Yamagishi, Y. (2026). A Renko Turning Point Is Not a Turning Point Until the Brick Completes [F040]. Zenodo. 10.5281/zenodo.22894529
Reference
Yamagishi, Y. (2026). The Bias in a Minute-Rounded Record Belongs to Whether the Recorder Reacted [F041]. Zenodo.
DOI: 10.5281/zenodo.22894667
YOI: https://www.yamagishiyuuki.com/yoi/F041
ORCID: 0009-0006-8587-3450
PDF (English) · PDF (Japanese) · Date proof of the English PDF (OpenTimestamps .ots) · SHA256SUMS
The record page for this paper (in Japanese, with the PDFs in each language and the date proof): YOI F041. This paper is a preprint and has not been peer reviewed.