Abstract
What this paper asks is how much including the previous close in ATR's "true range" actually does. No new mathematical theorem and no new law is claimed.
First, and this is the core of the paper: ★ the gap term binds on only a small share of bars. It is 0.0897 on 5-minute bars, 0.0575 on 15-minute, 0.0446 on hourly and 0.0370 on 4-hour bars. And even when it binds, TR ÷ range is only 1.0140 to 1.0761 (Section 3).
Second, ★ so ATR is, most of the time, just the range. The median of ATR ÷ the mean of the range alone is 1.0000 on both hourly and 4-hour bars. Prediction ③ failed (Section 3).
Third, ★★ at the weekly open, however, it becomes a different thing. The gap binds on 0.4841, 0.5000, 0.4586 and 0.3119 of those bars — 11.3968 times the rate elsewhere. By hour, 21:00 UTC peaks at 0.1113, 4.7187 times the 0.0236 of 9:00 (Section 4).
Fourth, ★ position size barely moves most of the time, and occasionally moves a great deal. The median of ATR ÷ the mean of the range alone is 1.0000, but the maximum is 2.0116 (Section 5).
Fifth, ★ the gap adds nothing to the power to separate the forward magnitude. The fifth ÷ first quintile is 1.5752 by TR and 1.5703 by range alone (a ratio of 1.0031) (Section 6).
Sixth, ★★ prediction ④ failed, and the way it failed gave the mechanism. The synthetic random walk binds 5.6573 times more often than the measurement. The rate at which the gap binds is set by how many steps were walked inside the bar (from 0.4919 down to 0.0561) (Section 7).
Scope of this paper: no new mathematical theorem and no new law is claimed — the definition of the true range is published. No real course, author, or vendor is the subject here, and none is named. No particular data feed is discussed — the size of a gap depends on the feed (Section 7). No trading is discussed — neither performance nor profit and loss is measured. Predictions ③ and ④ failed — ④ was wrong in its reasoning (Section 7). One period is fixed — 14 bars (Section 7). The scope is intraday and few instruments — four instruments over six years. Results documented at longer holding periods, such as monthly time-series momentum, are not contradicted. No prediction is claimed.
1. Notation and the question
ATR is described as "the average range". But the true range inside it is written like this:
TR = max( high − low , |high − previous close| , |low − previous close| )
| What gets said | What does not get said |
|---|---|
| ATR is the average range | That the previous close is in there |
| The true range also catches gaps | On what share of bars it does |
| I size my positions with ATR | When that ATR turns into a different quantity |
Observation 1.1: ★ This is a mixture of two quantities. One is the movement while the market is open, the other is what happened between one bar and the next.
Observation 1.2: ★ TR is a max, so on bars where the gap does not bind, TR and the range are exactly equal. That makes "did it bind" countable.
Observation 1.3: The separator here is whether the previous close was included. The instruments, the period, the grid and the averaging length are all held fixed, and only whether the previous close goes in is changed.
Question: how much does including it actually do?
2. State the quantities and the design first
Declared before the run and unchanged during it.
| Grid | 5 min / 15 min / 1 hour / 4 hour (mid price, completed bars only) |
| TR | max(high−low, |high−previous close|, |low−previous close|) |
| Range | high − low (the version without the previous close) |
| Period | 14 bars (ATR's convention) |
| Weekly open | A bar whose gap in time from the previous one is 24 hours or more |
| Forward | 24 bars / quintiles |
| Baseline | Synthetic random walk down to within the bar (3 draws) |
| Separator | Whether the previous close was included |
| Instruments and period | USDJPY, EURUSD, GBPUSD, XAUUSD / 2019–2024 |
Observation 2.1: ★ The definition of "bound" is the point. Only bars where TR > range are counted. On bars where they are equal, the previous close added nothing.
Observation 2.2: The hourly series have 36,534 bars for USDJPY, 36,554 for EURUSD, 36,535 for GBPUSD and 34,892 for XAUUSD. ★ The median number of ticks inside one bar is 3,671, 3,369, 3,740 and 6,743. That number matters in Section 7.
Observation 2.3: ★ That a candle's shape belongs to the way the bars were cut was measured in [F020]. What this paper adds is to take out just the "difference from the previous close" part of that shape.
Predictions (written before measuring)
① The longer the bar, the smaller the share on which the gap binds.
② ★ It binds at particular hours (the daily boundary and the weekly open).
③ ATR ÷ the mean of the range alone exceeds 1, and more so on shorter bars.
④ ★★ The gap never binds on a synthetic random walk. A walk taken down to within the bar starts from the previous bar's close, so there is no gap by construction.
⑤ ★ The difference in position size is largest at the weekly open.
⑥ The power to separate the forward magnitude barely differs between TR and the range.
3. The gap binds on 3.7 to 9.0 per cent of bars
Calculation 3.1 By bar size (median of the four instruments)
| Bar size | Share where the gap binds | Median range (pips) | Median TR (pips) | ATR ÷ mean range | TR ÷ range where it binds |
|---|---|---|---|---|---|
| 5m | 0.0897 | 3.7250 | 3.7500 | 1.0017 | 1.0285 |
| 15m | 0.0575 | 6.7500 | 6.8000 | 1.0004 | 1.0169 |
| 1h | 0.0446 | 14.0500 | 14.1250 | 1.0000 | 1.0140 |
| 4h | 0.0370 | 28.6875 | 28.9250 | 1.0000 | 1.0761 |
Observation 3.2: Prediction ① held. The share falls from 0.0897 to 0.0370.
Observation 3.3: ★★ Prediction ③ failed. ATR ÷ the mean of the range alone runs from 1.0017 to 1.0000, and on hourly and 4-hour bars it is exactly 1. The gap binds on about one bar in twenty and lifts it by only 1.0140 when it does, so averaging over 14 bars wipes it out.
Observation 3.4: ★ So ATR is, most of the time, just the range. The part of the name that says "true" adds nothing on almost every bar.
Calculation 3.5 The share by instrument
| Instrument | 5m | 15m | 1h | 4h |
|---|---|---|---|---|
| USDJPY | 0.0903 | 0.0576 | 0.0445 | 0.0351 |
| EURUSD | 0.0891 | 0.0575 | 0.0469 | 0.0393 |
| GBPUSD | 0.0902 | 0.0586 | 0.0447 | 0.0389 |
| XAUUSD | 0.0705 | 0.0457 | 0.0313 | 0.0235 |
Observation 3.6: ★ Gold is systematically lower (0.0705 on 5-minute, 0.0235 on 4-hour). A plausible reading is its 6,743 ticks per bar, and the mechanism is measured in Section 7.
4. When does the gap bind?
Calculation 4.1 The weekly open against everything else (1h)
| Instrument | Weekly open | Elsewhere | Ratio | Bars at the weekly open |
|---|---|---|---|---|
| USDJPY | 0.4841 | 0.0407 | 11.8950 | 314 |
| EURUSD | 0.5000 | 0.0430 | 11.6378 | 314 |
| GBPUSD | 0.4586 | 0.0411 | 11.1557 | 314 |
| XAUUSD | 0.3119 | 0.0287 | 10.8508 | 311 |
Observation 4.2: ★★ At the weekly open it binds 11.3968 times as often. For EURUSD that is 0.5000 — one bar in two.
Observation 4.3: Prediction ② held. By hour, 21:00 UTC peaks at 0.1113, 4.7187 times the 0.0236 of 9:00.
Observation 4.4: ★ 21:00 and 22:00 UTC (0.1113 and 0.1007) are the daily boundary. So the gap binds right after the market has been standing still.
Observation 4.5: ★ The description "ATR also catches gaps" is not wrong. What is wrong is the sense that it is always doing so. It is doing so on 314 bars at the weekly open.
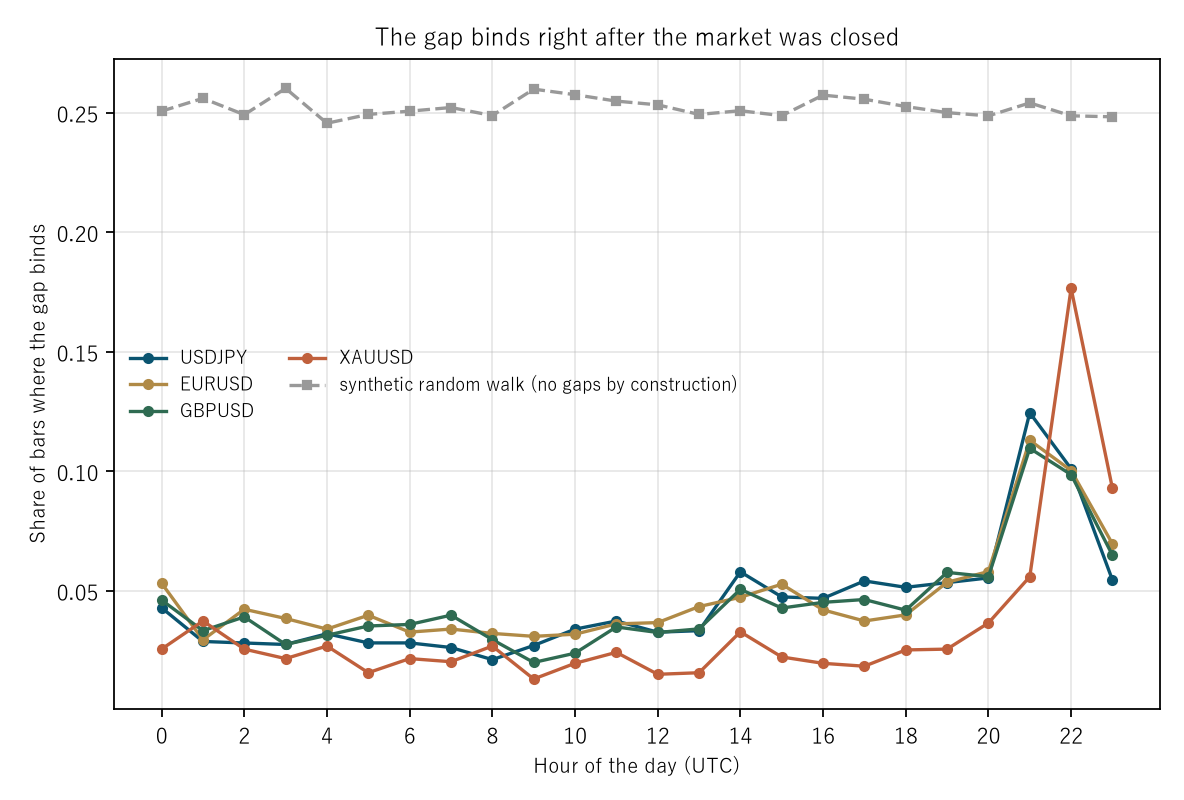
Figure 1: hour of the day (UTC) on the horizontal axis and the share of bars where the gap binds on the vertical. The four instruments are shown beside the synthetic random walk.
5. Position size barely moves, then occasionally moves
If size ∝ 1 ÷ ATR, then ATR ÷ the mean of the range alone is exactly the factor by which the position shrinks.
Calculation 5.1 Hourly bars
| Instrument | Median ATR | Median mean range | Ratio (median) | Ratio (max) | Ratio at the weekly open |
|---|---|---|---|---|---|
| USDJPY | 14.0036 | 13.9464 | 1.0000 | 1.4912 | 1.0014 |
| EURUSD | 12.2500 | 12.1286 | 1.0000 | 1.4461 | 1.0025 |
| GBPUSD | 17.6571 | 17.4464 | 1.0000 | 1.5064 | 1.0012 |
| XAUUSD | 43.6336 | 43.5282 | 1.0000 | 2.0116 | 1.0000 |
Observation 5.2: Prediction ⑤ held. The ratio at the weekly open has a median of 1.0013, above the 1.0000 elsewhere. ★ The gap between 1.0013 and 1.0000 is all it is, however.
Observation 5.3: ★★ At the largest, on the other hand, it reaches 2.0116. There really are 14-bar windows where gold's ATR is twice the mean of its range alone.
Observation 5.4: ★ That is ATR's character. Nothing happens at the median, and the tail doubles. Calling it "the average range" is right at the middle and wrong at the edge.
6. Does the gap add power to separate the forward magnitude?
Layer ratio = the layer's forward |move| ÷ the overall mean (hourly bars, 24 bars ahead).
Calculation 6.1 Splitting by TR against splitting by the range alone
| Split by | 1st | 2nd | 3rd | 4th | 5th | 5th ÷ 1st |
|---|---|---|---|---|---|---|
| TR (gap included) | 0.7977 | 0.9088 | 0.9714 | 1.0675 | 1.2566 | 1.5752 |
| Range alone | 0.7992 | 0.9085 | 0.9725 | 1.0669 | 1.2550 | 1.5703 |
Observation 6.2: Prediction ⑥ held. The fifth ÷ first quintile is 1.5752 against 1.5703, a ratio of 1.0031.
Observation 6.3: ★ In none of the five layers does the difference reach the second decimal place. Adding the previous close does not change the power to separate the forward magnitude.
Observation 6.4: ★ This does not mean the gap carries no information. A quantity that binds on 0.0446 of bars, mixed in with every other bar and averaged, is bound to wash out. This paper measures only what is left after the washing out.
7. The baseline and limitations
Calculation 7.1 The same procedure on a synthetic random walk (1h)
| Instrument | Measured share | Random walk's share | Measured ATR ÷ range | Random walk's ATR ÷ range |
|---|---|---|---|---|
| USDJPY | 0.0445 | 0.2523 | 1.0000 | 1.0284 |
| EURUSD | 0.0469 | 0.2523 | 1.0000 | 1.0284 |
| GBPUSD | 0.0447 | 0.2523 | 1.0000 | 1.0284 |
| XAUUSD | 0.0313 | 0.2529 | 1.0000 | 1.0285 |
Observation 7.2: ★★ Prediction ④ failed, and in the opposite direction. The random walk binds 5.6573 times more often than the measurement.
Observation 7.3: ★ Here is where I went wrong. I thought "a walk taken down to within the bar starts from the previous bar's close, so there is no gap by construction". But a bar's high and low are taken only from the points walked inside that bar. The previous close is not among them, so if the bar moves one way throughout, the gap binds.
Observation 7.4: ★★ So the number of steps walked inside the bar was varied (★ added afterwards).
Calculation 7.5 How many steps were walked inside the bar
| Steps inside the bar | Share where the gap binds | ATR ÷ range |
|---|---|---|
| 5 | 0.4919 | 1.1574 |
| 20 | 0.2523 | 1.0284 |
| 100 | 0.1117 | 1.0041 |
| 400 | 0.0561 | 1.0003 |
| measurement | 0.0446 | 1.0000 |
Observation 7.6: ★★ Raising the steps from 5 to 400 drops the share from 0.4919 to 0.0561, a factor of 8.7628. The measured 0.0446 sits right at the end of that column.
Observation 7.7: ★★ So the gap binds not because "the market was closed" but because the path inside that bar did not come back to the previous close. A real bar holds a median of 3,706 ticks, so the path is fine-grained and on almost every bar it does come back.
Observation 7.8: ★ That also reads Section 3's low figure for gold. Gold holds 6,743 ticks per bar, against 3,369 to 3,740 for the other three.
Observation 7.9: ★ What this baseline is zero about was measured in [F033]. And the shape "the answer is set by the resolution" was measured in [F046]. ★ This paper is the third instance.
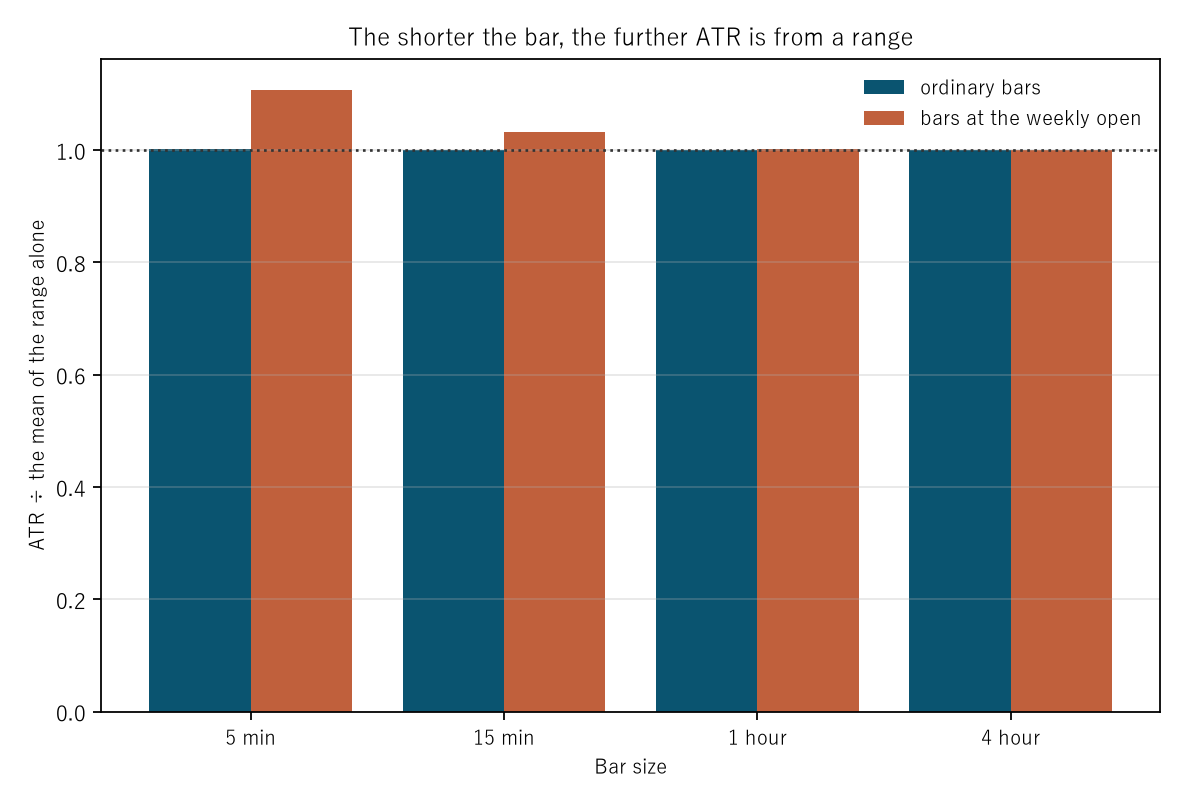
Figure 2: bar size on the horizontal axis and ATR ÷ the mean of the range alone on the vertical. Ordinary bars sit beside bars at the weekly open, with a line drawn at 1.
Limitations
- Prediction ④ was wrong in its reasoning. This paper writes that error down and measures the mechanism again. No prediction was rewritten.
- Prediction ③ failed too. ATR ÷ the mean of the range alone did not exceed 1.
- One period is fixed: 14 bars. A different period washes out differently.
- No particular data feed is discussed. The size of a gap depends on the feed, and one was used here.
- Only what is left after the washing out is measured. Bars where the gap binds were not taken out on their own and followed forward.
- No trading is discussed. Neither performance nor profit and loss is measured.
- Four instruments, six years. Nothing is claimed about other markets or other periods.
Conclusion
The true range inside ATR includes the previous close. So how much does that do?
★ The gap binds on 0.0370 to 0.0897 of bars. And when it binds, TR ÷ range is only 1.0140 to 1.0761.
★ So averaging over 14 bars wipes it out. The median of ATR ÷ the mean of the range alone is 1.0000 on both hourly and 4-hour bars. ATR is, most of the time, just the range.
★★ At the weekly open, however, it becomes a different thing. The gap binds 11.3968 times as often, and for EURUSD that is 0.5000 — one bar in two. By hour, 21:00 UTC peaks at 0.1113, 4.7187 times the figure for 9:00.
★ In position terms, nothing happens at the median (1.0000) and the maximum reaches 2.0116. A quantity that is right at the middle and wrong at the edge.
★ The gap adds nothing to the power to separate the forward magnitude. The fifth ÷ first quintile is 1.5752 against 1.5703, a ratio of 1.0031. That is, however, the result of mixing a quantity that binds on one bar in twenty into every bar and averaging.
★★ And prediction ④ failed, with the failure giving the mechanism. The random walk binds 5.6573 times more often. Raising the steps walked inside a bar from 5 to 400 drops the share from 0.4919 to 0.0561, a factor of 8.7628, and the measured 0.0446 sits right at the end.
★★ So the gap binds not because the market was closed but because the path inside that bar did not come back to the previous close. A real bar holds a median of 3,706 ticks, so on almost every bar it does.
Calling ATR "the average range" is therefore accurate most of the time. ★ It stops being accurate on the 314 bars where the market really had stopped, and in the tail.
Data and reproduction
| Data | Foreign exchange from Dukascopy-derived ticks (from 2019 onward, matching to the millisecond, bid and ask, has been verified). Gold from Dukascopy |
| Period | 2019–2024 (six years) |
| Instruments | USDJPY, EURUSD, GBPUSD, XAUUSD |
| Bars | 5 min, 15 min, 1 hour, 4 hour, mid price, completed bars only. Bars with no ticks are not created |
| TR | max(high−low, |high−previous close|, |low−previous close|) |
| Range | high − low (the version without the previous close) |
| Period | 14 bars. ATR and the mean of the range use the same length |
| Weekly open | A bar whose gap in time from the previous one is 24 hours or more |
| Layers | Quintiles. 24 bars ahead; the layer ratio is the layer's forward |move| ÷ the overall mean |
| Baseline | Synthetic random walk down to within the bar (3 draws), also measured with 5, 20, 100 and 400 steps inside the bar |
| Verification | 検算/F047.py (--zu also writes the figures). Every number in the text comes from 検算/F047_output.txt |
| Figures | 図/F047_zu1, 図/F047_zu2 (png, svg, English versions) |
| Random seeds | Fixed. Re-running gives the same values |
| Substrate check | _ツール/audit_bars.py (bar look-ahead, daylight saving, day boundary). The record is _土台の検査.txt |
References
- Yamagishi, Y. (2026). Candlestick Shapes Belong to the Way the Bars Were Cut [F020]. Zenodo. 10.5281/zenodo.22891997
- Yamagishi, Y. (2026). A Synthetic Random Walk Has No Volatility Clustering [F033]. Zenodo. 10.5281/zenodo.22893674
- Yamagishi, Y. (2026). A Win Rate Layered by the Depth of the Pullback Belongs to What You Measured the Touch With [F046]. Zenodo. 10.5281/zenodo.22895278
Reference
Yamagishi, Y. (2026). The "True Range" in ATR Is, Most of the Time, Just the Range [F047]. Zenodo.
DOI: 10.5281/zenodo.22896724
YOI: https://www.yamagishiyuuki.com/yoi/F047
ORCID: 0009-0006-8587-3450
PDF (English) · PDF (Japanese) · Date proof of the English PDF (OpenTimestamps .ots) · SHA256SUMS
The record page for this paper (in Japanese, with the PDFs in each language and the date proof): YOI F047. This paper is a preprint and has not been peer reviewed.