Abstract
What this paper asks is what applying three conditions does beyond cutting the count. No new mathematical theorem and no new law is claimed.
First, ★ the count falls a great deal. All three together give a pass rate of 0.3336, cutting 36,459 bars to 11,876 — a factor of 3.0700 (Section 3).
Second, and this is the core of the paper: ★★ the directional value does not move. D goes from +1.5497 to +1.7419 pips, a change of 0.1922 (Section 3).
Third, ★★ it cannot be told apart from random conditions at the same pass rate. With all three, the gap is +0.1984 pips against a standard error of the mean of 0.6338. Across the seven combinations, gap ÷ spread has a median of 0.8892 and a maximum of 2.0235 (Section 4).
Fourth, ★ the three conditions are not independent. The actual pass rate is 2.9314 times the product of the three. They are not saying three separate things but restating one rise three times (Section 5).
Fifth, ★ a synthetic random walk gives the same shape. All three together pass at 0.3435, D is +1.1826 pips and the ratio to the product is 3.0702 (Section 6).
Sixth, ★ the daily t does fall, from +0.9962 to −3.3964, but that is a change in count and sign, not an increase in directional information (Section 3).
Scope of this paper: no new mathematical theorem and no new law is claimed — that applying conditions cuts the count is self-evident. No real course, author, or vendor is the subject here, and none is named. No trading is discussed — neither performance nor cost is measured, and no exit is considered (Section 7). The Ichimoku periods are fixed at the conventional 9 / 26 / 52 / 26 (Section 7). Only the long side is looked at — the three-way signal is a long declaration (Section 7). The scope is intraday and few instruments — four instruments over six years. Results documented at longer holding periods, such as monthly time-series momentum, are not contradicted. No prediction is claimed.
1. Notation and the question
The three-way Ichimoku signal is the state in which three conditions hold at once.
| Condition | What it says |
|---|---|
| (1) | The conversion line is above the base line |
| (2) | The price is above the cloud |
| (3) | The lagging span is above the price twenty-six bars back |
Observation 1.1: ★ Applying conditions cuts the count. That follows from the definition. The question is what happens besides the cut.
Observation 1.2: ★ The cloud is read from the leading span twenty-six bars back. That it is a past drawn ahead was measured in [F002], and this paper builds it the same way.
Observation 1.3: The separator here is how many conditions were applied. The instruments, the period, the grid and the forward horizon are all held fixed, and only the number of conditions is changed.
Question: can applying conditions be told apart from thinning the sample at random by the same fraction?
2. State the quantities and the design first
Declared before the run and unchanged during it.
| Grid | 1-hour bars (mid price, completed bars only) / forward horizon 24 bars |
| Ichimoku | Conversion 9 / base 26 / leading span B 52 / shift 26 / lagging 26 |
| Condition (1) | Conversion > base |
| Condition (2) | Close > the top of the cloud (the larger of leading spans A and B from twenty-six bars back) |
| Condition (3) | Close > the close twenty-six bars back |
| Direction | Long only (+1). The three-way signal is a long declaration |
| D | Mean (direction × the move ahead), in pips |
| t | Daily-cluster |
| Control | ★ Random conditions at the same pass rate (20 redraws, averaged) |
| Baseline | Synthetic random walk down to within the bar (3 draws) |
| Separator | How many conditions were applied (the content, or the count) |
| Instruments and period | USDJPY, EURUSD, GBPUSD, XAUUSD / 2019–2024 |
Observation 2.1: ★ The control is the point. Cut the count by the same fraction but choose at random. Failing to beat that means the conditions are not selecting, only thinning.
Observation 2.2: Usable bars number 36,459 for USDJPY, 36,479 for EURUSD, 36,460 for GBPUSD and 34,817 for XAUUSD. ★ All three conditions are determined by information up to that bar's close.
Observation 2.3: All eight combinations are measured, including none at all. ★ One at a time, two at a time and all three are put side by side.
Predictions (written before measuring)
① Each added condition cuts the count roughly multiplicatively.
② ★★ D does not move.
③ ★★ It cannot be told apart from random conditions at the same pass rate.
④ The daily t falls by as much as the count falls.
⑤ A synthetic random walk gives the same shape.
⑥ ★ The three conditions are strongly correlated, so the pass rate exceeds the product of the three.
3. What falls and what does not
Calculation 3.1 All eight combinations (median of the four instruments)
| Conditions | Pass rate | Count | D (pips) | Daily t |
|---|---|---|---|---|
| (none) | 1.0000 | 36,459 | +1.5497 | +0.9962 |
| (1) | 0.4875 | 17,359 | +2.2067 | −2.4906 |
| (2) | 0.4499 | 16,018 | +1.8605 | −4.1092 |
| (3) | 0.5202 | 18,526 | +2.2766 | −3.8491 |
| (1)+(2) | 0.3493 | 12,436 | +1.9381 | −3.3247 |
| (1)+(3) | 0.4197 | 14,946 | +1.9462 | −2.8816 |
| (2)+(3) | 0.3956 | 14,085 | +1.7807 | −4.4914 |
| (1)+(2)+(3) | 0.3336 | 11,876 | +1.7419 | −3.3964 |
Observation 3.2: Prediction ① held. The count falls from 36,459 to 11,876, a factor of 3.0700. ★ That aligning conditions only reduces the count by as much as you aligned was measured in [F010]; this paper sees it inside a single indicator.
Observation 3.3: ★★ Prediction ② held too. D goes from +1.5497 to +1.7419 pips, a change of 0.1922.
Observation 3.4: ★ Even one at a time the movement is small (+1.8605 to +2.2766). And all three together comes out below any single one.
Observation 3.5: The daily t goes from +0.9962 to −3.3964. ★ But that is a change in count and sign, not an increase in directional information. The next section compares against the control.
4. Can it be told apart from random conditions at the same pass rate?
Cut the count by the same fraction, but choose at random, and compare.
Calculation 4.1 The signal against random (median of the four instruments)
| Conditions | D (signal) | D (random) | Gap | Standard error of the mean | Spread across draws | Gap ÷ spread |
|---|---|---|---|---|---|---|
| (1) | +2.2067 | +1.5718 | +0.6350 | 0.5377 | 0.5220 | 1.2165 |
| (2) | +1.8605 | +1.6521 | +0.2084 | 0.5458 | 0.4150 | 0.5022 |
| (3) | +2.2766 | +1.5147 | +0.7619 | 0.5236 | 0.3765 | 2.0235 |
| (1)+(2) | +1.9381 | +1.5077 | +0.4303 | 0.6169 | 0.4076 | 1.0557 |
| (1)+(3) | +1.9462 | +1.5192 | +0.4270 | 0.5789 | 0.4802 | 0.8892 |
| (2)+(3) | +1.7807 | +1.5064 | +0.2743 | 0.5847 | 0.4629 | 0.5926 |
| (1)+(2)+(3) | +1.7419 | +1.5435 | +0.1984 | 0.6338 | 0.4925 | 0.4029 |
Observation 4.2: ★★ This is the core of the paper. With all three, the gap is +0.1984 pips against a standard error of the mean of 0.6338.
Observation 4.3: ★ Gap ÷ spread has a median of 0.8892 and a maximum of 2.0235. Only (3) exceeds 2, one of seven.
Observation 4.4: ★★ And the more conditions are applied, the smaller the gap gets. With (3) alone it is +0.7619; with all three, +0.1984. Stacking conditions moves it toward random thinning.
Observation 4.5: ★ So the three-way signal does nothing beyond cutting the count. It is not selecting; it is thinning.
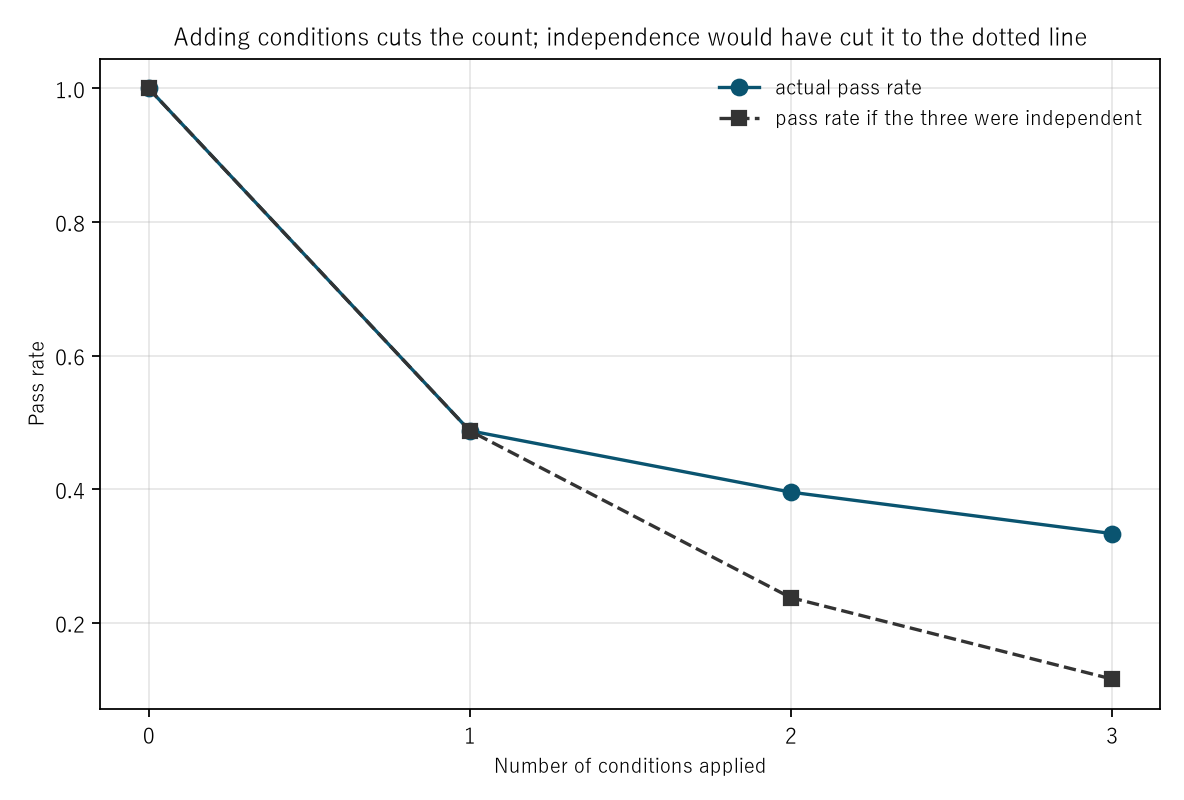
Figure 1: number of conditions applied on the horizontal axis and the pass rate on the vertical. Circles are the actual pass rate and squares the pass rate the three would give if independent.
5. The three conditions do not apply independently
Calculation 5.1 Pass rates against the product of the three
| Instrument | (1) | (2) | (3) | Product | Actual | Actual ÷ product |
|---|---|---|---|---|---|---|
| USDJPY | 0.5276 | 0.5048 | 0.5449 | 0.1451 | 0.3772 | 2.5993 |
| EURUSD | 0.4576 | 0.4157 | 0.4948 | 0.0941 | 0.3054 | 3.2454 |
| GBPUSD | 0.4705 | 0.4318 | 0.5043 | 0.1024 | 0.3181 | 3.1048 |
| XAUUSD | 0.5045 | 0.4680 | 0.5361 | 0.1266 | 0.3491 | 2.7579 |
Observation 5.2: Prediction ⑥ held. ★ The actual pass rate is 2.9314 times the product of the three.
Observation 5.3: ★★ So the three are not saying three separate things. They restate one rise three times.
Observation 5.4: ★ Had they been independent, the pass rate would have fallen to between 0.1451 and 0.0941. In fact it only falls to between 0.3772 and 0.3054.
Observation 5.5: ★ This says the same thing as Section 4 from another angle. All three are built from the same price, so they point the same way.
6. The same procedure on a synthetic random walk
Calculation 6.1 Measurement against random walk (median of the four instruments)
| Conditions | Measured pass rate | Random walk's pass rate | Measured D | Random walk's D |
|---|---|---|---|---|
| (none) | 1.0000 | 1.0000 | +1.5497 | +2.1154 |
| (1) | 0.4875 | 0.4917 | +2.2067 | +2.3377 |
| (2) | 0.4499 | 0.4497 | +1.8605 | +1.7527 |
| (3) | 0.5202 | 0.5100 | +2.2766 | +2.2634 |
| (1)+(2) | 0.3493 | 0.3608 | +1.9381 | +1.4874 |
| (1)+(3) | 0.4197 | 0.4246 | +1.9462 | +2.1049 |
| (2)+(3) | 0.3956 | 0.3945 | +1.7807 | +1.8762 |
| (1)+(2)+(3) | 0.3336 | 0.3435 | +1.7419 | +1.1826 |
Observation 6.2: Prediction ⑤ held. ★ On the random walk all three together pass at 0.3435, close to the measured 0.3336.
Observation 6.3: ★★ And there too the actual pass rate is 3.0702 times the product (the measurement gives 2.9314). The conditions overlap not because of the market but because all three are built from the same price.
Observation 6.4: ★ The random walk's D is +1.1826 pips, close to the measured +1.7419. ★ What this baseline is zero about was measured in [F033].
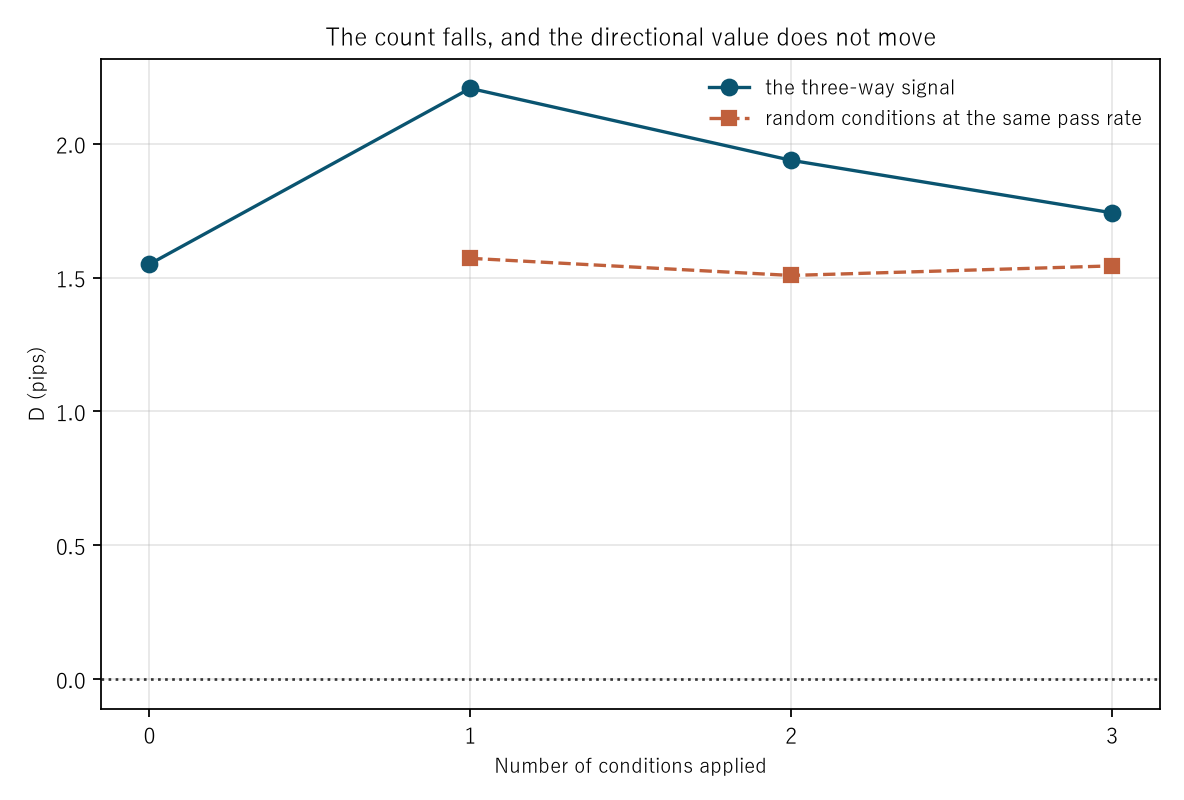
Figure 2: number of conditions applied on the horizontal axis and D (pips) on the vertical. Circles are the three-way signal and squares the random conditions at the same pass rate.
7. Limitations
- No exit is considered. Everything is measured over a fixed forward horizon, with no take-profit and no stop.
- The Ichimoku periods are fixed at the conventional 9 / 26 / 52 / 26. Other periods give other pass rates.
- The forward horizon is fixed at 24 bars.
- Only the long side is looked at, since the three-way signal is a long declaration. Its short counterpart is not measured.
- Neither trading performance nor cost is measured.
- The random control is drawn only 20 times. The spread is estimated coarsely to that extent.
- Four instruments, six years. Nothing is claimed about other markets or other periods.
Conclusion
The three-way Ichimoku signal is the state in which three conditions hold at once. Applying conditions cuts the count. That follows from the definition. The question is what happens besides the cut.
★ The count falls from 36,459 bars to 11,876, a factor of 3.0700.
★★ And the directional value does not move. D goes from +1.5497 to +1.7419 pips, a change of 0.1922.
★★ Nor can it be told apart from random conditions at the same pass rate. With all three the gap is +0.1984 pips, below the standard error of the mean of 0.6338. Gap ÷ spread has a median of 0.8892, and only one of seven exceeds 2.
★★ And the more conditions are applied, the smaller the gap gets. With (3) alone it is +0.7619; with all three, +0.1984. Stacking conditions moves it toward random thinning.
★ Part of the reason is that the three are not independent. The actual pass rate is 2.9314 times the product, so they are not saying three separate things but restating one rise three times.
★ That is not a property of the market either. On a synthetic random walk the ratio is 3.0702 and the pass rate 0.3435, close to the measured 0.3336. All three are built from the same price.
So what to check when someone says "all three conditions lined up" is not whether they lined up. ★ It is whether they beat random conditions that cut the count by the same amount. In this measurement, they do not.
Data and reproduction
| Data | Foreign exchange from Dukascopy-derived ticks (from 2019 onward, matching to the millisecond, bid and ask, has been verified). Gold from Dukascopy |
| Period | 2019–2024 (six years) |
| Instruments | USDJPY, EURUSD, GBPUSD, XAUUSD |
| Bars | 1-hour, mid price, completed bars only |
| Ichimoku | Conversion 9 / base 26 / leading span B 52 / shift 26 / lagging 26 |
| Conditions | (1) conversion > base / (2) close > the top of the cloud (the larger of leading spans A and B from 26 bars back) / (3) close > the close 26 bars back |
| Direction | Long only (+1) |
| D | Mean (direction × the move 24 bars ahead), in pips |
| t | Daily-cluster |
| Control | Random conditions at the same pass rate, drawn 20 times and averaged |
| Baseline | Synthetic random walk down to within the bar (3 draws) |
| Verification | 検算/F052.py (--zu also writes the figures). Every number in the text comes from 検算/F052_output.txt |
| Figures | 図/F052_zu1, 図/F052_zu2 (png, svg, English versions) |
| Random seeds | Fixed. Re-running gives the same values |
| Substrate check | _ツール/audit_bars.py (bar look-ahead, daylight saving, day boundary). The record is _土台の検査.txt |
References
- Yamagishi, Y. (2026). The Ichimoku Cloud Is a Past Drawn Twenty-Six Bars Ahead [F002]. Zenodo. 10.5281/zenodo.22880552
- Yamagishi, Y. (2026). Aligning Timeframes Only Reduces the Count by as Much as You Aligned [F010]. Zenodo. 10.5281/zenodo.22891380
- Yamagishi, Y. (2026). A Synthetic Random Walk Has No Volatility Clustering [F033]. Zenodo. 10.5281/zenodo.22893674
Reference
Yamagishi, Y. (2026). The Three-Way Ichimoku Signal Does Nothing Beyond Cutting the Count [F052]. Zenodo.
DOI: 10.5281/zenodo.22898121
YOI: https://www.yamagishiyuuki.com/yoi/F052
ORCID: 0009-0006-8587-3450
PDF (English) · PDF (Japanese) · Date proof of the English PDF (OpenTimestamps .ots) · SHA256SUMS
The record page for this paper (in Japanese, with the PDFs in each language and the date proof): YOI F052. This paper is a preprint and has not been peer reviewed.