Abstract
What this paper asks is how much the overlap between a sweep's cells lowers the chance that at least one comes out significant. No new mathematical theorem and no new law is claimed.
First, ★ the share of cells that come out significant is 0.0214 under a daily-cluster t and 0.3690 under a naive t. Against a nominal 0.05, that is 0.4286 times and 7.3810 times (Section 3).
Second, ★★ the chance of at least one, over K cells, is indeed below the nominal formula. At K = 20 the formula gives 0.6415 against a measured 0.3630; at K = 100, 0.9941 against 0.9100 (Section 4).
Third, and this is the core of the paper: ★★ the reason was not the overlap. Put the per-cell rate of 0.0214 back into the formula and it matches the measurement almost exactly (measured ÷ formula runs 1.0000 to 1.0733). The cells overlap, and significance piles up as if they were independent (Section 4).
Fourth, ★★ on a synthetic random walk the per-cell rate returns to 0.0488, essentially the nominal 0.05. At K = 20 it gives 0.6465 and at K = 100, 0.9940 — sitting directly on the independent-trials formula (Section 5).
Fifth, ★ so what made the measurement low is that the daily-cluster t is conservative on real data (0.0214 against 0.0488) (Section 5).
Sixth, ★★ under a naive t, K = 10 gives 0.9960. Even a single cell gives 0.3570 (Section 6).
Scope of this paper: no new mathematical theorem and no new law is claimed — the multiple-testing formula is elementary. No real course, author, or vendor is the subject here, and none is named. No trading is discussed — neither performance nor profit and loss is measured. Prediction ②'s reasoning was wrong — the shortfall came from the size of the test, not the overlap (Sections 4 and 5). Prediction ⑥ failed too (Section 7). One family is fixed — moving-average crosses (Section 7). The scope is intraday and few instruments — four instruments over six years. Results documented at longer holding periods, such as monthly time-series momentum, are not contradicted. No prediction is claimed.
1. Notation and the question
"Try twenty times and one of them comes out significant," people say. For independent trials that is right. If each fails at 0.05, then
P(at least one significant) = 1 − (1 − 0.05)^K
which gives 0.6415 at K = 20 and 0.9941 at K = 100.
| What gets said | What does not get said |
|---|---|
| Twenty tries and one comes out significant | Whether those twenty were independent |
| I swept and found the best cell | How much it overlapped the cell next to it |
| The significance level is 5 per cent | Whether that test actually fails 5 per cent of the time |
Observation 1.1: ★ A sweep's cells are not independent. The 5- and 10-period moving averages point the same way on almost the same bars.
Observation 1.2: ★ If so, twenty tries should not be worth twenty. This paper measures that.
Observation 1.3: The separator here is whether the cells looked at overlap. The instruments, the period, the grid and the family are all held fixed, and only how many cells were looked at is changed.
Question: how much does the overlap lower the chance?
2. State the quantities and the design first
Declared before the run and unchanged during it.
| Grid | 1-hour bars (mid price, completed bars only) |
| Family | Fast period 5–60 (12 values) × slow period 20–200 (10 values, fast < slow) × 4 instruments × forward horizons of 6 and 24 bars |
| Direction | The sign of fast minus slow moving average, taken at the completed bar's close |
| D | Mean (direction × the move ahead), in pips |
| t | Daily-cluster and naive, both |
| Threshold | |t| ≥ 2 |
| Per-trial rate | 0.05 (two-sided 5 per cent) |
| Sampling | K cells drawn without replacement, repeated 2,000 times |
| Baseline | Synthetic random walk down to within the bar (3 draws). ★ The true value is zero |
| Separator | Whether the cells looked at overlap |
| Instruments and period | USDJPY, EURUSD, GBPUSD, XAUUSD / 2019–2024 |
Observation 2.1: ★ The random walk's true value is zero. Anything "significant" there is entirely false.
Observation 2.2: There are 840 cells in total. ★ The daily t is always formed by averaging within days first. That a naive t inflates with the count per day was measured in [F014].
Observation 2.3: That a sweep's best value is a function of the number of cells looked at was measured in [F022]. ★ What this paper measures is not the best value but the chance that at least one crosses the threshold.
Predictions (written before measuring)
① More cells raises the chance that at least one is significant.
② ★★ It lands below the independent-trials formula, because the cells overlap.
③ ★ The effective number of trials is far below the number of cells.
④ ★★ The same curve appears on a synthetic random walk.
⑤ ★ A daily-cluster t lowers the curve relative to a naive t.
⑥ Effective trials ÷ cells falls as the number of cells grows.
3. How often a single cell comes out significant
Calculation 3.1 Inside the 840 cells
| Quantity | Value |
|---|---|
| Number of cells | 840 |
| Share with |daily t| ≥ 2 | 0.0214 |
| Share with |naive t| ≥ 2 | 0.3690 |
| Median |daily t| | 0.4392 |
| Median |naive t| | 1.5770 |
| Naive ÷ daily (median against median) | 3.5908 |
Observation 3.2: ★ Under the daily t it is 0.0214, only 0.4286 of the nominal 0.05. In this setting the test is conservative.
Observation 3.3: ★★ Under the naive t it is 0.3690, or 7.3810 times nominal. More than a third of the cells come out "significant".
Observation 3.4: The medians differ by 3.5908 as well. ★ A naive t inflates to more than three times the daily t.
4. Raise K and it piles up as if independent
Calculation 4.1 The chance that at least one is significant
| K | Formula (p=0.05) | Daily t (measured) | Naive t (measured) | ★ Formula (p=0.0214) | Measured ÷ ★ |
|---|---|---|---|---|---|
| 1 | 0.0500 | 0.0230 | 0.3570 | 0.0214 | 1.0733 |
| 2 | 0.0975 | 0.0455 | 0.6045 | 0.0424 | 1.0732 |
| 5 | 0.2262 | 0.1055 | 0.9000 | 0.1026 | 1.0278 |
| 10 | 0.4013 | 0.2070 | 0.9960 | 0.1948 | 1.0628 |
| 20 | 0.6415 | 0.3630 | 1.0000 | 0.3516 | 1.0325 |
| 50 | 0.9231 | 0.6620 | 1.0000 | 0.6614 | 1.0008 |
| 100 | 0.9941 | 0.9100 | 1.0000 | 0.8854 | 1.0278 |
| 200 | 1.0000 | 0.9965 | 1.0000 | 0.9869 | 1.0098 |
| 400 | 1.0000 | 1.0000 | 1.0000 | 0.9998 | 1.0002 |
| 800 | 1.0000 | 1.0000 | 1.0000 | 1.0000 | 1.0000 |
Observation 4.2: Prediction ② held. At K = 20 the formula gives 0.6415 against a measured 0.3630; at K = 100, 0.9941 against 0.9100.
Observation 4.3: ★★ But the reason was not the overlap. Put the per-cell rate of 0.0214 back into the formula and it matches almost exactly (measured ÷ formula runs 1.0000 to 1.0733).
Observation 4.4: ★★ So the cells overlap, and significance still piles up as if they were independent. The overlap does almost nothing here.
Observation 4.5: ★ If the overlap were doing the work, the same thing would happen on a synthetic random walk. The next section checks that.
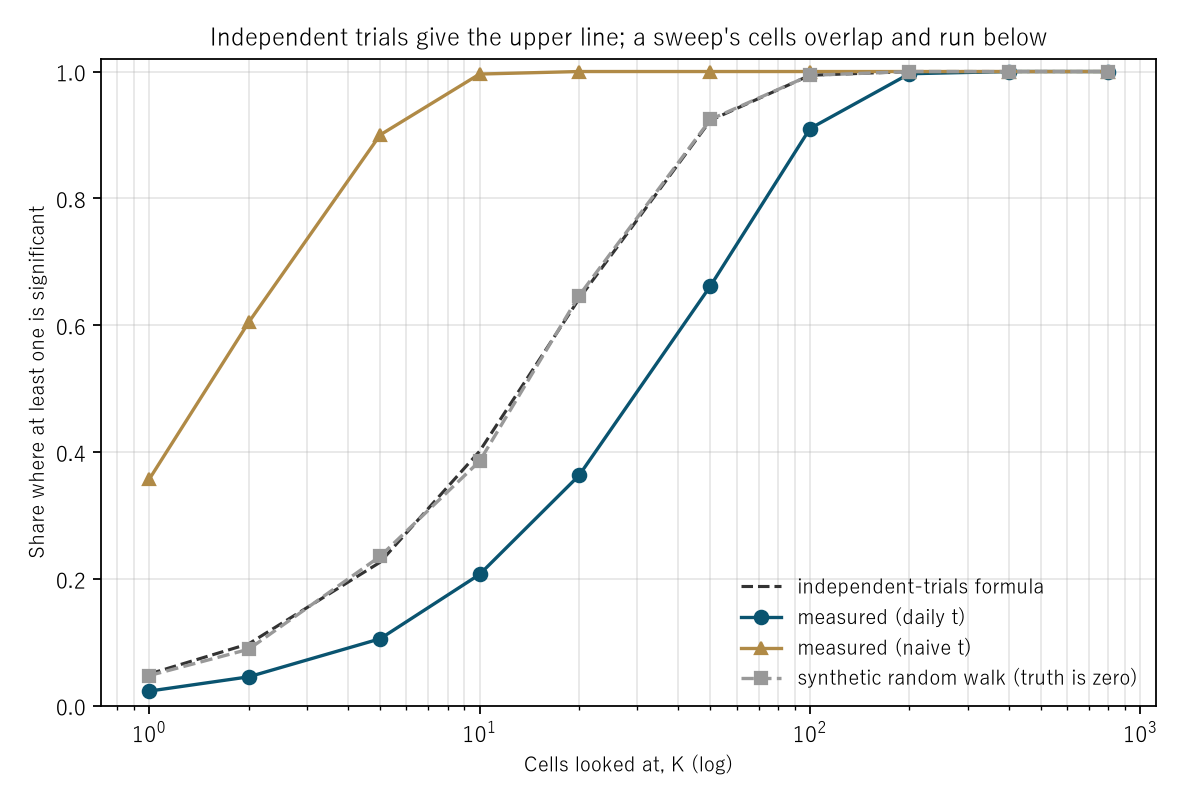
Figure 1: cells looked at, K (log), on the horizontal axis and the chance that at least one is significant on the vertical. The dashed line is the independent-trials formula, circles are the measured daily t, triangles the naive t and squares the random walk.
5. On a synthetic random walk the rate returns to the nominal 0.05
Calculation 5.1 The same procedure where the true value is zero
| K | Measured (daily t) | Random walk | Formula (p = the random walk's 0.0488) | Formula (p=0.05) |
|---|---|---|---|---|
| 1 | 0.0230 | 0.0475 | 0.0488 | 0.0500 |
| 2 | 0.0455 | 0.0890 | 0.0952 | 0.0975 |
| 5 | 0.1055 | 0.2355 | 0.2214 | 0.2262 |
| 10 | 0.2070 | 0.3855 | 0.3937 | 0.4013 |
| 20 | 0.3630 | 0.6465 | 0.6324 | 0.6415 |
| 50 | 0.6620 | 0.9245 | 0.9181 | 0.9231 |
| 100 | 0.9100 | 0.9940 | 0.9933 | 0.9941 |
| 200 | 0.9965 | 1.0000 | 1.0000 | 1.0000 |
Observation 5.2: ★★ On the random walk a single cell comes out significant 0.0488 of the time, essentially the nominal 0.05. The size of the test is right.
Observation 5.3: ★★ And the curve sits directly on the independent-trials formula (0.6465 against 0.6415 at K = 20, 0.9940 against 0.9941 at K = 100).
Observation 5.4: ★★ The random walk's cells overlap exactly as much as the measurement's. They still pile up by the formula. That settles it: the overlap is not doing the work.
Observation 5.5: ★ So what made the measurement low is that the daily-cluster t is conservative on real data (0.0214 against 0.0488). The reason for that is not measured; a plausible reading is that the daily values are far from normal.
Observation 5.6: ★ What this baseline is zero about was measured in [F033].
6. Under a naive t, ten cells are enough
Calculation 6.1 Naive t against daily t
| K | Daily t | Naive t |
|---|---|---|
| 1 | 0.0230 | 0.3570 |
| 5 | 0.1055 | 0.9000 |
| 10 | 0.2070 | 0.9960 |
| 20 | 0.3630 | 1.0000 |
Observation 6.2: Prediction ⑤ held. ★ Under a naive t a single cell gives 0.3570, five give 0.9000 and ten give 0.9960.
Observation 6.3: ★★ So as long as a naive t is used, looking at ten cells is almost certain to turn up "something significant". That is known before looking.
Observation 6.4: ★ This is the sweep's version of "a naive t inflates with the count per day", measured in [F014].
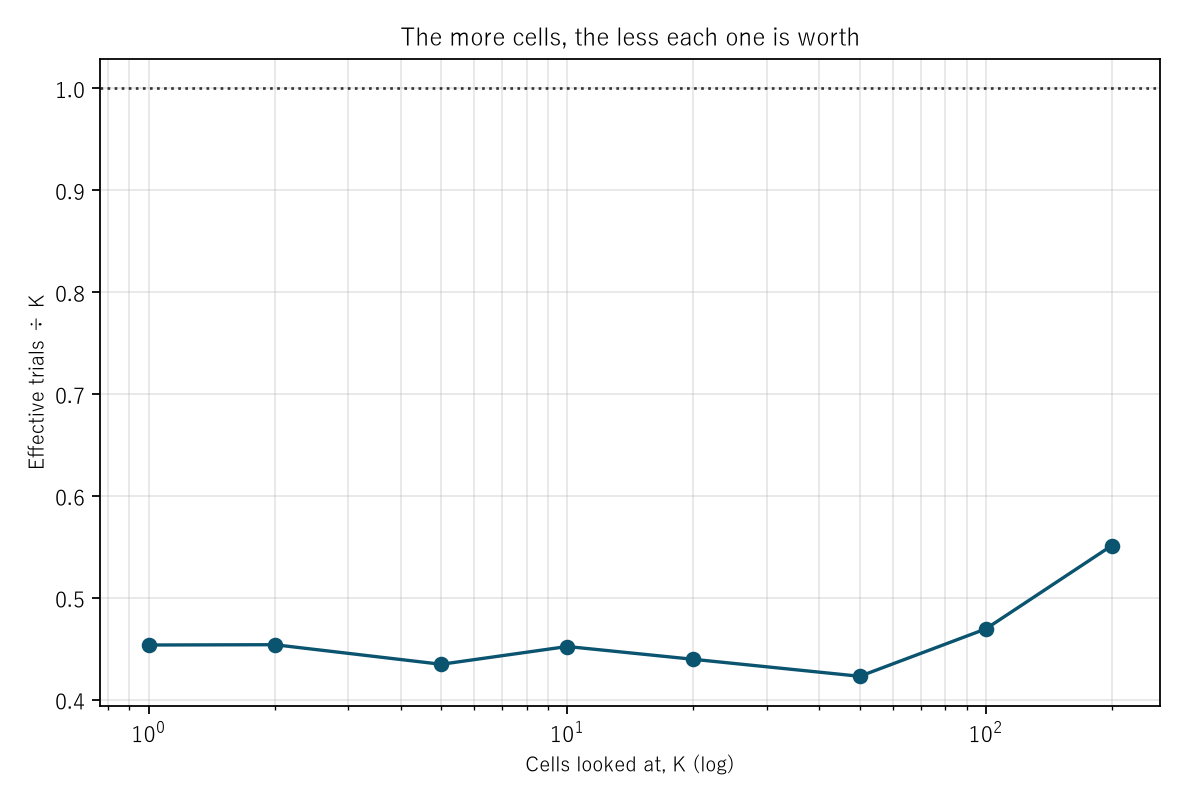
Figure 2: cells looked at, K (log), on the horizontal axis and effective trials ÷ K on the vertical. The dotted line is 1.
7. Effective trials and limitations
Calculation 7.1 Effective trials (solved back at the nominal 0.05)
| K | Daily t's share | Effective trials | Effective ÷ K |
|---|---|---|---|
| 1 | 0.0230 | 0.4536 | 0.4536 |
| 5 | 0.1055 | 2.1736 | 0.4347 |
| 20 | 0.3630 | 8.7923 | 0.4396 |
| 50 | 0.6620 | 21.1472 | 0.4229 |
| 100 | 0.9100 | 46.9446 | 0.4694 |
| 200 | 0.9965 | 110.2482 | 0.5512 |
Observation 7.2: ★ Prediction ⑥ failed. Effective trials ÷ K runs from 0.4536 to 0.5512 — it rises rather than falls.
Observation 7.3: ★★ That the ratio is roughly constant is itself the evidence that the cells behave as if independent. Were they overlapping, the ratio would fall as K grew.
Observation 7.4: ★ And that ratio matches the measured share's ratio to nominal, 0.0214 against 0.05, which is 0.4286. The effective count is small because the per-cell test is conservative, not because the cells overlap.
Limitations
- Prediction ②'s reasoning was wrong. The shortfall was real, but it came from the size of the test, not the overlap.
- Prediction ⑥ failed too. Effective trials ÷ K did not fall.
- One family is fixed: moving-average crosses. Another family overlaps differently.
- Why the daily t is conservative on real data is not measured. Daily values being far from normal is only a reading.
- The per-trial rate is fixed at 0.05 and the threshold at \|t\| ≥ 2.
- Effective trials is only the independent-trials formula solved backwards.
- Four instruments, six years. Nothing is claimed about other markets or other periods.
Conclusion
"Twenty tries and one comes out significant" is a statement about independent trials. A sweep's cells overlap, so twenty should not have been worth twenty.
★ And indeed the measurement came in below the nominal formula. At K = 20 the formula gives 0.6415 against 0.3630.
★★ But the reason was not the overlap. Put the per-cell rate of 0.0214 back into the formula and it matches to within 1.0000 to 1.0733. The cells overlap, and significance piles up as if they were independent.
★★ The synthetic random walk settles it. There the per-cell rate returns to 0.0488 against a nominal 0.05, and the curve sits on the formula (0.6465 against 0.6415 at K = 20). And its cells overlap exactly as much.
★ So what made the measurement low is that the daily-cluster t is conservative on real data (0.0214 against 0.0488). Not the overlap.
★ Effective trials ÷ K running 0.4536 to 0.5512, roughly flat, says the same thing from another angle. Were the cells overlapping, that ratio would fall as K grew.
★★ And under a naive t, a single cell gives 0.3570 and ten give 0.9960. That something significant will turn up is known before looking.
So what should be discounted when reading a sweep is not "because they overlap". ★ It is to measure what fraction of the time a single cell actually fails. Whether that is 0.0214 or 0.3690 changes the answer entirely.
Data and reproduction
| Data | Foreign exchange from Dukascopy-derived ticks (from 2019 onward, matching to the millisecond, bid and ask, has been verified). Gold from Dukascopy |
| Period | 2019–2024 (six years) |
| Instruments | USDJPY, EURUSD, GBPUSD, XAUUSD |
| Bars | 1-hour, mid price, completed bars only |
| Family | Fast period 5–60 (12 values) × slow period 20–200 (10 values, fast < slow) × 4 instruments × forward horizons of 6 and 24 bars |
| Direction | The sign of fast minus slow moving average, taken at the completed bar's close |
| D | Mean (direction × the move ahead), in pips |
| t | Daily-cluster (averaged within days first) and naive, both |
| Threshold | |t| ≥ 2. The per-trial rate is 0.05 (two-sided 5 per cent) |
| Sampling | K cells drawn without replacement, repeated 2,000 times |
| Baseline | Synthetic random walk down to within the bar (3 draws). The true value is zero |
| Verification | 検算/F051.py (--zu also writes the figures). Every number in the text comes from 検算/F051_output.txt |
| Figures | 図/F051_zu1, 図/F051_zu2 (png, svg, English versions) |
| Random seeds | Fixed. Re-running gives the same values |
| Substrate check | _ツール/audit_bars.py (bar look-ahead, daylight saving, day boundary). The record is _土台の検査.txt |
References
- Yamagishi, Y. (2026). A Naive t Value Inflates with the Number of Observations per Day [F014]. Zenodo. 10.5281/zenodo.22891694
- Yamagishi, Y. (2026). The Best Value Is a Function of How Many Cells You Looked At [F022]. Zenodo. 10.5281/zenodo.22892093
- Yamagishi, Y. (2026). A Synthetic Random Walk Has No Volatility Clustering [F033]. Zenodo. 10.5281/zenodo.22893674
Reference
Yamagishi, Y. (2026). A Sweep's Cells Overlap, and Significance Still Piles Up as if They Were Independent [F051]. Zenodo.
DOI: 10.5281/zenodo.22898053
YOI: https://www.yamagishiyuuki.com/yoi/F051
ORCID: 0009-0006-8587-3450
PDF (English) · PDF (Japanese) · Date proof of the English PDF (OpenTimestamps .ots) · SHA256SUMS
The record page for this paper (in Japanese, with the PDFs in each language and the date proof): YOI F051. This paper is a preprint and has not been peer reviewed.