Abstract
From Table 10 of the Report on Public Health Administration (FY2024) I counted barbershops and beauty salons — premises, licensed barbers and beauticians, use confirmations and closure orders — and matched them against the barbering and beauty categories of the Economic Census (2021).
There are 107,995 barbershops and 277,752 beauty salons, with 194,531 working barbers and 588,291 working beauticians.
Against the Economic Census, the two trades disagree by different amounts.
| Public Health Administration | Economic Census | Ratio | |
|---|---|---|---|
| Barbering | 107,995 premises | 87,048 establishments | 1.241 |
| Beauty | 277,752 premises | 162,431 establishments | 1.710 |
The beauty discrepancy is 1.38 times the barbering discrepancy.
Per premises there are 1.80 barbers and 2.12 beauticians. That is under a sixth of the all-industry figure of 11.80 (X001), making these among the smallest trades in Japan.
There are 2.57 beauty salons per barbershop, but this too varies sharply: 3.90 in Tokyo against 1.39 in Akita, a spread of 2.80. Not one prefecture has more barbershops than beauty salons.
Barbershops per 100,000 population run from 233.9 in Akita to 48.0 in Kanagawa, a spread of 4.87, correlating with the ageing rate at r = +0.792. For beauty salons the spread is only 2.33 (Yamanashi 332.3 to Kanagawa 142.4).
Against 385,747 premises nationwide, closure orders numbered zero.
1. Introduction
From I006 onward, matching the Report on Public Health Administration against the Economic Census has repeatedly shown that two statistics counting what should be the same thing often do not agree. Simple lodgings were off by 13.75-fold, department stores by 29.6, pharmacies by 1.03.
Barbershops and beauty salons are the most representative form of small business there is. In X001, workers per establishment were 1.94 for barbering and 2.52 for beauty, among the smallest of the 526 subcategories.
How many barbershops and beauty salons does the health register hold, and how far does that differ from the Economic Census?
2. Data
| Premises, barbers, beauticians, use confirmations, closure orders | MHLW, Report on Public Health Administration, FY2024, Table 10 (Environmental Health). As at end of FY2024 (confirmations and orders are during the year) |
| Establishments and workers | MIC and METI, Economic Census 2021, 782 Barbering / 783 Beauty |
| Population and ageing rate | MIC, Basic Resident Register, 1 January 2026 |
All 47 prefectures are present, and the totals reconcile exactly with the national row (107,995 barbershops, 277,752 beauty salons, difference zero).
Under note 1 of Table 10, premises registered as both a barbershop and a beauty salon (381) are not double counted. That is 0.353% of barbershops and 0.137% of beauty salons.
3. Results
3-1 107,995 barbershops, 277,752 beauty salons
| Premises | Licensed workers | Per premises | |
|---|---|---|---|
| Barbershops | 107,995 | 194,531 barbers | 1.80 |
| Beauty salons | 277,752 | 588,291 beauticians | 2.12 |
| Together | 385,747 | 782,822 |
The all-industry figure is 11.80 workers per establishment (X001). Both trades run on under a sixth of that.
The figure varies by region.
| High | Low | Top ÷ bottom | Median | |
|---|---|---|---|---|
| Barbers per premises | Tokyo 2.26 / Kanagawa 2.10 / Saitama 2.10 | Kagoshima 1.37 / Ehime 1.34 / Okinawa 1.21 | 1.87 | 1.72 |
| Beauticians per premises | Tokyo 3.13 / Kanagawa 3.06 / Osaka 2.33 | Kagoshima 1.52 / Tokushima 1.40 / Ehime 1.37 | 2.28 | 1.79 |
The more urban the prefecture, the larger the premises. Even in Tokyo, though, a beauty salon averages 3.13 people.
3-2 Only beauty is off by 1.7-fold
| Public Health Administration (end FY2024) | Economic Census (1 June 2021) | Ratio | |
|---|---|---|---|
| Barbering | 107,995 premises | 87,048 establishments | 1.241 |
| Beauty | 277,752 premises | 162,431 establishments | 1.710 |
| Difference | barbering +20,947 / beauty +115,321 |
The beauty discrepancy of 1.710 is 1.38 times the barbering discrepancy of 1.241.
The headcounts open the same way.
| Licensed | Economic Census workers | Ratio | |
|---|---|---|---|
| Barbering | 194,531 | 168,442 | 1.155 |
| Beauty | 588,291 | 408,707 | 1.439 |
The premises discrepancy (1.241 / 1.710) is larger than the headcount discrepancy (1.155 / 1.439).
3-3 Per 100,000 population
| National | High | Low | Top ÷ bottom | Median | |
|---|---|---|---|---|---|
| Barbershops | 87.3 | Akita 233.9 / Yamagata 210.8 / Iwate 190.6 | Saitama 64.0 / Tokyo 52.1 / Kanagawa 48.0 | 4.87 | 108.0 |
| Beauty salons | 224.4 | Yamanashi 332.3 / Akita 326.0 / Tokushima 316.2 | Chiba 166.1 / Saitama 161.4 / Kanagawa 142.4 | 2.33 | 260.9 |
The regional gap is far wider for barbershops (4.87 against 2.33).
| Correlation (47 prefectures) | r |
|---|---|
| Barbershops per 100,000 × ageing rate | +0.792 |
| Beauty salons per 100,000 × ageing rate | +0.723 |
| Barbershops per 100,000 × population (log) | −0.627 |
| Beauty salons per 100,000 × population (log) | −0.814 |
| Barbershops per 100,000 × beauty salons per 100,000 | +0.716 |
For both, the older the prefecture, the more shops per head.
3-4 2.57 beauty salons per barbershop — but it depends on the prefecture
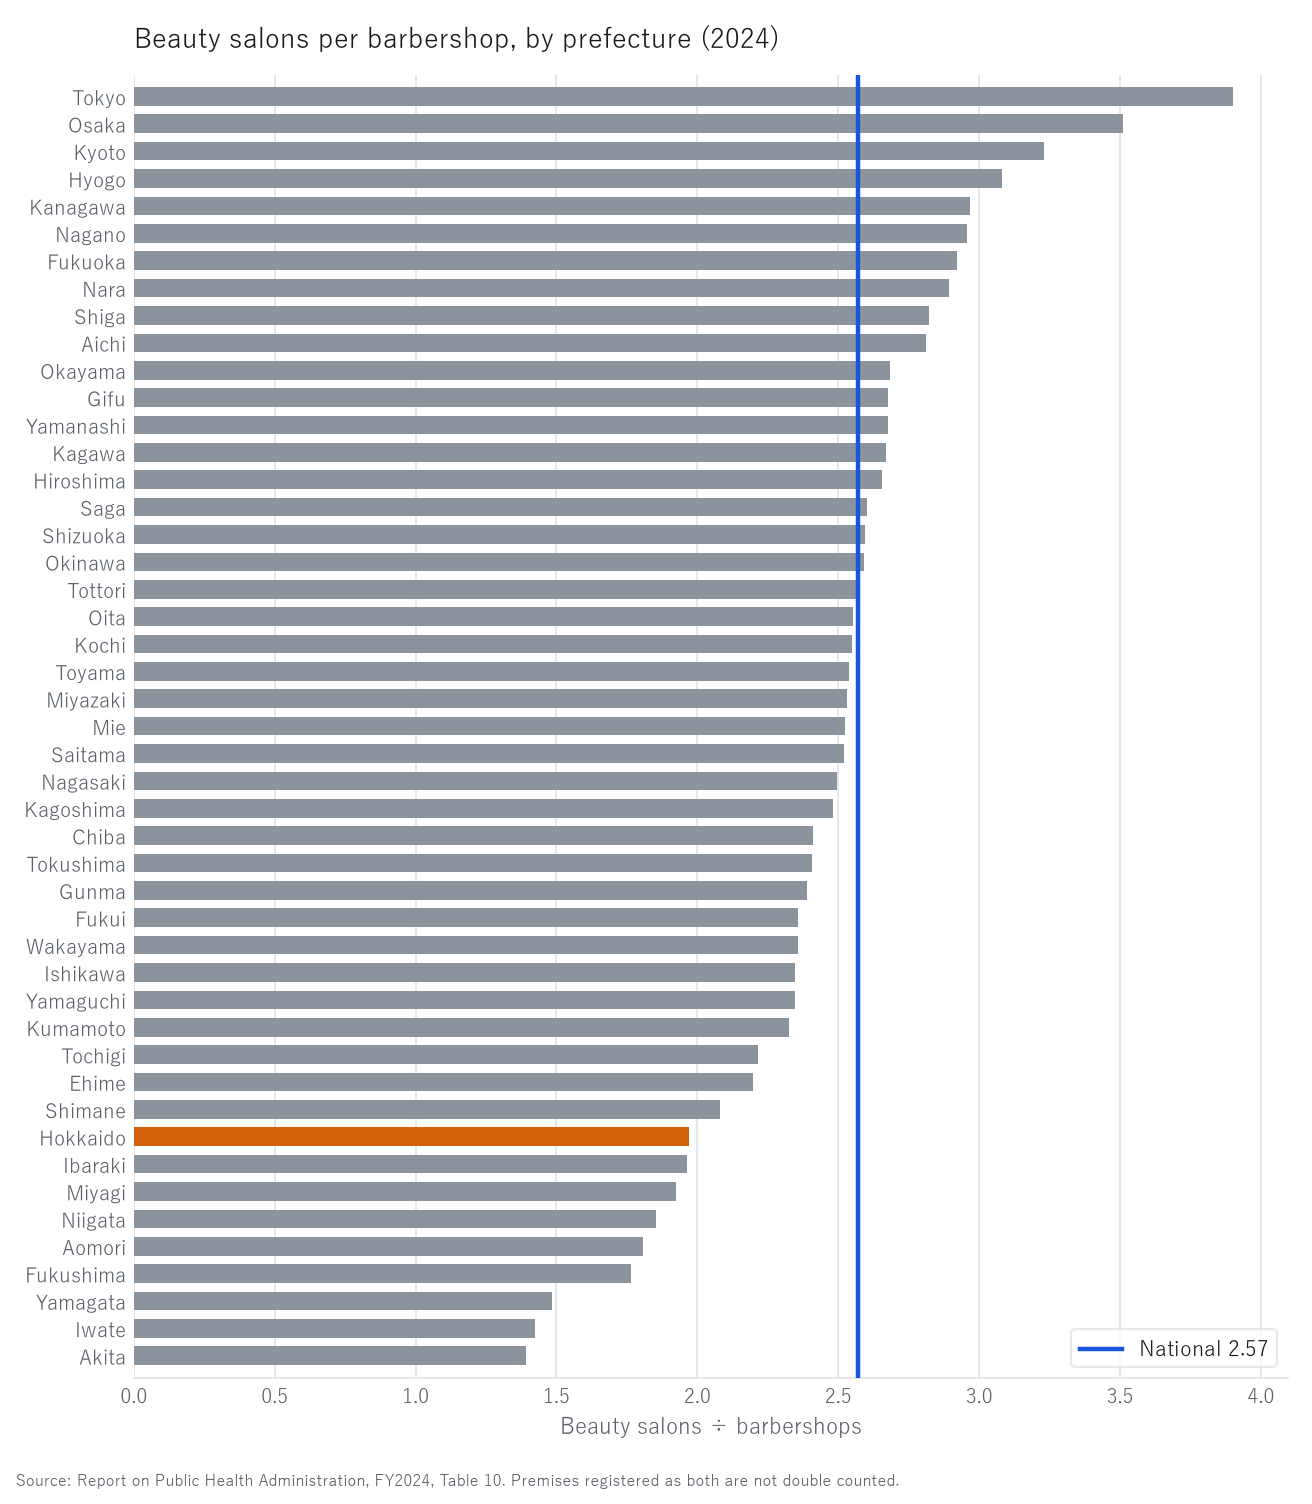
Figure 1. Beauty salons divided by barbershops, 47 prefectures (Report on Public Health Administration, FY2024).
Grey is prefectures, orange is Hokkaido, the blue vertical line is the national 2.57.
| National | 277,752 ÷ 107,995 = 2.57 |
| (In the Economic Census) | 162,431 ÷ 87,048 = 1.87 |
| High | Tokyo 3.90 / Osaka 3.51 / Kyoto 3.23 |
| Low | Yamagata 1.49 / Iwate 1.42 / Akita 1.39 |
| Top ÷ bottom | 2.80, median 2.53 |
Not one prefecture has more barbershops than beauty salons.
| Correlation | r |
|---|---|
| Beauty ÷ barbering × ageing rate | −0.668 |
| Beauty ÷ barbering × population (log) | +0.465 |
The older the prefecture, the larger the barbering share.
3-5 Zero closure orders
| Barbershops | Beauty salons | Ratio | |
|---|---|---|---|
| Use confirmations (during the year) | 1,305 | 12,433 | 9.5 |
| Confirmation rate per premises | 1.208% | 4.476% | 3.7 |
| Closure orders (during the year) | 0 | 0 |
Against 385,747 premises nationwide, closure orders numbered zero.
The confirmation rate also varies (beauty salons).
| High | Low | Top ÷ bottom |
|---|---|---|
| Tokyo 6.38% / Osaka 5.83% / Kanagawa 5.46% | Iwate 2.59% / Yamanashi 2.42% / Yamagata 2.37% | 2.7 |
A "use confirmation" is a check that new premises may be used. It is neither an inspection nor an enforcement action. More openings and relocations mean more of them.
3-6 Hokkaido and the Kushiro Subprefecture
| Hokkaido | |
|---|---|
| Barbershops | 5,687 (9,404 barbers, 1.65 per premises) |
| Beauty salons | 11,199 (21,066 beauticians, 1.88 per premises) |
| Per 100,000 population | barbering 113.8 (20th of 47) / beauty 224.1 (38th of 47) |
| Beauty ÷ barbering | 1.97 (39th of 47; national 2.57) |
Hokkaido is mid-table for barbershops but tenth from the bottom for beauty salons. Its beauty-to-barbering ratio of 1.97 is therefore well below the national 2.57.
The health register has no municipal table, so the Kushiro Subprefecture is shown from the Economic Census.
| Municipality | Barbering | Workers | Beauty | Workers |
|---|---|---|---|---|
| Kushiro City | 195 | 358 | 288 | 526 |
| Kushiro Town | 20 | 36 | 34 | 72 |
| Akkeshi | 12 | 21 | 14 | 16 |
| Hamanaka | 8 | 11 | 8 | 12 |
| Shibecha | 8 | 13 | 6 | 8 |
| Teshikaga | 10 | 14 | 15 | 18 |
| Tsurui | 1 | 1 | 2 | 2 |
| Shiranuka | 10 | 18 | 18 | 28 |
| Subprefecture total | 264 | 385 |
The subprefecture's beauty-to-barbering ratio is 1.46, below the national 1.87.
Shibecha alone has more barbering (8) than beauty (6). Tsurui has one barbering and two beauty establishments, with one and two workers respectively.
Barbering is present in 1,862 of the 1,889 municipalities and beauty in 1,857 (X001). Both are trades that nearly every municipality has.
4. Discussion
4-1 Why is only beauty off by 1.7-fold?
Set against the taxonomy of discrepancies built up since I006, the beauty figure of 1.710 belongs to the "not captured as establishments" type.
The candidates are practice from a room at home, chair rental in a shared salon, and mobile-only operation. All must be registered with the public health centre as beauty premises, but the Economic Census does not readily pick them up as establishments.
This is a hypothesis, and Table 10 cannot test it. The table has no column distinguishing the form of operation.
That barbering's 1.241 is smaller is consistent in direction with the hypothesis — barbering would be relatively more often a storefront — but that too is untested.
The three-year-ten-month gap between the two dates may also contribute. But the gap applies equally to both, so it cannot explain why the two trades disagree by different amounts.
4-2 Among the smallest trades in Japan
1.80 per premises in barbering and 2.12 in beauty, against 11.80 for all industry — under a sixth.
At that size, many shops never reach the point of employing anyone. X002 showed a regional minimum-wage gap of 1.198-fold, but where no one is employed, the minimum wage does not bite.
Land prices, by contrast, differ 87.4-fold (X002). For a trade that runs on two people, the centre of cost is not labour but the place the shop sits.
And even in Tokyo a beauty salon averages 3.13 people. That this is not a trade one scales up holds consistently across all 47 prefectures.
4-3 The older the prefecture, the more shops per head
Barbershops per 100,000 correlate with the ageing rate at +0.792, a strong relationship; beauty salons at +0.723.
There are at least two readings.
- The customer side: in older areas, how often and how people use these shops differs
- The shop side: in older areas, long-established shops have not closed
These numbers cannot decide between them. That workers per premises are lowest in the older prefectures (Kagoshima 1.37, Ehime 1.34, Okinawa 1.21) is at least consistent with the second.
It runs in the same direction as R001's "the less populous the municipality, the more establishments per head" and X002's "the lower the minimum wage, the more establishments per head" (r = −0.537).
4-4 What the beauty-to-barbering ratio reflects
Against a national 2.57, Tokyo is 3.90 and Akita 1.39 — a spread of 2.80.
The correlation with the ageing rate is −0.668: the older the prefecture, the larger the barbering share.
The point to note is that a low ratio does not mean few beauty salons. Akita has 326.0 beauty salons per 100,000, second in Japan. Its ratio is low because its 233.9 barbershops per 100,000 is first by a wider margin.
Akita is among the highest in Japan for both barbershops and beauty salons.
4-5 What zero closure orders means
Against 385,747 premises, closure orders numbered zero.
This does not show that there were no violations. A closure order is the heaviest administrative sanction available, and matters end in guidance and correction well before that point. I014 showed the same shape in medicines retail: of 2,633 dispositions, six were revocations or suspensions (0.063%), and criminal referrals were zero.
Hygiene regulation of barbering and beauty does not operate through closure orders. Use confirmations — 1,305 in barbering and 12,433 in beauty — are where the administration actually meets the premises.
4-6 What it means to open a shop in Kushiro
The Kushiro Subprefecture has 264 barbering and 385 beauty establishments, a ratio of 1.46 — below the national 1.87 and below Hokkaido's 1.97 in the health register.
Shibecha, with 8 barbering against 6 beauty, is the only municipality in the subprefecture where barbering is larger. Tsurui has three establishments between the two trades, with three workers.
At the same time, barbering is present in 1,862 of 1,889 municipalities and beauty in 1,857. This is the clearest case of X001's finding that the smaller a trade is per establishment, the more municipalities it is present in (r = −0.417).
However far population falls, a place to cut hair is among the last to go. But by R005's calculation, all eight municipalities of the subprefecture lose at least 30% of their population by 2050, and Shiranuka falls to 0.39. Whether a trade remains and how many people it can run on are separate questions.
5. Limitations
- The health register is as at end of FY2024, the Economic Census at 1 June 2021 — three years and ten months apart
- The health register counts premises; the Economic Census counts establishments. The unit differs
- Barber and beautician counts are of the licensed; Economic Census workers include reception and other unlicensed staff
- The health register has no municipal table. The Kushiro Subprefecture is shown from the Economic Census
- Premises registered as both (381) are not double counted (Table 10, note 1)
- A "use confirmation" is a check that new premises may be used; it is neither an inspection nor an enforcement action
- The reasons offered for the larger beauty discrepancy (home practice, chair rental, mobile work) are hypotheses that this table cannot test
- Revenue and profit are not examined. This is a count of premises and people
- A correlation indicates the strength of a relationship, not the direction of causation
6. How to reproduce
- Download Table 10 (Environmental Health, barbershops and beauty salons) of the FY2024 Report on Public Health Administration from e-Stat (CP932)
- Take the national row and the 47 rows from Hokkaido to Okinawa (nothing below "designated cities (regrouped)")
- Take subcategories 782 Barbering and 783 Beauty from Tables 9-1A and 9-1B of the 2021 Economic Census
- Divide premises by establishments, and licensed workers by census workers
- Compute barbershops and beauty salons per 100,000 population, and beauty ÷ barbering, by prefecture
- Compute correlations against the ageing rate and population in logs
Every figure in this paper is output by a single script (kensan_206). No intermediate value was copied by hand.
Scope of this paper
No new theory is claimed. Table 10 of the Report on Public Health Administration is counted and matched against the barbering and beauty categories of the Economic Census. It shows that beauty is off by 1.710 against barbering's 1.241, that premises run on 1.80 and 2.12 people, that the beauty-to-barbering ratio spans 3.90 in Tokyo to 1.39 in Akita, and that closure orders numbered zero. Hypotheses are offered for the larger beauty discrepancy, but this table cannot test them. Correlations are reported; the direction of causation is not.
References and data sources
- Ministry of Health, Labour and Welfare, Report on Public Health Administration, FY2024, Table 10 (Environmental Health)
- Ministry of Internal Affairs and Communications and Ministry of Economy, Trade and Industry, Economic Census 2021, Tables 9-1A and 9-1B
- Ministry of Internal Affairs and Communications, Basic Resident Register population, 1 January 2026
- Yuuki Yamagishi, "Lodging Counts Differ 13.7-fold Between Statistics" (I006)
- Yuuki Yamagishi, "11,910 Shops Sell Medicines Online (12.8%)" (I014)
- Yuuki Yamagishi, "How Many People Does a Trade Run On?" (X001)
- Yuuki Yamagishi, "Wages 1.20-fold, Prices 1.08-fold, Income 1.85-fold, Land 87.4-fold" (X002). Zenodo. https://doi.org/10.5281/zenodo.22877924
- Yuuki Yamagishi, "How Many Trades Will Leave a Town by 2050?" (R005). Zenodo. https://doi.org/10.5281/zenodo.22877595
Version history
| Version | Date | Contents |
|---|---|---|
| 1 | 2026-09-21 | First release |
How to cite
Yamagishi, Y. (2026). 107,995 Barbershops and 277,752 Beauty Salons: Only Beauty Is Off by 1.7-fold Between Statistics [I015]. Zenodo. https://doi.org/10.5281/zenodo.22878037
(This DOI is the concept DOI; it always resolves to the latest version. Cite this one.)
© 2026 Yuuki YAMAGISHI
This work is licensed under a Creative Commons Attribution 4.0 International License (CC BY 4.0).
You may copy, adapt, redistribute and use it commercially, provided you give appropriate credit.
creativecommons.org/licenses/by/4.0
All figures and values in this paper were computed from official statistics. Rights in the underlying data remain with the publishing agencies.
Reference
Yamagishi, Y. (2026). 107,995 Barbershops and 277,752 Beauty Salons: Only Beauty Is Off by 1.7-fold Between Statistics [I015]. Zenodo.
DOI: 10.5281/zenodo.22878037
YOI: https://www.yamagishiyuuki.com/yoi/I015
ORCID: 0009-0006-8587-3450
PDF (English) · PDF (Japanese) · Date proof of the English PDF (OpenTimestamps .ots) · SHA256SUMS
The record page for this paper (in Japanese, with the PDFs in each language and the date proof): YOI I015. This paper is a preprint and has not been peer reviewed.