Abstract
This paper asks whether, when Japan's adult death rates fell greatly over some seventy years, the speed at which the death rate doubles with age changed, or the overall level fell. The answer: the level fell, and the doubling speed hardly moved. No new mathematical theorem and no new law are claimed.
First, the age-specific death rates at ages 40–84 lie well on an exponential in age (a straight line in logarithms). In all 48 fits (24 years from 1950 to 2024 × men and women) the coefficient of determination is at least 0.9885, and the doubling time is 6.99–8.40 years for men and 6.68–8.52 years for women; from 1960 on it is 6.99–7.49 years for men and 6.68–7.82 years for women (Section 4).
Second, and this is the core of the paper: the death rate at age 62.5 (the level of the line) went, from 1950 to 2024, from 3324.9 to 805.0 for men (0.242 times) and from 2484.3 to 394.4 for women (0.159 times). Splitting the difference between two years into level and slope, the contribution of the slope is only 0.107 to 0.295 of the contribution of the level even at the edges of the window (ages 42.5 and 82.5), for the four pairs 1950→2024 and 1980→2024, men and women. As predicted, what moved is the level (Section 5).
Third, the doubling speeds of men and women changed places. In 1980 it was 7.19 years for men and 6.68 years for women, so women's rate doubled faster; from 1995 on, women's rate doubles more slowly (in 2024, 6.99 years for men and 7.60 years for women) (Section 6).
Fourth, "doubling in 7–8 years" is the average of a curved line. Measured between adjacent five-year groups, the doubling time at ages 40–89 in 2024 spreads from 5.7 to 8.0 years for men and from 4.6 to 9.9 years for women. Below age 40 the form itself does not hold (11.4–1634.1 years for men, 9.2–63.9 years for women) (Section 7).
Fifth, two measures of the curvature of the line point in different directions. For women, "the doubling time at ages 40–64 minus that at ages 60–84" shrank from +3.12 (1950) to +2.11 (2024), while the amount by which the death rate at ages 85–89 lies above the extension of the line grew from +0.136 to +0.509 (1.664 times in the rate). One cannot say in one word that "the curve bent more" (Section 8).
Sixth, the death rate at age 62.5 bottomed out in 2020 and then rose (779.0 → 805.0 for men, 384.2 → 394.4 for women). This is the same direction as M001, which found in the decomposition of the crude death rate that in the intervals from 2020 the side of the age-specific rates also rose. This paper does not state the cause (Section 5).
Scope of this paper (scope note): No new mathematical theorem and no new law are claimed. That adult death rates rise exponentially with age has been known since Gompertz (Gompertz 1825), and fitting a straight line to the logarithms by least squares is a standard method. This paper applies it to public aggregate tables of Japan and only reads whether the slope or the level moved. This paper is a structural interpretation of the shape of numbers in public aggregate data; it is not medical advice, not a diagnosis, and not a treatment recommendation. The author is not a physician. Decisions about individual health should be discussed with a physician or a medical institution. This is a preprint that has not been peer reviewed. Neither the mechanisms of aging nor ways of extending life are discussed: the slope and the level are both shapes of aggregates, and they do not show what happens inside the body. No cause is stated: why the level fell, and why it rose from 2020, is not entered into. It is not the change in one person: the numbers line up people of different ages in the same year, and do not directly measure how the death rate changes as one person grows older. Only public aggregate tables are used: the Ministry of Health, Labour and Welfare's Vital Statistics (e-Stat), which contain no information on individuals. The fitted slopes, levels and doubling times are numbers made by processing them; they are not numbers produced by the government. Relation to earlier papers: M001 split the rise of the crude death rate into the movement of the age composition and the movement of the age-specific rates, and showed that the age-specific rates fell in all 19 groups. Here the shape of those age-specific rates is split into a slope (the doubling speed) and a level. What is added is: writing the predictions before measuring; comparing the contributions of level and slope at the edges of the window; showing how much the doubling time moves when the window is changed; and reporting that two measures of curvature point in different directions.
1. Notation and question
Let m be the death rate at age x. At adult ages, m rises with age at an almost constant proportional rate, and its logarithm is close to a straight line (the Gompertz form). This paper writes the line as
ln(m) = level a + slope b × (x − 62.5).
The slope b is the proportion by which the death rate rises per year of age, and from it the doubling time = ln2 ÷ b follows. The level a is the logarithm of the death rate at age 62.5, the centre of the fitting window (ages 40–84).
Question: when death rates fell, what moved, the slope (the doubling speed) or the level?
Observation 1.1: "Death rates fell" happens whichever of the two moves. If the level falls, all ages fall by the same proportion; if the slope changes, ages fall by different amounts. One phrase contains two different movements.
Observation 1.2: The difference in ln(m) between two years splits, at age x, into "the difference in level Δa + the difference in slope Δb × (x − 62.5)". The contribution of the slope is largest at the edges of the window (ages 42.5 and 82.5), where it is ±20 Δb.
2. Writing the two predictions before measuring
Prediction A (the level moved): even at the edges of the window, the contribution of the slope is smaller than that of the level (|20 Δb| < |Δa|).
Prediction B (the slope moved): at the edges of the window, the contribution of the slope equals or exceeds that of the level (|20 Δb| ≥ |Δa|).
The two say opposite things about the size of the same quantity. That is why the question is settled.
Design (declared before running and not changed at run time)
| Content | |
|---|---|
| Fit | For each year and sex, fit ln(m) = a + b(x − 62.5) by least squares to the 9 five-year groups at ages 40–84; x is the centre of the group |
| Years compared ① | 1950 → 2024 (the first and last years of the table) |
| Years compared ② | 1980 → 2024 (aligned with the year in which the crude death rate was lowest in M001) |
| Checks of the window | Local doubling times between adjacent five-year groups (ages 20–89); fits to the split windows 40–64 and 60–84; the difference between the measured rate at ages 85–89 and the extension of the line |
3. The data and their checks
The data are the same as in M001: Table 5.15 of Volume 1 of the Ministry of Health, Labour and Welfare's Vital Statistics for 2024 (final data), death rates by sex, five-year age group and year. There are 24 year columns (every five years for 1950–2010, every year for 2014–2024). The downloaded file is fixed by SHA-256, and the computation checks it each time it runs.
Calculation 3.1 The smallest death count in the cells used (ages 20–89, men and women, 24 years) is 556; there is no cell below 10.
Calculation 3.2 The slope was obtained in two ways and compared. The difference between the least-squares slope and the slope of the line through the two end points (ages 40–44 and 80–84) is at most 0.0046 over the 48 fits.
4. Measurement: adult death rates lie well on an exponential in every year
Calculation 4.1 Fits to ages 40–84 (excerpt)
| Year | Sex | Slope b | Doubling time | Coefficient of determination | Death rate at 62.5 (per 100,000) |
|---|---|---|---|---|---|
| 1950 | Men | 0.0825 | 8.40 | 0.9975 | 3324.9 |
| 1980 | Men | 0.0964 | 7.19 | 0.9965 | 1668.4 |
| 2000 | Men | 0.0934 | 7.42 | 0.9992 | 1163.4 |
| 2024 | Men | 0.0992 | 6.99 | 0.9994 | 805.0 |
| 1950 | Women | 0.0813 | 8.52 | 0.9902 | 2484.3 |
| 1980 | Women | 0.1037 | 6.68 | 0.9919 | 923.7 |
| 2000 | Women | 0.0923 | 7.51 | 0.9897 | 547.0 |
| 2024 | Women | 0.0911 | 7.60 | 0.9915 | 394.4 |
Observation 4.2: Over the 48 fits the coefficient of determination is at least 0.9885 and at most 0.9999. Adult death rates are nearly exponential in every year.
Observation 4.3: The doubling time stays within 6.99 years (2024) to 8.40 years (1950) for men and 6.68 years (1980) to 8.52 years (1950) for women. From 1960 on it is 6.99–7.49 years for men and 6.68–7.82 years for women.
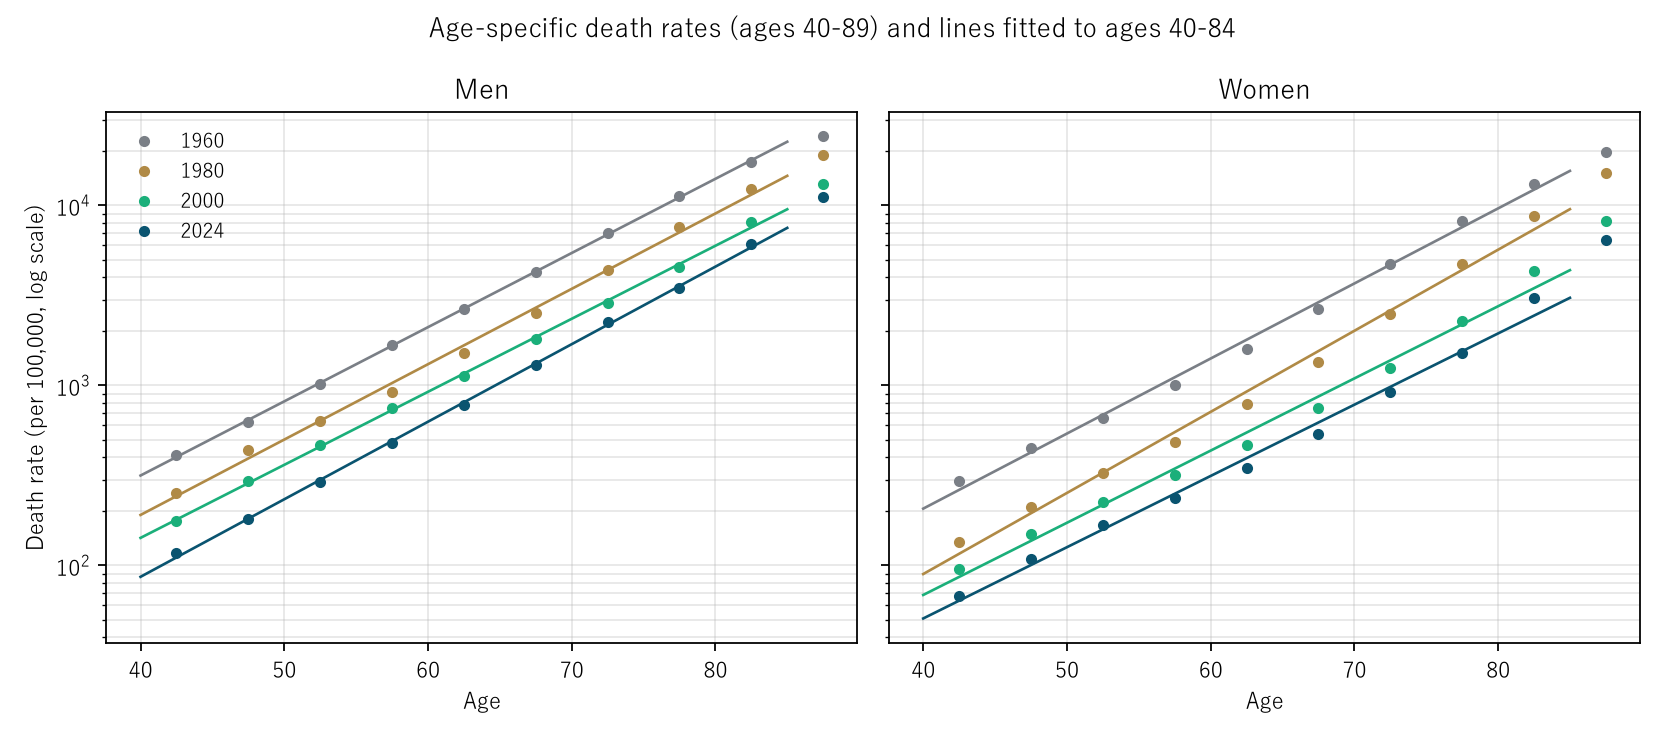
Figure 1: Log scale. Points are measured values; lines are fitted to ages 40–84 (the points at ages 85–89 are not used in the fit). As the years pass, the lines shift downward while staying nearly parallel.
5. Splitting into level and slope: what moved is the level
Calculation 5.1 Splitting the difference between two years into level and slope
| Interval | Sex | Difference in level Δa | Difference in slope Δb | Slope contribution at the window edge 20 Δb | Slope / level |
|---|---|---|---|---|---|
| 1950 → 2024 | Men | −1.418 | +0.0167 | +0.333 | 0.235 |
| 1950 → 2024 | Women | −1.840 | +0.0098 | +0.197 | 0.107 |
| 1980 → 2024 | Men | −0.729 | +0.0028 | +0.056 | 0.077 |
| 1980 → 2024 | Women | −0.851 | −0.0126 | −0.251 | 0.295 |
Observation 5.2: Prediction A holds in all four pairs. Even at the edges of the window, the contribution of the slope is 0.077–0.295 of that of the level.
Observation 5.3: Converting to factors in the rate makes the difference clear. From 1950 to 2024 the level became 0.242 times for men and 0.159 times for women. The factor produced at the window edges by the change in slope stays within 0.717–1.395 for men and 0.821–1.217 for women. From 1980 to 2024 the level became 0.483 times for men and 0.427 times for women, while the change in slope gives 0.946–1.057 for men and 0.778–1.286 for women.
Observation 5.4: The death rate at age 62.5 rose for men from 779.0 in 2020 to 805.0 in 2024, and for women from 384.2 to 394.4. This is the same direction as M001's finding, in the decomposition of the crude death rate, that in the intervals from 2020 the side of the age-specific rates also rose. This paper does not state the cause.
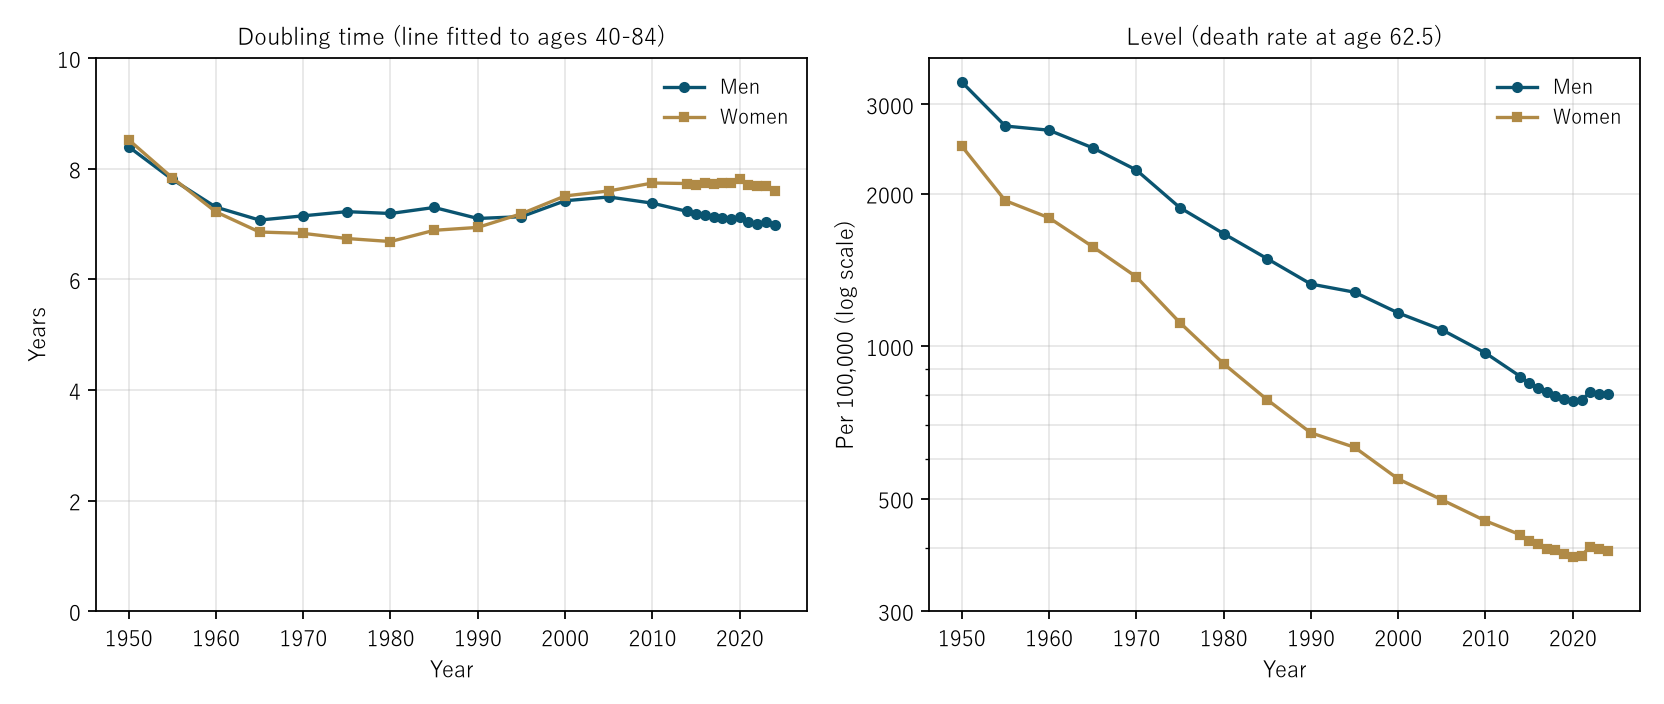
Figure 2: Left, the doubling time (line fitted to ages 40–84); right, the level (death rate at age 62.5, log scale). While the left lines stay nearly flat, the right lines fall greatly.
6. Men and women changed places in doubling speed
Calculation 6.1 The years in which women's doubling time is longer than men's are 1950, 1955, and every year from 1995 on.
Observation 6.2: In 1980 it was 7.19 years for men and 6.68 years for women, so women's death rate doubled faster with age. In 2024 it is 6.99 years for men and 7.60 years for women, the other way round. The level is lower for women in every year (at age 62.5 in 2024, 805.0 for men and 394.4 for women). Level and speed also move separately between the sexes.
7. It changes with the window: "doubling in 7–8 years" is the average of a curved line
Calculation 7.1 Local doubling times between adjacent five-year groups (by the age at the boundary)
| Age at the boundary | 45 | 50 | 55 | 60 | 65 | 70 | 75 | 80 | 85 |
|---|---|---|---|---|---|---|---|---|---|
| Men 2024 | 8.0 | 7.3 | 7.0 | 7.1 | 6.7 | 6.4 | 8.0 | 6.1 | 5.7 |
| Women 2024 | 7.3 | 7.9 | 9.9 | 9.3 | 7.9 | 6.4 | 6.9 | 5.0 | 4.6 |
| Men 1960 | 8.1 | 7.1 | 7.0 | 7.5 | 7.2 | 7.1 | 7.1 | 8.2 | 10.4 |
| Women 1960 | 8.3 | 8.9 | 8.4 | 7.6 | 6.7 | 6.1 | 6.2 | 7.3 | 8.6 |
Observation 7.2: At ages 40–89 in 2024 the local doubling time spreads from 5.7 to 8.0 years for men and from 4.6 to 9.9 years for women. For women it is about 9.9 years in the fifties and 5.0 and 4.6 years in the eighties. "Doubling in 7–8 years" is the value that represents this curved line by a single straight line.
Observation 7.3: Below age 40 the form does not hold in the first place. The local doubling times at ages 20–39 in 2024 are 11.4–1634.1 years for men and 9.2–63.9 years for women. A doubling speed can be stated as one number only at adult ages.
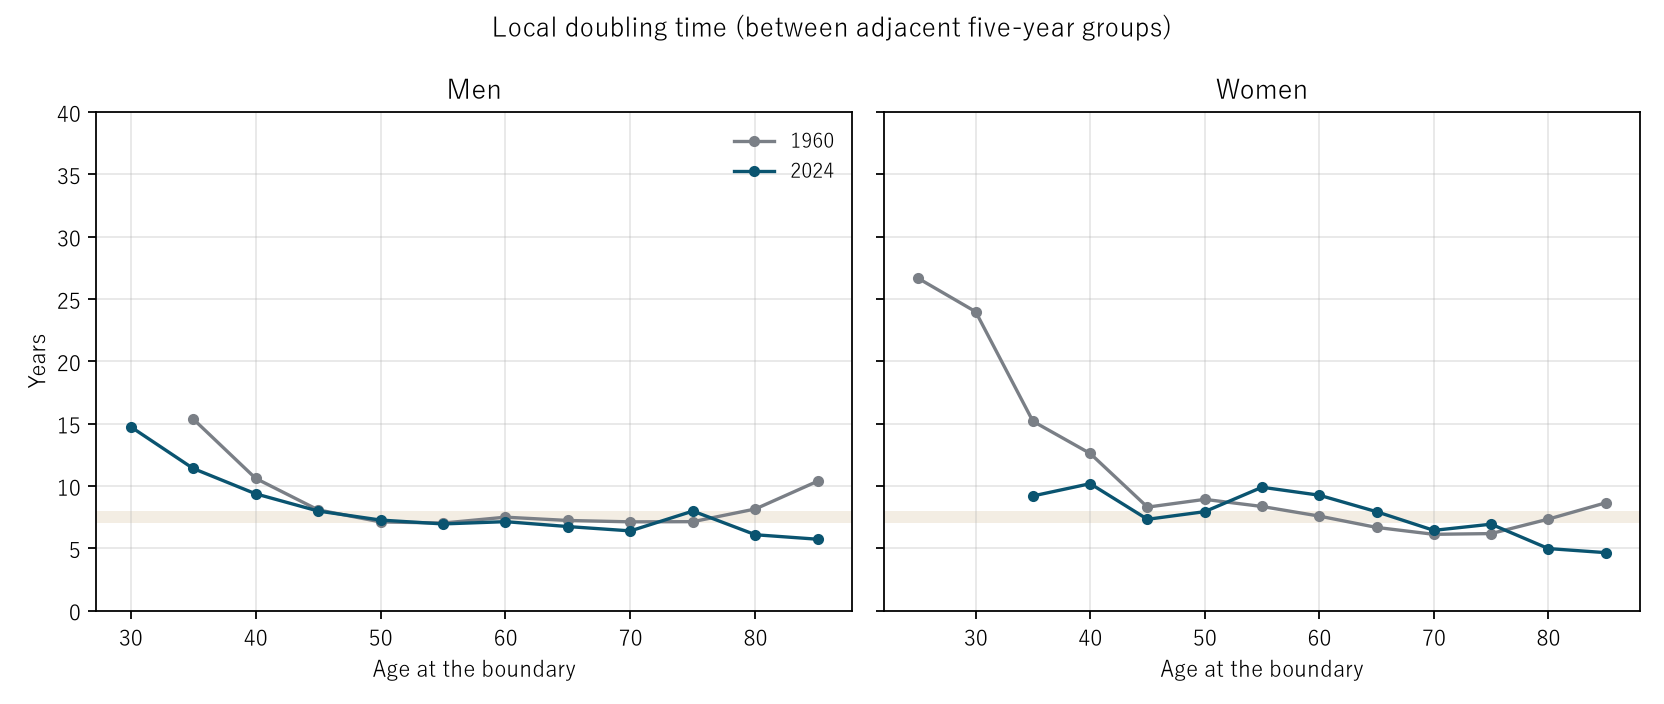
Figure 3: The horizontal axis is the age at the boundary between adjacent five-year groups; the vertical axis is the local doubling time (points above 40 years are not drawn). The band marks 7–8 years.
8. Two measures of curvature point in different directions
Calculation 8.1 Fitting the window split in two
| Year | Sex | Doubling time at 40–64 | Doubling time at 60–84 | Difference |
|---|---|---|---|---|
| 1950 | Men | 9.21 | 8.14 | +1.07 |
| 2024 | Men | 7.27 | 6.80 | +0.47 |
| 1950 | Women | 10.60 | 7.48 | +3.12 |
| 1980 | Women | 7.96 | 5.69 | +2.27 |
| 2024 | Women | 8.55 | 6.44 | +2.11 |
Calculation 8.2 How far the measured rate at ages 85–89 lies above the extension of the line fitted to ages 40–84 (difference in ln): for men −0.011 (1950) → +0.153 (2024; 1.165 times in the rate), and for women +0.136 → +0.509 (1.664 times in the rate).
Observation 8.3: In every year the rate doubles faster at ages 60–84 than at 40–64 (the difference is positive); the line bends upward. But the change in the bend points in different directions depending on the measure. Within the window, the difference (40–64 against 60–84) shrank for women from +3.12 to +2.11. Outside the window, the distance at ages 85–89 grew for women from +0.136 to +0.509.
Observation 8.4: One therefore cannot say in one word either that "the curve bent more" or that "it bent less". Unless one says the curvature over which range of ages, the answer is not determined.
9. Limitations
- Rates for five-year groups were used. The age distribution within a group enters the fit of the line.
- The window was fixed at ages 40–84. As Sections 7 and 8 show, changing the window moves the doubling time. The core of the paper (the level moved) is stated by comparing the same window across years.
- The numbers line up people of different ages in the same year (period figures). They are not the change in one person as he or she grows older.
- No cause is stated. Why the level fell, and why it rose from 2020, lie outside this split.
- Deaths are not split by cause. Only all-cause death rates are used.
- Only Japan is treated. Other countries are not included.
Conclusion
From 1950 to 2024, adult death rates rose with age nearly exponentially in every year (coefficient of determination at least 0.9885). The doubling speed stayed within 6.99–8.40 years for men and 6.68–8.52 years for women. Meanwhile, the death rate at age 62.5 became 0.242 times as large for men and 0.159 times for women. Even at the edges of the window, the contribution of the slope is 0.077–0.295 of the contribution of the level.
What separates them is one thing: whether what moved is the slope (the doubling speed) or the level. Over some seventy years, what moved was almost entirely the level.
The single number "7–8 years", however, is the average of a curved line. Unless one says over which range of ages it is measured, neither the doubling speed nor the direction of the bend is determined.
Data and reproduction
| Data | Ministry of Health, Labour and Welfare, Vital Statistics 2024 (final data), Volume 1, Table 5.15. Obtained from e-Stat (accessed 25 September 2026) |
| Terms of use | e-Stat content follows the Government of Japan Standard Terms of Use (Version 2.0), compatible with CC BY 4.0. The numbers in this paper were made by processing these data |
| Coverage | Japan (Japanese nationals in Japan), all causes, by sex, 1950–2024 (every five years for 1950–2010, every year for 2014–2024), ages 20–89 |
| Computation | 検算/M002.py (--zu also writes the figures). Every number in the text is taken from 検算/M002_output.txt |
| Raw data | The file as downloaded, with SOURCES.md (URL, date of access, SHA-256), in data/. The computation checks the SHA-256 each time it runs |
| Figures | 図/M002_zu1, 図/M002_zu2, 図/M002_zu3 (png, svg, English versions) |
References
- Gompertz, B. (1825). On the Nature of the Function Expressive of the Law of Human Mortality, and on a New Mode of Determining the Value of Life Contingencies. Philosophical Transactions of the Royal Society of London. 10.1098/rstl.1825.0026
- Ministry of Health, Labour and Welfare. Vital Statistics 2024 (final data), Volume 1, Table 5.15 (in Japanese). e-Stat (accessed 25 September 2026). https://www.e-stat.go.jp/
- Yamagishi, Y. (2026). "The Death Rate Rose" Names Two Movements at Once, the Age Composition and the Age-Specific Rates [M001]. Zenodo. https://doi.org/10.5281/zenodo.22963112
Reference
Yamagishi, Y. (2026). The Speed at Which Adult Death Rates Double with Age Hardly Moved; What Fell Was the Level [M002]. Zenodo.
DOI: 10.5281/zenodo.22963210
YOI: https://www.yamagishiyuuki.com/yoi/M002
ORCID: 0009-0006-8587-3450
PDF (English) · PDF (Japanese) · Date proof of the English PDF (OpenTimestamps .ots) · SHA256SUMS
The record page for this paper (in Japanese, with the PDFs in each language and the date proof): YOI M002. This paper is a preprint and has not been peer reviewed.