Abstract
This paper asks whether a year's "life expectancy" represents the number of years that people of that age in that year actually live. The answer: it does not. Life expectancy summarizes that year's age-specific death rates, and in Japan, where the rates kept falling, it was several years shorter than what the same people actually lived. No new mathematical theorem and no new law are claimed.
First, the life table this paper builds from public five-year death rates reproduces the official life tables. For the four pairs of men and women in the 2020 complete life table and the 2024 abridged life table, the expectancy between ages 40 and 90 differs by at most 0.073 years, and the share surviving to age 90 differs by at most 0.006. Life expectancy at age 40 differs by up to 0.316 years, but most of that difference comes from the part above age 90 (Section 3).
Second, and this is the core of the paper: following people aged 40–44 in 1950–1975 diagonally up to ages 85–89 (6 birth groups × men and women = 12 pairs), the years actually lived between ages 40 and 90 exceed the expectancy computed from the rates of the starting year in all 12 pairs, by 3.698 to 6.258 years (Section 4).
Third, the difference is large in the share surviving to age 90. Computed from the 1950 rates, 0.0157 of men aged 40 reach age 90; followed in reality, the share was 0.0962, 6.140 times as large. Across the 12 pairs the ratio is 3.802 to 8.435 (Section 4).
Fourth, that year's expectancy catches up with the actual value of the same people only with a delay. The period expectancy between ages 40 and 90 reached the cohort value 21.2–27.4 years after the starting year (Section 5).
Fifth, the period expectancy can also fall. In this paper's computation, life expectancy at age 40 peaked in 2020 and fell (42.63 → 42.07 for men, 48.69 → 48.02 for women), and in the official life tables it also fell, from 42.50 to 42.03 for men and from 48.37 to 47.88 for women. This means that the summary of that year's rates fell; it does not measure that anyone's lifetime became shorter. This paper does not state the cause (Section 6).
Sixth, the official description of the life table itself says that the table is made "assuming that the mortality conditions of a period (the age-specific death rates) do not change from now on". In the 12 pairs this paper followed, that assumption did not hold in any pair: the rates kept falling. Life expectancy is not a forecast but a photograph of that year's rates (Sections 2 and 4).
Scope of this paper (scope note): No new mathematical theorem and no new law are claimed. The distinction between a life table built from one year's rates (period) and one that follows people born at the same time (cohort) is known in demography, and building life tables from five-year groups is a standard method. This paper only measures the size of the difference on public aggregate tables of Japan. This paper is a structural interpretation of the shape of numbers in public aggregate data; it is not medical advice, not a diagnosis, and not a treatment recommendation. The author is not a physician. Decisions about individual health should be discussed with a physician or a medical institution. This is a preprint that has not been peer reviewed. No individual's remaining lifetime is predicted: every number in this paper is a summary of a group, and none says how many more years a particular person will live. Future life expectancy is not predicted: whether rates will keep falling lies outside this paper. No cause is stated: why the rates fell, and why period expectancy fell from 2020, is not entered into. Life expectancy at birth is not computed: ages 0–4 form a single group, so age 40 is used as the starting point. Only public aggregate tables are used: the Ministry of Health, Labour and Welfare's Vital Statistics and Life Tables (e-Stat), which contain no information on individuals. The life tables built in this paper are numbers made by processing them; they are not life tables produced by the government. Relation to earlier papers: M001 split the rise of the crude death rate into the movement of the age composition and the movement of the age-specific rates, and showed that the age-specific rates kept falling. M002 showed that the fall of those rates was almost entirely a fall in the level. Here, those falling rates are read either across one year or down one birth group, and the difference this makes to expectancy is measured. What is added is: writing the predictions before measuring; checking the life tables built from five-year groups against the official life tables and showing where the difference comes from (above age 90); measuring the difference both in years and in the share surviving to 90; and measuring the delay before the period value catches up.
1. Notation and question
A life table starts with people aged 40 set to 1 and follows how many survive as the death rate of each age is applied. From the five-year death rate m (per person), this paper takes the share dying in each group as q = 5m ÷ (1 + 2.5m), the survivors as l, and the years lived in the group as L = 2.5 (l + the next l), and accumulates them.
Three quantities follow:
- Life expectancy at age 40: the average number of years lived beyond age 40 (for 90 and over, an open group with L = l90 ÷ m90+)
- Expectancy between ages 40 and 90: the average number of years lived between ages 40 and 90 (no open group is used)
- Share surviving to age 90: l90 ÷ l40
There are two ways to build a life table:
- Period: use only the rates at all ages in one year. It is the value for an imaginary person, assuming that year's rates continue for ever
- Cohort: follow people aged 40–44 in year Y diagonally, as ages 45–49 in year Y+5, …, ages 85–89 in year Y+45, using the rates of the same birth group
Question: how far does the period expectancy differ from the years the same people actually lived?
Observation 1.1: "Life expectancy" becomes a different number depending on which of the two it refers to. The life expectancy published every year officially is the period one.
2. Writing the two predictions before measuring
The official life table is defined as follows in the description on e-Stat (translated by the author):
A life table expresses, by indicators such as death rates and life expectancy (life-table functions), the probability that a person at each age dies within one year and the expected number of further years of life, assuming that the mortality conditions of a period (the age-specific death rates) do not change from now on.
Prediction A (the period value is shorter than the years actually lived): in all 12 pairs (6 birth groups × men and women), the cohort expectancy between ages 40 and 90 exceeds the period value of the starting year, and the share surviving to 90 is also larger for the cohort.
Prediction B (almost the same): in all 12 pairs, the difference in expectancy between ages 40 and 90 is below 0.5 years.
The two are separated by the size of the difference. That is why the question is settled.
Design (declared before running and not changed at run time)
| Content | |
|---|---|
| Rates | Five-year death rates in Table 5.15 of the Ministry of Health, Labour and Welfare's Vital Statistics (every five years for 1950–2010, every year for 2014–2024) |
| Start and end | From age 40. The main measure is the expectancy between ages 40 and 90, which stops at 90 (no open group is used) |
| Cohorts | People aged 40–44 in year Y. In the year columns of the table, those who can be followed to ages 85–89 are the 6 groups Y = 1950, 1955, 1960, 1965, 1970, 1975 |
| Check | Compared with the 2020 complete life table and the 2024 abridged life table (both official, by single year of age) |
Observation 2.1: "Assuming that … do not change from now on" in the official description is the period life table itself. Prediction A predicts a difference equal to the amount by which that assumption failed in reality.
3. Does this paper's life table reproduce the official one?
Calculation 3.1 Period life tables built from five-year groups, against the official life tables
| Year | Sex | Expectancy 40–90 (this paper / official) | Share surviving to 90 (this paper / official) | Life expectancy at 40 (this paper / official) |
|---|---|---|---|---|
| 2020 | Men | 41.190 / 41.217 | 0.2916 / 0.2854 | 42.63 / 42.50 |
| 2020 | Women | 45.186 / 45.259 | 0.5356 / 0.5308 | 48.69 / 48.37 |
| 2024 | Men | 40.873 / 40.910 | 0.2655 / 0.2619 | 42.07 / 42.03 |
| 2024 | Women | 44.995 / 45.057 | 0.5115 / 0.5074 | 48.02 / 47.88 |
The official expectancy between 40 and 90 was made from the person-years T in the official table as (T at 40 − T at 90) ÷ l at 40.
Observation 3.2: The expectancy between 40 and 90 differs by −0.073, −0.027, −0.063 and −0.037 in the four pairs, at most 0.073 years. The share surviving to 90 differs by at most 0.006. Even built from five-year groups, the table nearly matches the official table by single year of age.
Observation 3.3: Life expectancy at 40 differs by +0.316, +0.130, +0.137 and +0.045, at most 0.316 years. Of this, the part above age 90 is +0.389, +0.158, +0.200 and +0.082, larger than the part between 40 and 90 in all four pairs. Most of the difference comes from treating ages 90 and over as a single open group. This is why the main measure of this paper is the expectancy between ages 40 and 90.
4. Period and cohort: the same people lived longer than the period value
Calculation 4.1 Expectancy between ages 40 and 90, and the share surviving to 90, for people aged 40–44 in year Y
| Start Y | Sex | Period expectancy | Cohort expectancy | Difference | Period share to 90 | Cohort share to 90 | Ratio |
|---|---|---|---|---|---|---|---|
| 1950 | Men | 29.031 | 33.110 | +4.079 | 0.0157 | 0.0962 | 6.140 |
| 1955 | Men | 30.919 | 34.810 | +3.891 | 0.0300 | 0.1323 | 4.406 |
| 1960 | Men | 31.081 | 36.029 | +4.949 | 0.0223 | 0.1605 | 7.211 |
| 1965 | Men | 31.797 | 37.167 | +5.370 | 0.0225 | 0.1895 | 8.435 |
| 1970 | Men | 32.709 | 37.456 | +4.746 | 0.0342 | 0.2045 | 5.978 |
| 1975 | Men | 34.358 | 38.056 | +3.698 | 0.0567 | 0.2360 | 4.159 |
| 1950 | Women | 32.047 | 37.705 | +5.658 | 0.0420 | 0.2416 | 5.755 |
| 1955 | Women | 34.261 | 39.498 | +5.237 | 0.0703 | 0.3104 | 4.414 |
| 1960 | Women | 34.802 | 40.916 | +6.115 | 0.0638 | 0.3691 | 5.784 |
| 1965 | Women | 35.781 | 42.038 | +6.258 | 0.0675 | 0.4133 | 6.125 |
| 1970 | Women | 36.850 | 42.921 | +6.071 | 0.0885 | 0.4520 | 5.105 |
| 1975 | Women | 38.431 | 43.558 | +5.127 | 0.1285 | 0.4884 | 3.802 |
Calculation 4.2 A check of the cohort computation: along the same diagonal path, fixing all the rates at the starting year returns the period value in all 12 pairs (largest difference 0.0e+00).
Observation 4.3: Prediction A holds in all 12 pairs. The difference is 3.698–6.258 years, and Prediction B (below 0.5 years) holds in no pair. The ratio of the shares surviving to 90 is 3.802–8.435.
Observation 4.4: For men aged 40–44 in 1950, the period life table built from the 1950 rates says "0.0157 reach age 90". Following the same people to ages 85–89 in 1995, the share was 0.0962. That year's life expectancy was not a number that foretold the future of the people of that age in that year.
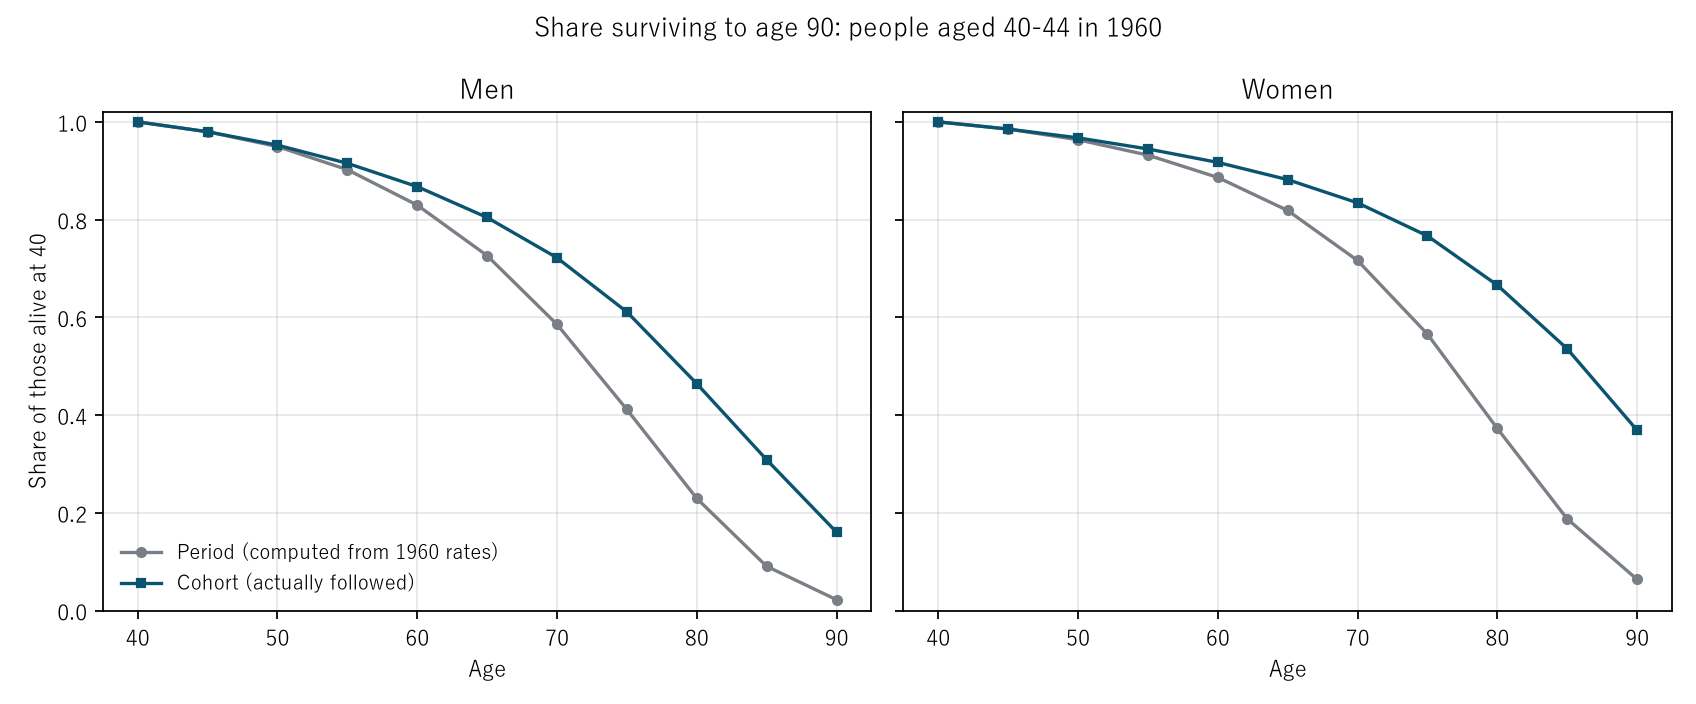
Figure 2: The vertical axis is the share of those alive at 40 who are still alive. Grey is the period life table built only from the 1960 rates; navy is the cohort following the same people diagonally. The two lines move apart with age, and at 90 they are 0.0223 and 0.1605 for men and 0.0638 and 0.3691 for women.
5. The period value catches up late
Calculation 5.1 The year in which the period expectancy between 40 and 90 reaches each cohort's value (straight-line interpolation between adjacent years)
| Start Y | Men: year reached | Men: delay | Women: year reached | Women: delay |
|---|---|---|---|---|
| 1950 | 1971.2 | 21.2 | 1972.7 | 22.7 |
| 1955 | 1977.2 | 22.2 | 1979.1 | 24.1 |
| 1960 | 1983.1 | 23.1 | 1984.8 | 24.8 |
| 1965 | 1989.5 | 24.5 | 1991.1 | 26.1 |
| 1970 | 1993.3 | 23.3 | 1997.4 | 27.4 |
| 1975 | 1997.7 | 22.7 | 2001.2 | 26.2 |
Observation 5.2: The delay before the period value reaches the cohort value is 21.2–27.4 years across the 12 pairs. The years the same people actually lived between ages 40 and 90 were about equal to the period expectancy of a year some twenty-odd years later.
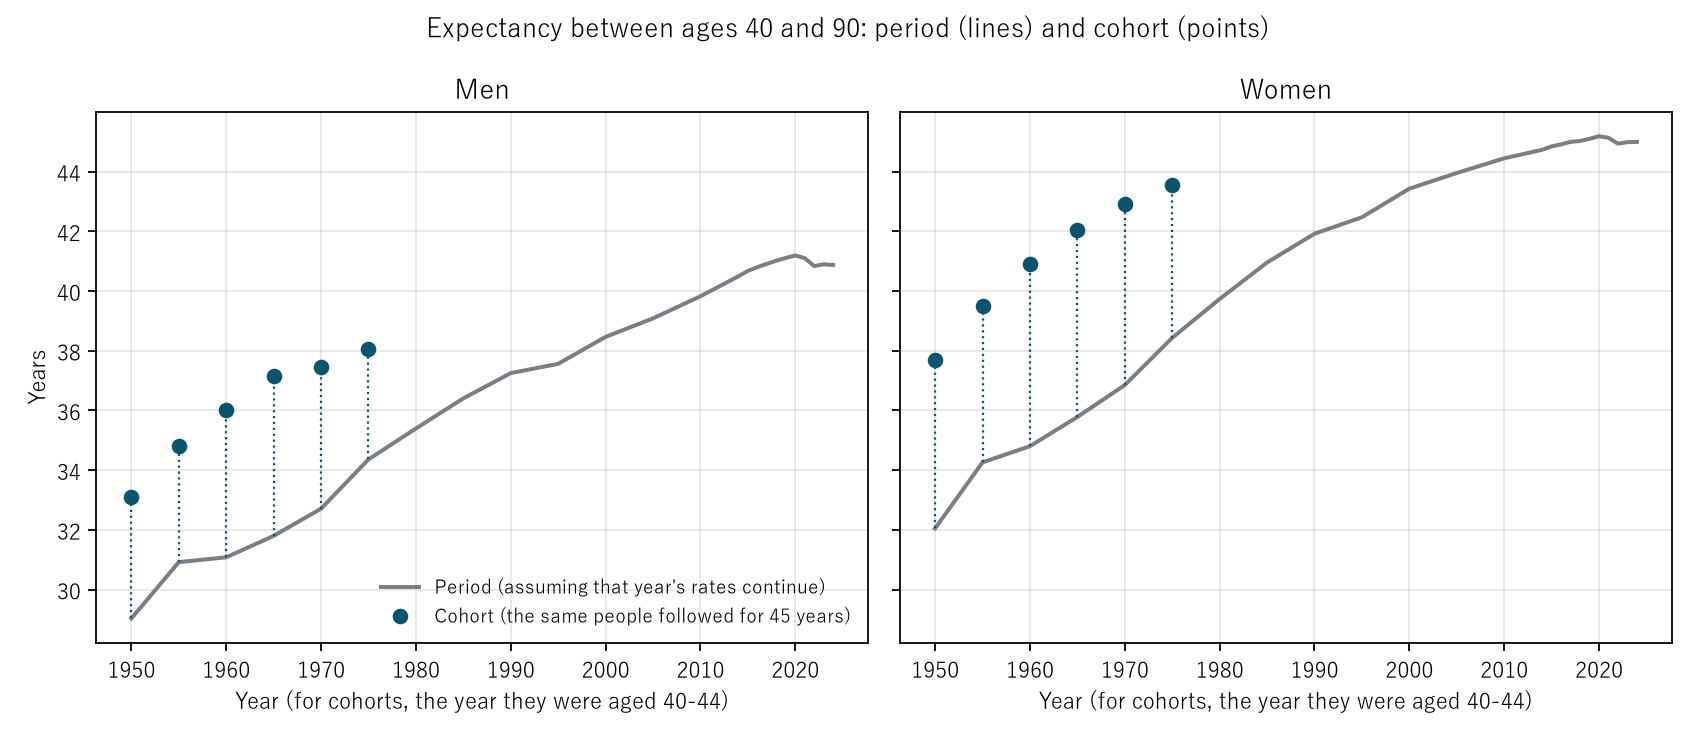
Figure 1: The grey line is the period expectancy between ages 40 and 90; the navy points are the actual values of the people aged 40–44 in that year. The length of the dotted lines is the difference of Section 4. The line reaches the height of each point twenty-odd years to the right.
6. Period expectancy can also fall; that is not anyone's lifetime becoming shorter
Calculation 6.1 Life expectancy at age 40 (period)
| 2020 | 2024 | Difference | |
|---|---|---|---|
| Men (this paper) | 42.63 | 42.07 | −0.56 |
| Men (official) | 42.50 | 42.03 | −0.47 |
| Women (this paper) | 48.69 | 48.02 | −0.67 |
| Women (official) | 48.37 | 47.88 | −0.49 |
Observation 6.2: In this paper's computation and in the official tables, life expectancy at 40 fell from 2020 to 2024. In this paper's computation, 2020 is the longest year in the table for both men and women. This is how M001's and M002's finding that "there are intervals from 2020 in which the age-specific rates rose" appears in the period life table.
Observation 6.3: But the period expectancy is a photograph of that year's rates. That the 2024 value fell means that the value "assuming the 2024 rates continue for ever" fell; it does not measure how many years people aged 40 in 2020 will actually live. As Section 4 shows, the actual value can differ from the period value by several years. This paper does not state the cause of this fall.
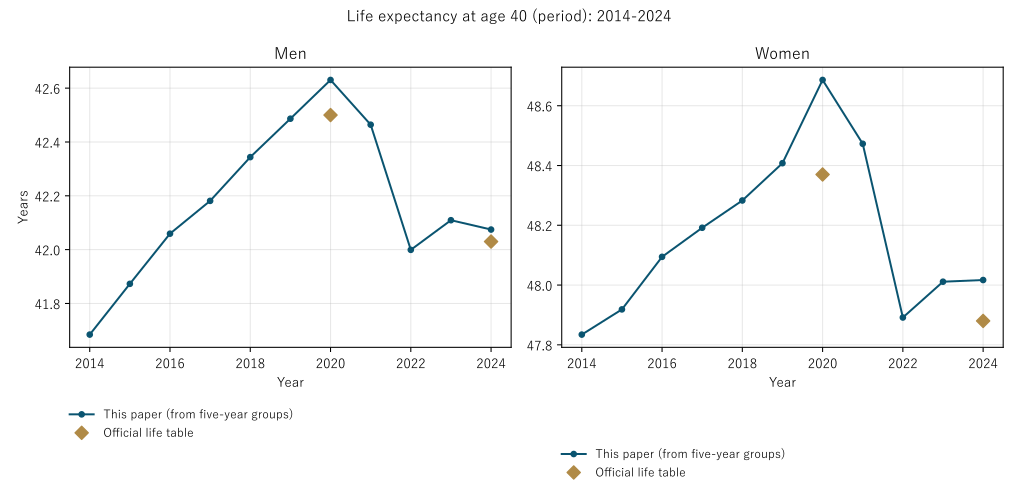
Figure 3: Navy is the value this paper built from five-year groups; the gold diamonds are the official life tables (2020 and 2024). This paper's values are slightly higher than the official ones (the treatment above age 90 in Section 3), but the direction of movement is the same.
7. Limitations
- The tables were built from five-year rates. Compared with the official tables by single year of age, they differ by at most 0.073 years in the expectancy between 40 and 90 and by at most 0.316 years in life expectancy at 40 (Section 3).
- Cohorts were followed as five-year bands aged 40–44. Because the year columns of the table are five years apart, people aged 40–44 in year Y are followed as ages 45–49 in year Y+5.
- Cohorts were stopped at age 90. Beyond 90 the year columns of the table do not reach far enough, and cohort life expectancy as a whole was not computed.
- Life expectancy at birth was not computed. Ages 0–4 form a single group.
- No cause is stated. Why the rates fell, and why period expectancy fell from 2020, lie outside this comparison.
- Only Japan and all causes are treated.
Conclusion
Life expectancy is the value obtained by assuming that the year's age-specific death rates continue for ever; the official description says so. Following in reality the people aged 40–44 in 1950–1975, the years they lived between ages 40 and 90 exceeded that year's expectancy in all 12 pairs, by 3.698–6.258 years, and the share who reached 90 was 3.802–8.435 times as large. It took 21.2–27.4 years for that year's expectancy to catch up.
What separates them is one thing: whether one reads the life table across one year or down one birth group.
So whether life expectancy rises or falls, what changed is first of all the photograph of that year's rates. The years anyone actually lives appear only when the table is read downward.
Data and reproduction
| Data | Ministry of Health, Labour and Welfare, Vital Statistics 2024 (final data), Volume 1, Table 5.15. Ministry of Health, Labour and Welfare, The 23rd Life Tables (complete life tables), Tables 1 and 2, and Abridged Life Tables for 2024, Tables 1 and 2. All obtained from e-Stat (accessed 25 September 2026) |
| Terms of use | e-Stat content follows the Government of Japan Standard Terms of Use (Version 2.0), compatible with CC BY 4.0. The life tables in this paper were made by processing these data |
| Coverage | Japan (Japanese nationals), all causes, by sex, ages 40–89 and 90 and over |
| Computation | 検算/M003.py (--zu also writes the figures). Every number in the text is taken from 検算/M003_output.txt |
| Raw data | The 5 files as downloaded, with SOURCES.md (URL, date of access, SHA-256, and a copy of e-Stat's description of the life tables), in data/. The computation checks the SHA-256 each time it runs |
| Figures | 図/M003_zu1, 図/M003_zu2, 図/M003_zu3 (png, svg, English versions) |
References
- Ministry of Health, Labour and Welfare. Vital Statistics 2024 (final data), Volume 1, Table 5.15 (in Japanese). e-Stat (accessed 25 September 2026). https://www.e-stat.go.jp/
- Ministry of Health, Labour and Welfare. The 23rd Life Tables (complete life tables), Tables 1 and 2; Abridged Life Tables for 2024, Tables 1 and 2 (in Japanese). e-Stat (accessed 25 September 2026). https://www.e-stat.go.jp/
- Yamagishi, Y. (2026). "The Death Rate Rose" Names Two Movements at Once, the Age Composition and the Age-Specific Rates [M001]. Zenodo. https://doi.org/10.5281/zenodo.22963112
- Yamagishi, Y. (2026). The Speed at Which Adult Death Rates Double with Age Hardly Moved; What Fell Was the Level [M002]. Zenodo. https://doi.org/10.5281/zenodo.22963210
Reference
Yamagishi, Y. (2026). Life Expectancy Is Not the Number of Years Anyone Actually Lives [M003]. Zenodo.
DOI: 10.5281/zenodo.22963485
YOI: https://www.yamagishiyuuki.com/yoi/M003
ORCID: 0009-0006-8587-3450
PDF (English) · PDF (Japanese) · Date proof of the English PDF (OpenTimestamps .ots) · SHA256SUMS
The record page for this paper (in Japanese, with the PDFs in each language and the date proof): YOI M003. This paper is a preprint and has not been peer reviewed.