Abstract
This paper asks what the yearly counts of PubMed, taken as "the growth of medical papers", are actually counting. The answer: more than half of the growth over the last ten-odd years comes from records not indexed for MEDLINE, and the doubling time differs by a factor of more than two depending on which is counted. And the recent fall could not be explained by what I had expected in the preliminary survey, that "the counting is not finished yet". No new mathematical theorem and no new law are claimed.
First, the number of PubMed records by year of publication has grown close to exponentially since 1950. The doubling time is 15.9 years for 1950–1970, 21.8 years for 1970–1990, 16.2 years for 1990–2010, 16.5 years for 2010–2019 and 15.2 years for 2010–2024 (Section 4).
Second, and this is the core of the paper: counting only records indexed for MEDLINE over the same 2010–2019, the doubling time becomes 35.5 years. Of the 476,628 records added from 2010 to 2019, 0.543 lie outside MEDLINE, and from 2000 to 2019 the records outside MEDLINE became 7.728 times as many while MEDLINE records became 2.189 times as many (Section 5).
Third, the share of records indexed for MEDLINE fell from 0.940 in 2003, the highest in 2000–2025, to 0.751 in 2019. Between 2003 and 2019 it rose above the previous year only in 2007, and it fell every year from 2007 to 2019 (Section 5).
Fourth, the delay in registration in PubMed is short. For publication years 2005–2024, records are entered 0.042–0.137 in the year before, 0.802–0.873 in the same year and 0.038–0.072 in the next year, and the share entered two or more years later is only 0.0008–0.0035 for 2010–2021 (Section 6).
Fifth, what I had expected in the preliminary survey did not hold. Counted by year of publication, records fell from 1,787,579 in 2021 to 1,697,623 in 2023, a fall of 0.0503. To fill this with "not counted yet", the 2023 records would still have to grow by 0.0530, 15.0 times the largest observed share of registration two or more years late. Counted by year of entry, 2021→2023 also fell, by 0.0279. This paper does not state the cause of this fall (Section 7).
Sixth, "the counting is not finished" applies only to the newest year, whose next-year registration had not ended at the time of retrieval. The records for 2025 number 1,881,869, the most in the table, but the part entered in that year and the year before is 0.9615, and registration in the next year (2026) is still in progress (Section 6).
Scope of this paper (scope note): No new mathematical theorem and no new law are claimed. That the scientific literature grows exponentially has long been said, and counting PubMed records by year has often been done. This paper only measures, with public bibliographic counts, how the answer changes with what is counted. This paper is a structural interpretation of the shape of numbers in public aggregate data; it is not medical advice, not a diagnosis, and not a treatment recommendation. The author is not a physician. Decisions about individual health should be discussed with a physician or a medical institution. This is a preprint that has not been peer reviewed. The quality or value of research is not discussed: counts are numbers, not the merits of papers. No journal, publisher or author is named: only yearly counts were taken. No cause is stated: why records rose in 2020–2021, why they fell in 2021→2023, and which kinds of records outside MEDLINE grew, are not entered into. The delay in MEDLINE indexing is not measured: as PubMed explains, the MEDLINE filter keeps only records whose indexing is complete, so MEDLINE counts for recent years may lack records still being indexed. The core is therefore built on years up to 2019. On the data: Courtesy of the U.S. National Library of Medicine. The counts are as retrieved on 25 September 2026 and do not reflect the most current or accurate data available from NLM. NLM does not endorse this paper. Record of the prediction: the expectation that "the recent fall is most likely a delay in indexing" was written in the preliminary survey (morning of 25 September 2026) before the data were taken; this paper tests it as Prediction A and reports that it failed. What is added is: setting side by side the doubling times of two sets, all of PubMed and MEDLINE; measuring the delay in registration with a table of publication year × entry year; comparing, on the same scale, the share needed to fill the fall and the observed share of late registration; and showing in numbers that my own expectation failed.
1. Notation and question
In PubMed searches, the same "count per year" can be taken in several ways. This paper uses three (terms of the PubMed User Guide):
- Year of publication [dp]: the date of publication of the paper (print and electronic dates, excluding electronic dates that occur after the print date)
- Year of entry [edat]: the date the record was entered in PubMed (the date used for the "Most Recent" sort order)
- MEDLINE [sb]: limits results to records indexed for MEDLINE. PubMed also contains records whose indexing is not complete, preprints, records published online ahead of print, and records from journals not indexed for MEDLINE
Question: does the "doubling speed" of medical papers change with what is counted? And is the recent fall due to the counting not being finished?
Observation 1.1: "Medical papers increased" can happen through ① more research, ② PubMed covering a wider range, or ③ recent years still being registered. One phrase gathers separate movements.
2. Writing the predictions before measuring
In the preliminary survey (before taking the data), I wrote: "records appear to fall from 1,783,558 in 2022 to 1,739,816 in 2024; most likely a delay in indexing (recent years are not yet fully included)".
Prediction A (the counting is not finished): records of recent publication years are registered substantially later. The share registered two or more years late exceeds the share needed to fill the fall of 2021→2023.
Prediction B (the counting is finished): in past publication years, the share registered two or more years late is far smaller than the share needed to fill the fall.
The two say opposite things about the size of the same two shares. That is why the question is settled.
Design: this was decided after the counts were taken, and I say so plainly here (the prediction is kept as written in the preliminary survey).
| Content | |
|---|---|
| Retrieval | Only counts were taken with esearch of PubMed E-utilities (440 queries, 25 September 2026) |
| A | Records by year of publication (1950–2025) |
| B | Records indexed for MEDLINE by year of publication (1950–2025) |
| C | Records by year of entry (1990–2025) |
| D | Records by year of publication × year of entry (publication years 2005–2025; entry years from the year before publication up to 2025) |
| Doubling time | Fit log2(count) with a straight line in year. Windows 1950–1970, 1970–1990, 1990–2010, 2010–2019, 2010–2024 (2025 is excluded because its next-year registration is in progress) |
| Growth outside MEDLINE | Compared for 2000→2019 and 2010→2019 (from 2020, MEDLINE counts may include records still being indexed, so they are not used for the core) |
3. The data and their checks
Calculation 3.1 The responses retrieved (search term, URL, count, time of retrieval) were saved as JSON as they were and fixed by SHA-256. The computation uses only the saved JSON and does not query PubMed (the counts change daily).
| What was checked | Result |
|---|---|
| Search terms match the declared forms | A 76, B 76, C 36, D 252, all as declared |
| The sum of counts split by year of entry does not exceed the count by year of publication | Not exceeded in any of the 21 years |
| Time of retrieval | 2026-09-25T21:06:23 to 2026-09-25T21:13:13 |
4. Measurement: all of PubMed has doubled about every 15–22 years
Calculation 4.1 Doubling time (log2 count fitted with a straight line in year)
| Window | All of PubMed | Coefficient of determination | MEDLINE only | Coefficient of determination |
|---|---|---|---|---|
| 1950–1970 | 15.9 | 0.8803 | 16.2 | 0.8718 |
| 1970–1990 | 21.8 | 0.9809 | 23.1 | 0.9845 |
| 1990–2010 | 16.2 | 0.9450 | 16.7 | 0.9466 |
| 2010–2019 | 16.5 | 0.9581 | 35.5 | 0.7367 |
| 2010–2024 | 15.2 | 0.9509 | 33.2 | 0.7471 |
Observation 4.2: For all of PubMed, "doubling about every 15 years" holds after 1990 as well (16.2, 16.5 and 15.2 years).
Observation 4.3: Up to 2010, counting only MEDLINE gave nearly the same doubling time (16.2 and 16.7, 21.8 and 23.1). Only from 2010 do the two separate widely (16.5 and 35.5).
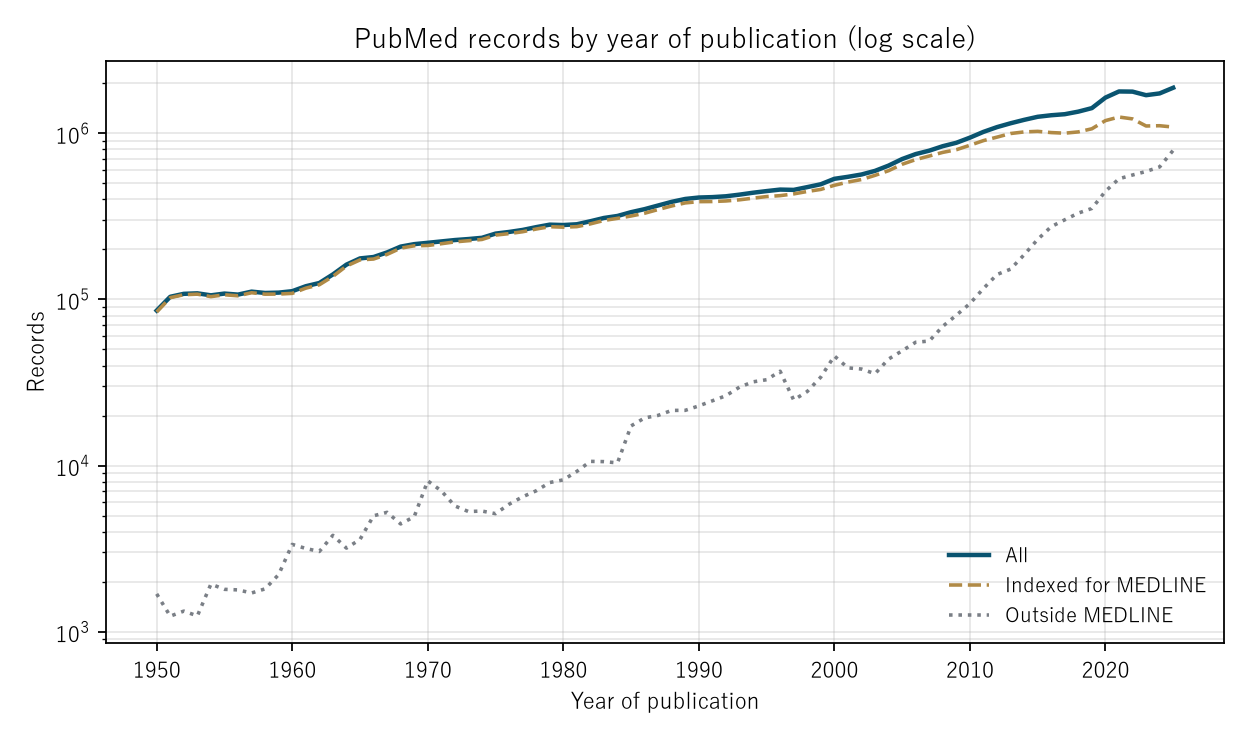
Figure 1: Log scale. Navy is all records, the gold dashed line is records indexed for MEDLINE, and the grey dotted line is records outside MEDLINE. From around 2010 the lines for all records and MEDLINE move apart.
5. Where the growth came from: more than half from outside MEDLINE
Calculation 5.1 Breakdown of the records added
| Interval | Total increase | MEDLINE increase | Increase outside MEDLINE | Share of increase outside MEDLINE |
|---|---|---|---|---|
| 2000 → 2019 | +886,359 | +578,852 | +307,507 | 0.347 |
| 2010 → 2019 | +476,628 | +217,882 | +258,746 | 0.543 |
Observation 5.2: More than half (0.543) of the records added from 2010 to 2019 are records not indexed for MEDLINE. From 2000 to 2019, records outside MEDLINE went from 45,705 to 353,212, 7.728 times, and MEDLINE records from 486,932 to 1,065,784, 2.189 times.
Calculation 5.3 Share of records indexed for MEDLINE
| Year of publication | 2000 | 2003 | 2010 | 2019 | 2024 | 2025 |
|---|---|---|---|---|---|---|
| Share for MEDLINE | 0.914 | 0.940 | 0.900 | 0.751 | 0.639 | 0.580 |
Observation 5.4: In 2000–2025 the MEDLINE share is highest in 2003, at 0.940. Between 2003 and 2019 it rose above the previous year only in 2007, and it fell every year from 2007 to 2019. The shares from 2023 on (0.639 in 2024, 0.580 in 2025) may include records still being indexed.
Observation 5.5: "Medical papers double about every 15 years" is the answer when all of PubMed is counted. Counting records indexed for MEDLINE, 2010–2019 gives 35.5 years. Both are correct; the sets being counted differ.
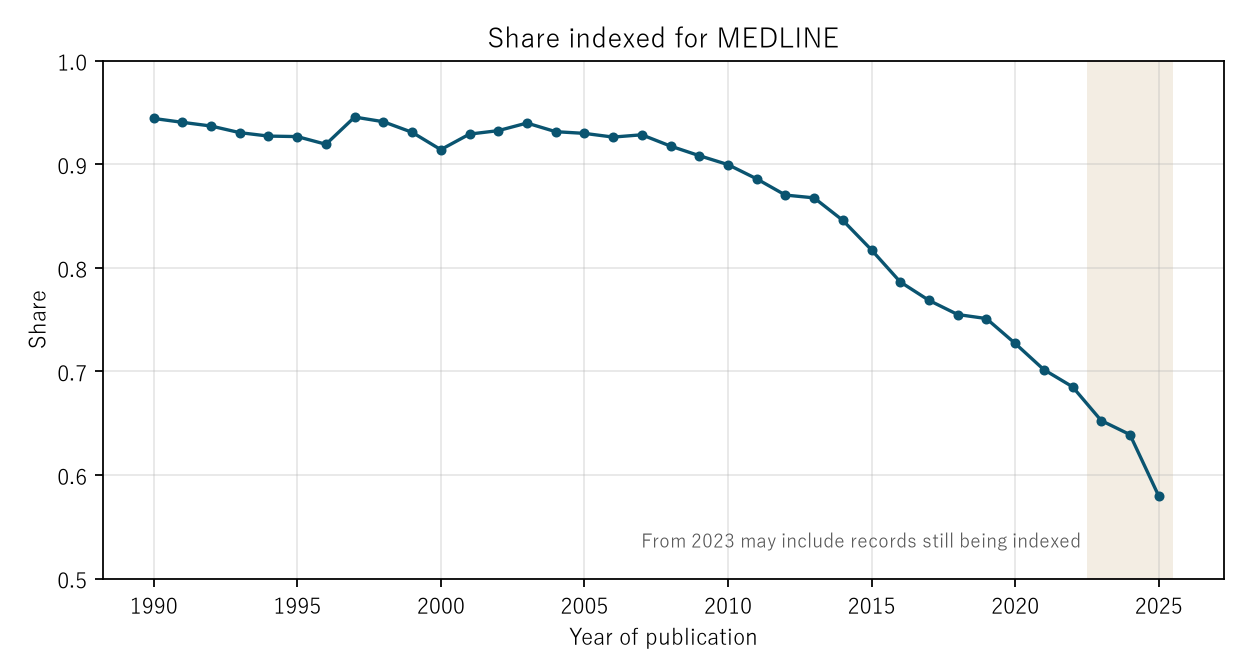
Figure 3: The MEDLINE share by year of publication. Years in the band (from 2023) may include records still being indexed.
6. The delay in registration is short
Calculation 6.1 Year in which records of publication year Y were entered (share of the records of that year, excerpt)
| Year of publication | Year before | Same year | Next year | Two or more years later |
|---|---|---|---|---|
| 2005 | 0.042 | 0.873 | 0.072 | 0.0127 |
| 2010 | 0.119 | 0.823 | 0.055 | 0.0010 |
| 2012 | 0.136 | 0.802 | 0.055 | 0.0035 |
| 2019 | 0.132 | 0.820 | 0.040 | 0.0011 |
| 2021 | 0.133 | 0.815 | 0.043 | 0.0009 |
| 2023 | 0.112 | 0.840 | 0.038 | 0.0005 |
| 2025 | 0.094 | 0.867 | — | — |
Observation 6.2: In every publication year, almost all records are entered within three years: the year before, the same year and the next year. The share entered two or more years later is at least 0.0008 and at most 0.0035 for 2010–2021.
Observation 6.3: The records for 2025 number 1,881,869, the most in the table, but the part entered in the year before and the same year totals 0.9615, and registration in the next year is still in progress. "The counting is not finished" applies to this newest year.
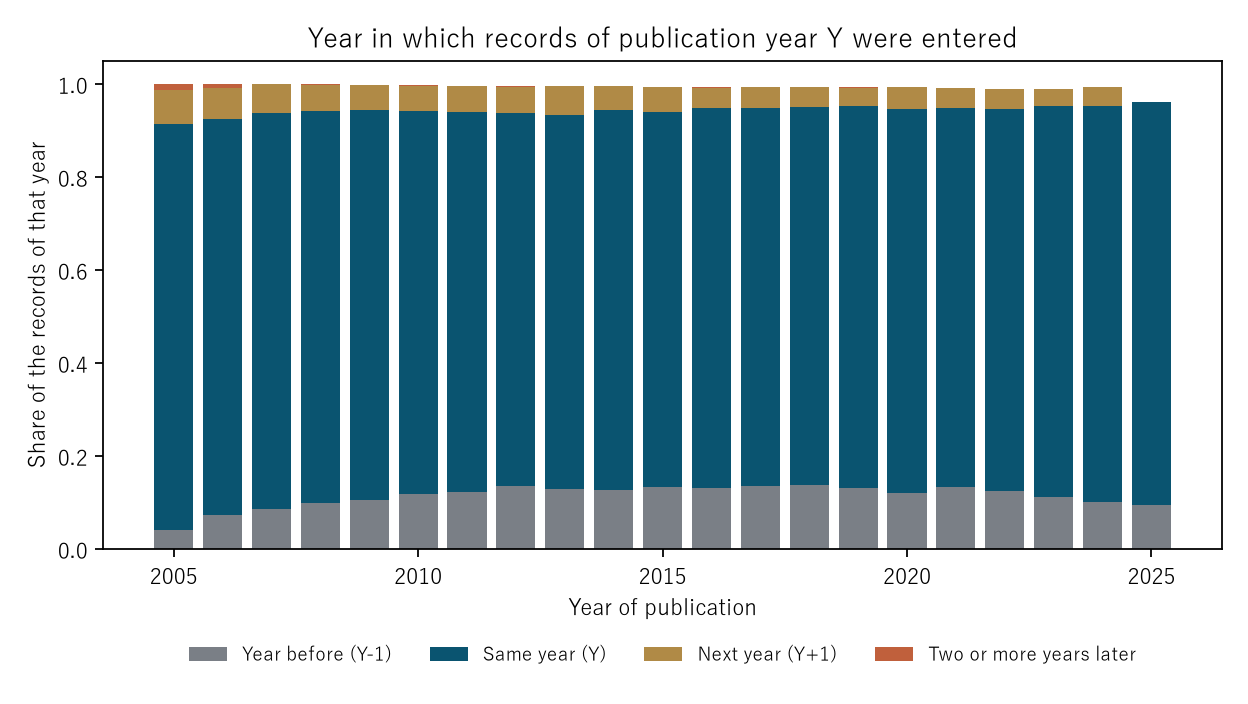
Figure 2: For each year of publication, the shares entered in the year before (grey), the same year (navy), the next year (gold) and two or more years later (vermilion) are stacked. The vermilion part is hardly visible.
7. The expectation of the preliminary survey failed: the fall of 2021→2023 cannot be filled by uncounted records
Calculation 7.1
| Value | |
|---|---|
| Records by year of publication, 2021 → 2023 | 1,787,579 → 1,697,623 |
| Share of the fall | 0.0503 |
| Increase needed to bring 2023 back to 2021 (relative to the current count) | 0.0530 |
| Largest observed share of registration two or more years late (2010–2021) | 0.0035 |
| Increase needed ÷ largest observed | 15.0 |
| Records by year of entry, 2021 → 2023 | 1,542,822 → 1,499,846 (a fall of 0.0279) |
Observation 7.2: Prediction A fails and Prediction B holds. For the 2023 records to return to the 2021 number, 15.0 times the largest late registration ever observed would be needed.
Observation 7.3: Counted by year of entry, 2021→2023 also fell. Regardless of how publication dates are assigned, the registered records themselves fell.
Observation 7.4: This paper does not state the cause of this fall. What was found is only that it is not "not counted yet".
8. Limitations
- The counts are as of retrieval and change daily. The numbers in this paper are those of 25 September 2026 and do not reflect the most current data of NLM.
- The delay in MEDLINE indexing is not measured. MEDLINE counts for recent years may lack records still being indexed. The core was built on years up to 2019.
- The kinds of records outside MEDLINE that grew are not separated (records still being indexed, preprints, records ahead of print, and so on).
- Only counts of search terms were taken. Duplicates of the same paper and differences in record type (articles, letters, corrections and so on) are not separated.
- No cause is stated. The rise of 2020–2021 and the fall of 2021→2023 lie outside this way of counting.
- Only PubMed is used. Other bibliographic databases are not included.
Conclusion
"Medical papers double about every 15 years" holds for 2010–2019 as well when all of PubMed is counted (16.5 years). But counting only records indexed for MEDLINE gives 35.5 years, a difference of more than a factor of two. Of the records added from 2010 to 2019, 0.543 came from outside MEDLINE. And the recent fall could not be filled by "not counted yet", as I had expected in the preliminary survey. Late registration is at most 0.0035, 15.0 times too small to fill the fall.
What separates them is one thing: whether what moved is the uncounted remainder or the range of what is counted.
The uncounted remainder exists only in the newest year, while the change in the range of what is counted has continued for more than ten years. Without saying what was counted, one cannot say how medical papers grow.
Data and reproduction
| Data | Counts taken with the E-utilities (esearch) of PubMed (U.S. National Library of Medicine), retrieved on 25 September 2026 from 21:06 to 21:13. Courtesy of the U.S. National Library of Medicine |
| Terms of use | NLM Terms and Conditions (free to use; the source must be stated; NLM's endorsement must not be implied; it must be stated that the data are not the most current) |
| Coverage | Years of publication 1950–2025, years of entry 1990–2025, counts only (no individual paper, author or journal was counted) |
| Computation | 検算/M004.py (--zu also writes the figures). Every number in the text is taken from 検算/M004_output.txt |
| Raw data | data/pubmed_counts_20260925.json (search terms, URLs, counts, times of retrieval), the retrieval tool data/fetch_pubmed.py, and data/SOURCES.md (terms of use, SHA-256, and the original wording of the search-term definitions). The computation checks the SHA-256 each time it runs |
| Figures | 図/M004_zu1, 図/M004_zu2, 図/M004_zu3 (png, svg, English versions) |
References
- U.S. National Library of Medicine. PubMed (E-utilities, esearch). Courtesy of the U.S. National Library of Medicine (retrieved 25 September 2026). https://eutils.ncbi.nlm.nih.gov/entrez/eutils/
- U.S. National Library of Medicine. PubMed User Guide (accessed 25 September 2026). https://pubmed.ncbi.nlm.nih.gov/help/
Reference
Yamagishi, Y. (2026). "Medical Papers Double About Every 15 Years" Has a Different Answer Depending on What Is Counted [M004]. Zenodo.
DOI: 10.5281/zenodo.22963542
YOI: https://www.yamagishiyuuki.com/yoi/M004
ORCID: 0009-0006-8587-3450
PDF (English) · PDF (Japanese) · Date proof of the English PDF (OpenTimestamps .ots) · SHA256SUMS
The record page for this paper (in Japanese, with the PDFs in each language and the date proof): YOI M004. This paper is a preprint and has not been peer reviewed.