Abstract
This paper asks whether the "5-year survival" of a cancer means the same thing for people who have already lived some years since diagnosis. The answer is no. Survival over "the next 5 years" among those who have lived 1, 2, … years since diagnosis rises more the more advanced the stage, and the gap between stages narrows. And because that shape can be produced either by each person's body changing or by those who die early leaving the group, aggregate numbers cannot decide between them. No new mathematical theorem and no new law are claimed.
First, the "5-year survival" usually quoted is survival for 5 years from the day of diagnosis. The hospital-based cancer registry tabulation of cases diagnosed in 2012 shows, for the same people, the observed survival over "the next 5 years" among those alive t years after diagnosis (t = 0–5), called survivor survival (conditional survival), for 10 sites × stages I–IV. This paper uses all 40 series (Sections 3 and 4).
Second, this is the core of the paper. At stage IV, for all 10 sites, survival over the next 5 years among those who have lived 5 years (t = 5) exceeds the 5-year survival at diagnosis (t = 0). The median difference is +42.2 points. For pancreatic cancer: stage I 44.0% → 68.7%, stage II 18.3% → 59.0%, stage III 4.7% → 50.1%, stage IV 1.3% → 42.5%; stomach cancer stage IV is 5.5% → 61.2% (Section 5).
Third, the gap between stages (the highest stage minus the lowest) is smaller at t = 5 for all 10 sites. The median gap goes from 55.5 points at t = 0 to 22.4 points at t = 5 (Section 5).
Fourth, 8 of the 40 series are lower at t = 5 (prostate cancer stages I–III −6.6 to −7.1 points, stomach cancer stage I −3.4 points, breast cancer stages I and II −2.4 and −1.8 points, and so on). All 8 are stages I–III. These values are observed survival and include deaths from causes other than cancer (Section 6).
Fifth, the rising shape can be produced by models of two different mechanisms. A "two-group" model in which no one's risk changes over time (the high-risk group simply leaves first) fits the 32 rising series with a median error of 0.63 points, and a "one-group" model in which everyone's risk falls over time fits with a median of 1.38 points. Since neither model lets anyone's risk rise, neither can produce the 8 falling series (Section 7).
Sixth, the numbers have spread. For stage IV pancreatic cancer, those alive at 5 years were 1.3% of the 6,242 people tabulated, about 81 people by approximation. The rough standard error of the t = 5 value is 5.5 points (this paper's approximation). Checking the t = 5 value of the figure against the 10-year survival of a separate table ÷ the t = 0 value, 29 of the 40 series fall within the rounding range; of the 11 outside, the excess is at most 2.0 points (intrahepatic bile duct cancer stage I), and within 0.3 points for the others (Section 3).
Scope of this paper (scope note): No new mathematical theorem and no new law are claimed. Survival by years lived since diagnosis (conditional survival, survivor survival) is a known idea, and every number of this paper is in the hospital-based cancer registry report. That in a population mixing people of different risks the high-risk leave first, so that the population's risk appears to fall over time, is also known from reliability research (Proschan 1963) and population research (Vaupel et al. 1979). This paper is a structural interpretation of the shape of numbers in public aggregate data; it is not medical advice, not a diagnosis, and not a treatment recommendation. The author is not a physician. Decisions about individual health should be discussed with a physician or a medical institution. This is a preprint that has not been peer reviewed. Not an individual outlook: survival is a tabulation of people diagnosed in a certain period, not a number that tells each reader their own future (the same as M003 showed for life expectancy). Not the numbers of today's treatment: these are numbers for people diagnosed in 2012, and later changes in treatment are not included. No facilities, regions or treatments are compared: this is a tabulation of the hospital-based cancer registries of designated cancer care hospitals and others, not a tabulation of the whole resident population. The report itself cautions that the treatment quality of facilities cannot be judged by simply comparing their survival. No cause is stated: which mechanism the rising shape comes from is not decided (Section 7 gives the reason). On the data: the numbers of the report are shown without alteration, and this paper's calculations (differences, gaps, approximate numbers of people, rough standard errors, models) are shown separately. All 10 sites × 4 stages × 6 time points of the special tabulation are used. Source: National Cancer Center Japan, Cancer Information Service. What is added is: setting t = 0 and t = 5 side by side for all 40 series and showing that stage IV rises for all 10 sites and that the gap between stages narrows for all 10 sites; showing that the 8 falling series are all stages I–III and that they cannot be produced by models in which no one's risk rises; showing by fitting that the rising shape can be produced by either of two different mechanisms, and stating that aggregate numbers cannot separate them; and checking the values of the figure against a separate table and writing down the size of the discrepancies.
1. Notation, and how to read these numbers
- 5-year survival (t = 0): the proportion alive 5 years after the day of diagnosis.
- Survivor survival (the next 5 years from year t): among those alive t years after diagnosis, the proportion alive a further 5 years later. t = 5 is "the next 5 years for those who have lived 5 years since diagnosis".
- Observed survival: survival counting deaths from any cause (including causes other than cancer). All numbers in this paper are observed survival.
- Stage (I–IV): the extent at diagnosis (overall stage of the UICC TNM classification). The larger the number, the more advanced.
Question: Is the "5-year survival" once heard the same number for people who have lived some years since diagnosis?
Observation 1.1: 5-year survival is a number for "people just diagnosed". Reading the same number one or two years later means reading a number that includes people who are no longer there. The same words "5-year survival" point to different groups depending on the years since diagnosis.
When reading these numbers: what is set out here is a tabulation of people diagnosed in 2012. It does not tell each reader their own future. Please discuss treatment and outlook with a physician or medical institution.
2. Preliminary survey and design
Stated honestly: the design of this paper was decided after seeing the values in the report's figures. It is not claimed that predictions were written before measuring.
| Content | |
|---|---|
| Data | Special tabulation "survivor survival" of the report on 10-year survival of the 2012 hospital-based cancer registry (1st printing, February 2025) (10 sites × stages I–IV × t = 0–5), and each site's "10-year survival by attribute" table and table of subjects |
| Extraction | The text of the report PDF (data labels of the figures) was read, and the 5 pages concerned were rendered as images to check by eye the order of all 40 series |
| Comparison | Difference between t = 0 and t = 5 (points), and the gap between stages for each site |
| Separator | Two models (two-group and one-group) fitted to each of the 40 series |
3. The data and their checks
Calculation 3.1 The report PDF, the extracted JSON and the extraction tool are fixed with SHA-256. The check computes only from the extracted JSON.
| What was checked | Result |
|---|---|
| Number of series | 10 sites × 4 stages = 40, each with 6 time points |
| Example in the report's text (colorectal cancer stage III: 68.0 → 68.7 → 70.9) | Agrees with the extracted values |
| Approximate number alive at 5 years (number tabulated × t = 0 value) | 20 or more for all 40 (minimum 23, intrahepatic bile duct cancer stage III) |
Calculation 3.2 Independent check: the t = 5 value (the next 5 years for those who have lived 5 years since diagnosis) should equal 10-year observed survival ÷ the t = 0 value. The 10-year observed survival was taken from a separate table ("10-year survival by attribute"), not from the figure.
| Result | |
|---|---|
| Series within the range allowing rounding to one decimal | 29/40 |
| Largest excess among the 11 outside the range | 2.0 points (intrahepatic bile duct cancer stage I) |
| Largest excess excluding intrahepatic bile duct cancer | 0.3 points |
| Example of a mix-up: series within the range when the t = 4 value is used instead of t = 5 | 7/40 |
Observation 3.3: At first I checked that "all 40 fall within the rounding range", and this failed. For the 11 outside, the differences are 1.9–2.2 points for intrahepatic bile duct cancer (excess at most 2.0 points) and within 0.3 points of excess for the others. The details of calculation for the figure and the table (handling of censoring, the range of subjects, and so on) need not be the same, but this paper did not check the cause. A mix-up would miss by much more (with the t = 4 values only 7 fall within the range), so the extracted order was judged correct. This paper uses the values of the figure as they are.
4. Measurement: the 40 series at diagnosis and 5 years later
Calculation 4.1 5-year survival at diagnosis (t = 0) and the next 5 years for those who have lived 5 years (t = 5) (%, report values). The difference, approximate number alive at 5 years and rough standard error are this paper's calculations.
| Site | Stage | t = 0 | t = 5 | Difference (points) | Tabulated | Approx. alive at 5 years | Rough SE (points) |
|---|---|---|---|---|---|---|---|
| Stomach | I | 82.1 | 78.7 | -3.4 | 34,744 | 28525 | 0.2 |
| Stomach | II | 59.6 | 73.9 | +14.3 | 5,255 | 3132 | 0.8 |
| Stomach | III | 36.5 | 69.1 | +32.6 | 5,953 | 2173 | 1.0 |
| Stomach | IV | 5.5 | 61.2 | +55.7 | 9,312 | 512 | 2.2 |
| Colorectum | I | 82.4 | 80.6 | -1.8 | 12,816 | 10560 | 0.4 |
| Colorectum | II | 75.7 | 76.6 | +0.9 | 13,264 | 10041 | 0.4 |
| Colorectum | III | 68.0 | 77.3 | +9.3 | 12,559 | 8540 | 0.5 |
| Colorectum | IV | 17.0 | 60.2 | +43.2 | 9,701 | 1649 | 1.2 |
| Hepatocellular | I | 55.7 | 55.4 | -0.3 | 6,413 | 3572 | 0.8 |
| Hepatocellular | II | 38.3 | 48.3 | +10.0 | 4,423 | 1694 | 1.2 |
| Hepatocellular | III | 13.2 | 44.4 | +31.2 | 2,417 | 319 | 2.8 |
| Hepatocellular | IV | 3.5 | 46.9 | +43.4 | 1,078 | 38 | 8.1 |
| Intrahepatic bile duct | I | 46.1 | 64.9 | +18.8 | 241 | 111 | 4.5 |
| Intrahepatic bile duct | II | 28.2 | 66.8 | +38.6 | 376 | 106 | 4.6 |
| Intrahepatic bile duct | III | 19.8 | 65.2 | +45.4 | 116 | 23 | 9.9 |
| Intrahepatic bile duct | IV | 5.1 | 54.8 | +49.7 | 1,120 | 57 | 6.6 |
| Small cell lung | I | 40.3 | 50.7 | +10.4 | 293 | 118 | 4.6 |
| Small cell lung | II | 21.4 | 62.7 | +41.3 | 279 | 60 | 6.3 |
| Small cell lung | III | 15.6 | 61.8 | +46.2 | 1,260 | 197 | 3.5 |
| Small cell lung | IV | 1.9 | 38.3 | +36.4 | 2,508 | 48 | 7.0 |
| Non-small cell lung | I | 73.0 | 75.5 | +2.5 | 17,461 | 12747 | 0.4 |
| Non-small cell lung | II | 44.9 | 61.0 | +16.1 | 4,031 | 1810 | 1.1 |
| Non-small cell lung | III | 24.1 | 56.7 | +32.6 | 7,685 | 1852 | 1.2 |
| Non-small cell lung | IV | 6.4 | 39.8 | +33.4 | 13,703 | 877 | 1.7 |
| Breast | I | 95.0 | 92.6 | -2.4 | 15,215 | 14454 | 0.2 |
| Breast | II | 90.6 | 88.8 | -1.8 | 12,310 | 11153 | 0.3 |
| Breast | III | 76.3 | 78.9 | +2.6 | 3,988 | 3043 | 0.7 |
| Breast | IV | 36.3 | 44.5 | +8.2 | 1,916 | 696 | 1.9 |
| Oesophagus | I | 69.2 | 71.8 | +2.6 | 4,581 | 3170 | 0.8 |
| Oesophagus | II | 44.2 | 66.6 | +22.4 | 1,554 | 687 | 1.8 |
| Oesophagus | III | 24.0 | 62.1 | +38.1 | 3,677 | 882 | 1.6 |
| Oesophagus | IV | 8.0 | 59.1 | +51.1 | 2,026 | 162 | 3.9 |
| Pancreas | I | 44.0 | 68.7 | +24.7 | 825 | 363 | 2.4 |
| Pancreas | II | 18.3 | 59.0 | +40.7 | 3,657 | 669 | 1.9 |
| Pancreas | III | 4.7 | 50.1 | +45.4 | 2,034 | 96 | 5.1 |
| Pancreas | IV | 1.3 | 42.5 | +41.2 | 6,242 | 81 | 5.5 |
| Prostate | I | 89.3 | 82.4 | -6.9 | 12,890 | 11511 | 0.4 |
| Prostate | II | 91.1 | 84.0 | -7.1 | 9,706 | 8842 | 0.4 |
| Prostate | III | 86.1 | 79.5 | -6.6 | 4,889 | 4209 | 0.6 |
| Prostate | IV | 49.6 | 56.2 | +6.6 | 4,721 | 2342 | 1.0 |
Observation 4.2: "Approximate number alive at 5 years" is only a rough figure, the number tabulated multiplied by the t = 0 value, and does not consider censoring (people whose vital status became unknown). "Rough standard error" is an approximation from that number and the t = 5 value using the binomial distribution. For series with few people (approximately 23 for intrahepatic bile duct cancer stage III, 38 for hepatocellular carcinoma stage IV, and so on), the t = 5 value can move by several to about 10 points.
5. The core: the more advanced the stage, the more "the next 5 years" rises, and the gap between stages narrows
Calculation 5.1 t = 5 − t = 0 by stage
| Stage | Sites where t = 5 exceeds t = 0 | Median difference | Minimum | Maximum |
|---|---|---|---|---|
| I | 5/10 | +1.1 points | -6.9 | +24.7 |
| II | 8/10 | +15.2 points | -7.1 | +41.3 |
| III | 9/10 | +32.6 points | -6.6 | +46.2 |
| IV | 10/10 | +42.2 points | +6.6 | +55.7 |
Observation 5.2: At stage IV, for all 10 sites, the next 5 years for those who have lived 5 years exceeds the 5-year survival at diagnosis. The rise is larger the more advanced the stage (median difference +1.1 points at stage I, +42.2 points at stage IV).
Calculation 5.3 Gap between stages for each site (highest stage − lowest stage)
| Site | Gap at t = 0 | Gap at t = 5 | t = 5 ÷ t = 0 |
|---|---|---|---|
| Stomach | 76.6 | 17.5 | 0.23 |
| Colorectum | 65.4 | 20.4 | 0.31 |
| Hepatocellular | 52.2 | 11.0 | 0.21 |
| Intrahepatic bile duct | 41.0 | 12.0 | 0.29 |
| Small cell lung | 38.4 | 24.4 | 0.64 |
| Non-small cell lung | 66.6 | 35.7 | 0.54 |
| Breast | 58.7 | 48.1 | 0.82 |
| Oesophagus | 61.2 | 12.7 | 0.21 |
| Pancreas | 42.7 | 26.2 | 0.61 |
| Prostate | 41.5 | 27.8 | 0.67 |
Observation 5.4: The gap between stages is smaller at t = 5 for all 10 sites. The median gap goes from 55.5 points at t = 0 to 22.4 points at t = 5. Stages that were far apart at diagnosis come closer in "the next 5 years" among people who have lived 5 years. Only for breast cancer does the gap shrink little (0.82). The report surmises that for breast cancer survivor 5-year survival is nearly flat at every stage, reflecting subtypes that need long treatment and follow-up (the report's surmise; this paper did not check it).
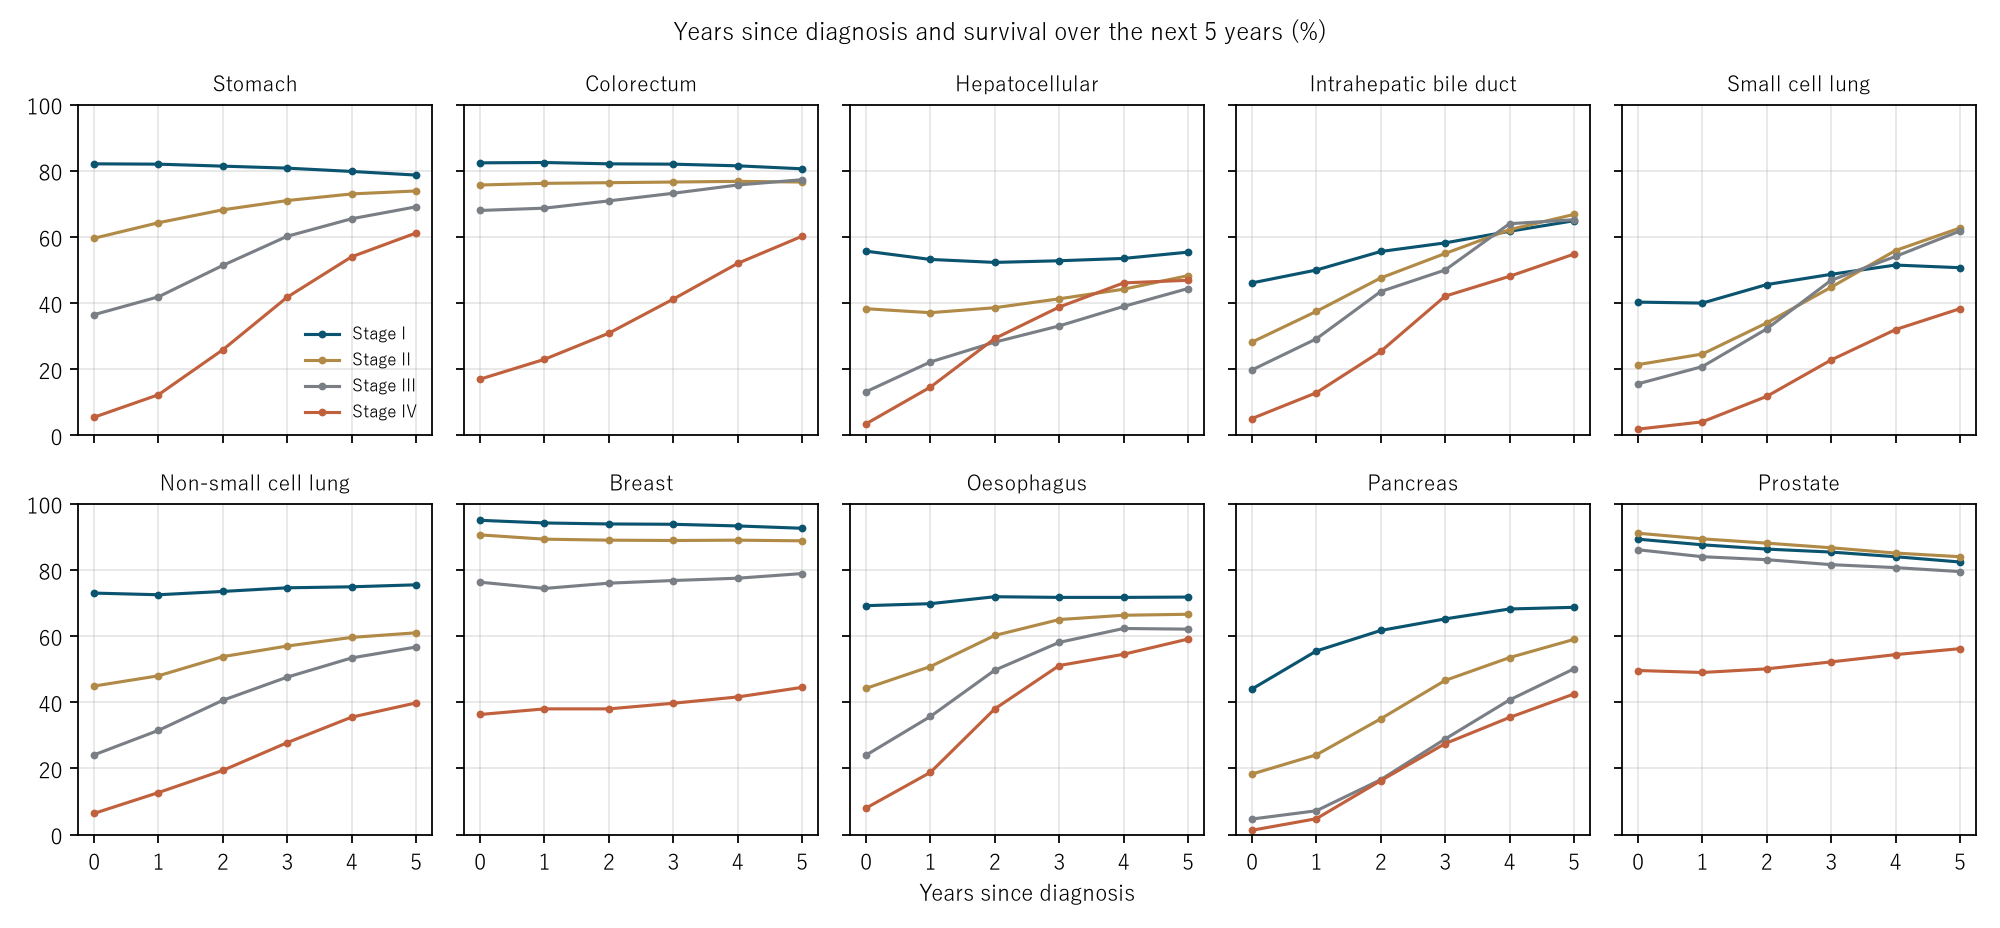
Figure 1: For each of the 10 sites, survival over "the next 5 years" for stages I (navy), II (gold), III (grey) and IV (vermilion), plotted against years since diagnosis (0–5). The vermilion line of stage IV rises to the right for every site.
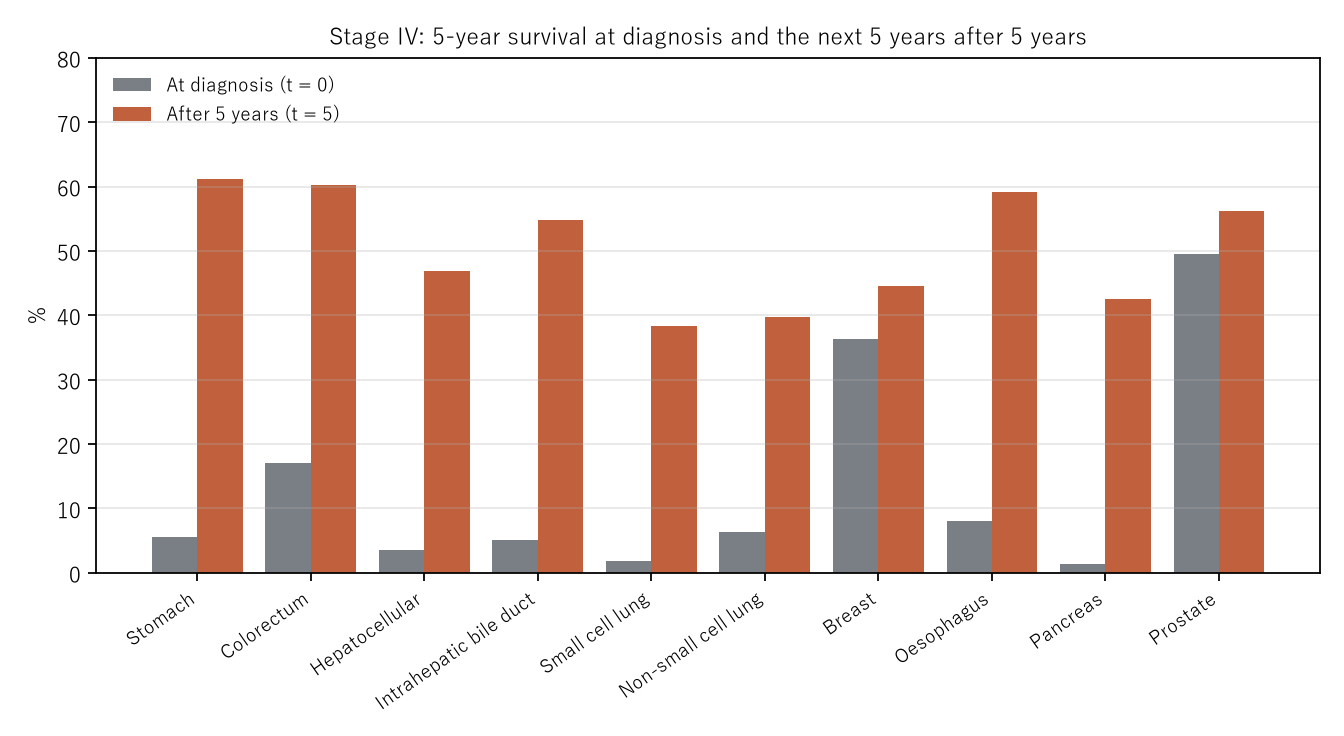
Figure 2: For the 10 sites at stage IV, grey is at diagnosis (t = 0) and vermilion is for those who have lived 5 years (t = 5).
6. The 8 falling series: observed survival includes deaths other than cancer
Observation 6.1: The series lower at t = 5 than at t = 0 are 8: stomach cancer stage I (-3.4), colorectal cancer stage I (-1.8), hepatocellular carcinoma stage I (-0.3), breast cancer stage I (-2.4), breast cancer stage II (-1.8), prostate cancer stage I (-6.9), prostate cancer stage II (-7.1) and prostate cancer stage III (-6.6). All 8 are stages I–III; none is stage IV.
Observation 6.2: The numbers of this paper are observed survival and include deaths from causes other than cancer. Five years after diagnosis, those people are five years older. If a risk of death that rises with age is included, "the next 5 years" can fall. But this paper did not check that the fall comes from deaths other than cancer (conditional values of net survival are not in the report).
Observation 6.3: What can be said for certain is this. Both models of Section 7 are forms in which no one's risk rises over time. For all 40 fitted models, "the next 5 years" did not fall over time (checked in the verification). To produce a falling shape, a mechanism is needed in which at least some people's risk rises over time.
7. The separator: a change in each person's body, or a change in who remains
A rising "next 5 years" can happen in either of two ways.
- Model A (a change in who remains): a high-risk group and a low-risk group are mixed. Neither group's risk changes over time. Because the high-risk group dies first and leaves, the "next 5 years" of the remaining group rises (the shape shown by Proschan 1963 and Vaupel et al. 1979).
- Model B (each person's risk falls): everyone is the same, and each person's risk falls over time.
Calculation 7.1 The two models fitted by least squares to the 6 values of each of the 40 series (this paper's calculation). The error is RMS (points).
| Model A (two groups) | Model B (one group, falling) | |
|---|---|---|
| 32 rising series: median and maximum error | 0.63, 1.88 | 1.38, 4.71 |
| 8 falling series: median and maximum error | 1.25, 2.43 | 1.25, 2.43 |
| All 40: median and maximum error | 0.76, 2.43 | 1.35, 4.71 |
Calculation 7.2 Pancreatic cancer stage IV (report values 1.3, 4.8, 16.3, 27.5, 35.4, 42.5)
| t = 0 | 1 | 2 | 3 | 4 | 5 | |
|---|---|---|---|---|---|---|
| Report | 1.3 | 4.8 | 16.3 | 27.5 | 35.4 | 42.5 |
| Model A | 2.1 | 6.0 | 14.9 | 27.4 | 37.0 | 41.4 |
| Model B | 3.4 | 7.9 | 15.0 | 24.2 | 34.6 | 45.2 |
In the fit of Model A, the high-risk group is 0.954, its yearly force of death 1.348, and that of the low-risk group 0.165. In Model B, the initial force of death is 1.283 and the speed at which it falls 0.290.
Observation 7.3: Even Model A, in which no one's risk changes, produces the 32 rising series with a median error of 0.63 points. Model B, in which everyone's risk falls, produces them with a median of 1.38 points. The difference in fit also depends on the forms of model this paper chose. Therefore, from the rise of "the next 5 years" alone, it cannot be decided whether each person's body improved or the membership of the group changed as those who die early left.
Observation 7.4: For the 8 falling series, the two models give the same error (median 1.25 points). Since neither model lets anyone's risk rise, both end up at a constant risk and cannot produce a falling shape.
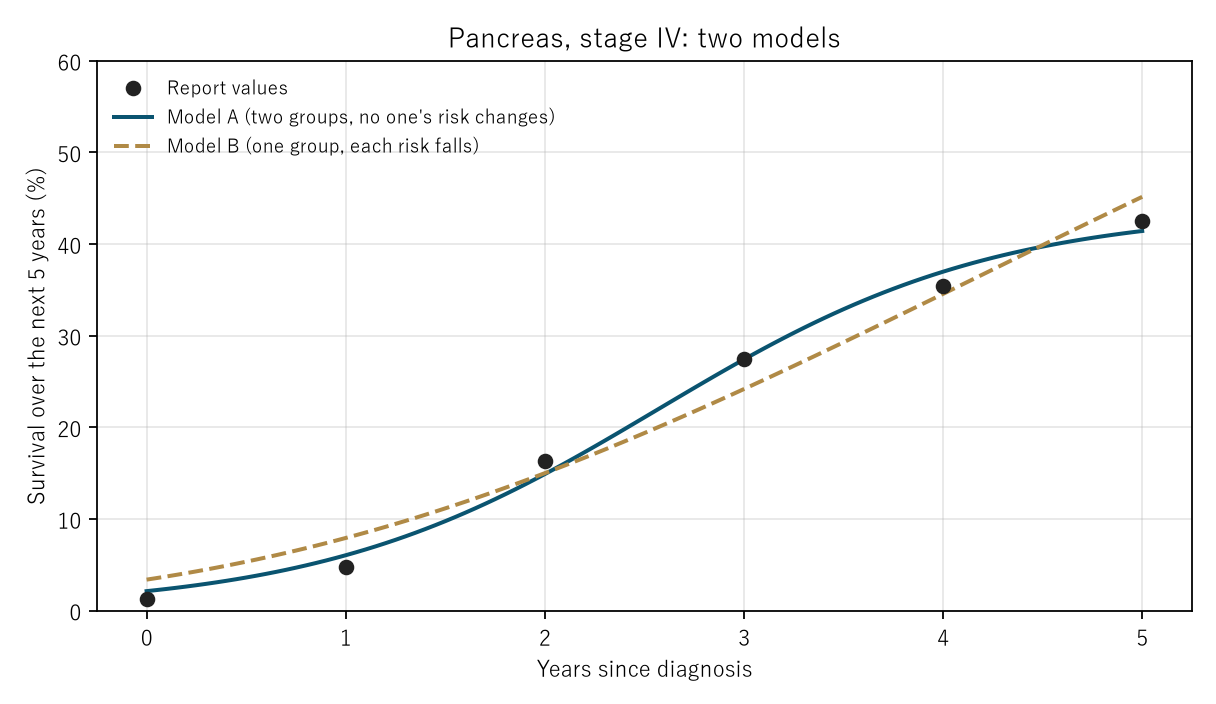
Figure 3: Black dots are the report values, the navy line is Model A (two groups, no one's risk changes), and the gold dashed line is Model B (one group, each person's risk falls). The two lines come from different mechanisms, yet both pass near the dots.
8. Limitations
- Not an individual outlook. The tabulation is of people diagnosed in 2012 and does not tell each reader their own future.
- Not the numbers of today's treatment. Changes in treatment after 2012 are not included.
- A tabulation of hospital-based cancer registries. It covers people who attended designated cancer care hospitals and others, not the whole resident population.
- Observed survival. Deaths other than cancer are included. Conditional values of net survival are not in the report, and this paper did not compute them.
- The figure values are rounded to one decimal. In the check against a separate table, 11 of the 40 series fell outside the rounding range (excess at most 2.0 points). The cause was not checked.
- The approximate numbers of people and the rough standard errors are this paper's approximations. Censoring is not considered. The report does not give confidence intervals for the conditional values.
- Only two forms of model were tried. With other forms the fit may change. What this paper says is only "it can be produced by either of two different mechanisms".
- No facilities, regions or treatments are compared.
Conclusion
The 5-year survival on the day of diagnosis is no longer the same number for people who have lived some years since diagnosis. At stage IV, for all 10 sites, survival over the next 5 years among those who have lived 5 years exceeded the 5-year survival at diagnosis (pancreatic cancer 1.3% → 42.5%, stomach cancer 5.5% → 61.2%). The gap between stages narrowed for all 10 sites, with the median going from 55.5 points to 22.4 points. At early stages, 8 series fell slightly, a shape that models in which no one's risk rises cannot produce.
What separates them is one thing: whether what moved is each person's body or the membership of the group. And aggregate numbers do not separate them.
Even if no one's risk changes, "the next 5 years" rises as those who die early leave. It also rises if each person's risk falls. What the numbers teach is only this: a survival figure heard once had better not be carried unchanged for years.
Data and reproduction
| Data | Report on 10-year survival of the 2012 hospital-based cancer registry (1st printing February 2025, Center for Cancer Registries, Institute for Cancer Control, National Cancer Center Japan). Source: National Cancer Center Japan, Cancer Information Service (retrieved 25 September 2026) |
| Terms of use | Cancer Information Service "Copyright" (state the source, do not alter, do not use in part in a way that leads to misunderstanding). The report's numbers are shown without alteration and kept separate from this paper's calculations |
| Scope | Special tabulation "survivor survival" 10 sites × stages I–IV × 6 time points (all), and 10-year survival and number tabulated for each site |
| Check | 検算/M006.py (--zu also writes the figures). Every number in the text is taken from 検算/M006_output.txt |
| Raw data | data/hosp_c_reg_surv_10_2012.pdf (the report as retrieved), the extraction tool data/extract_survivor.py, the extracted values data/survivor_2012.json, data/SOURCES.md (original text of the terms of use, SHA-256), and images of the pages checked by eye data/確認用/報告書_p68〜72.png |
| Figures | 図/M006_zu1, 図/M006_zu2, 図/M006_zu3 (png, svg, English versions) |
References
- National Cancer Center Japan, Institute for Cancer Control, Center for Cancer Registries (2025). Report on 10-year survival of the 2012 hospital-based cancer registry (in Japanese). Source: National Cancer Center Japan, Cancer Information Service (accessed 25 September 2026). https://ganjoho.jp/public/qa_links/report/hosp_c/hosp_c_reg_surv/pdf/hosp_c_reg_surv_10_2012.pdf
- Proschan, F. (1963). Theoretical Explanation of Observed Decreasing Failure Rate. Technometrics. 10.1080/00401706.1963.10490105
- Vaupel, J. W., Manton, K. G., & Stallard, E. (1979). The Impact of Heterogeneity in Individual Frailty on the Dynamics of Mortality. Demography. 10.2307/2061224
- Yamagishi, Y. (2026). Life Expectancy Is Not the Number of Years Anyone Actually Lives [M003]. Zenodo. https://doi.org/10.5281/zenodo.22963485
Reference
Yamagishi, Y. (2026). The "5-Year Survival" You Once Heard Is Rewritten by the Years You Have Lived [M006]. Zenodo.
DOI: 10.5281/zenodo.22964113
YOI: https://www.yamagishiyuuki.com/yoi/M006
ORCID: 0009-0006-8587-3450
PDF (English) · PDF (Japanese) · Date proof of the English PDF (OpenTimestamps .ots) · SHA256SUMS
The record page for this paper (in Japanese, with the PDFs in each language and the date proof): YOI M006. This paper is a preprint and has not been peer reviewed.