Abstract
This paper asks which number a published "5-year survival" refers to — the answer is that there are at least three: observed survival, which counts deaths from any cause; net survival, which assumes a setting in which cancer is the only cause of death; and relative survival, which divides by the survival of the general population. For the same patients, observed and net survival differ by a few points to more than ten points, and the gap widens greatly at older ages, where deaths from causes other than cancer are common. No new mathematical theorem or new law is claimed.
First, the hospital-based cancer registry report on 5-year survival for patients diagnosed in 2014–2015 lists observed survival and net survival side by side for the same patients. For all cancers combined, observed survival is 60.3% and net survival is 66.2% (a gap of 5.9 points). The population-based National Cancer Registry (cases diagnosed in 2016–2018) publishes relative survival (Section 3).
Second, this is the core of the paper. The gap between the two numbers for the same patients (net minus observed) has a median of 4.3 points across 23 sites; it is largest for prostate cancer at 11.8 points (observed 83.3%, net 95.1%), smallest for anaplastic thyroid cancer at 0.3 points, and 0.9 points for pancreatic cancer. Dividing the gap by the amount lost in observed survival (100 minus observed) gives 0.707 for prostate cancer and 0.010 for pancreatic cancer (Section 4).
Third, the gap widens with age. For all cancers combined, it grows at every step of the age groups: from 0.1 points at ages 0–14 to 0.2 at 15–39, 0.5 in the 40s, 1.2 in the 50s, 3.0 in the 60s, 6.7 in the 70s, and 13.9 at 80 and over. In all 21 sites for which the age groups are available, the gap is largest at 80 and over (Section 5).
Fourth, both numbers that "look only at the effect of cancer" reach the ceiling of 100. Net survival for stage I and stage II prostate cancer is 100.0 (the 95% interval is also 100.0 to 100.0), while observed survival for the same patients is 89.6% and 91.1%. In the population-based relative survival, prostate "localized" is the only value in the file stored as the integer 100. The report gives the fact that relative survival can theoretically reach 100% or more for cancers with high survival as one of its reasons for switching to net survival (Section 6).
Fifth, three numbers stand under the same disease name. For the 13 sites with a one-to-one correspondence, the range of the three numbers — hospital-based observed, hospital-based net, and population-based relative — has a median of 6.0 points and a maximum of 12.5 points (bladder cancer). Hospital-based observed survival is the smallest of the three in 12 sites; the exception is ovarian cancer in women (population-based relative 59.9% is lower than hospital-based observed 63.1%). Population-based relative minus hospital-based net ranges from −4.6 to +4.0 points; these are numbers from different populations and different years of diagnosis (Section 7).
Sixth, for pancreatic cancer the three numbers are close (hospital-based observed 11.8%, net 12.7%, population-based relative 13.2%). For prostate cancer they are far apart (83.3%, 95.1%, 95.7%). The mean ages are nearly the same (71.1 and 71.7 years). Which "5-year survival" is meant makes a large difference for cancers in which age is high and net survival is also high.
Scope note: No new mathematical theorem or new law is claimed — the definitions of observed survival, relative survival, and net survival (Pohar-Perme method), and the differences among them, are known and are explained by the report itself. This paper only lays out published numbers and measures the size and shape of their gaps (by site, by age, and at the ceiling). It does not recalculate any survival rate. This paper is a structural interpretation describing the shape of numbers in public aggregate data; it is not medical advice, diagnosis, or a treatment recommendation. The author is not a physician. For decisions about individual health, consult a physician or medical institution. It is a preprint that has not been peer reviewed. It is not one person's outlook — every survival rate is a summary of people diagnosed in a certain period (as in M003 and M006). It does not say which survival rate is correct — the three answer different questions and are used according to the purpose. It does not treat the hospital-based and population-based numbers as "three numbers for the same patients" — the hospital-based cancer registry (diagnosed 2014–2015, designated cancer hospitals and others) and the National Cancer Registry (diagnosed 2018, the whole population) differ in both population and year. It does not compare facilities, regions, or treatments. About the data: the numbers in the report and the tables are shown without alteration and are kept separate from this paper's calculations (gaps, ratios, ranges). Three cells that are subject to the correction notice, for which it is unclear whether the correction has been applied to the main document, are not used. Source: National Cancer Center Japan, Cancer Information Service. What this paper adds is laying out the gap between observed and net survival for the same patients across 23 sites and across age groups, and showing that the gap widens regularly with age (largest at 80 and over in all 21 sites); showing, down to the table and to the type of the value in the file, that there are places where both net and relative survival stop at the ceiling of 100; and measuring the range of the three numbers that stand under the same disease name.
1. Notation and question
Following the report's definitions (summarized from the original):
- Observed survival: survival that counts all deaths regardless of cause (the proportion of patients alive 5 years after diagnosis).
- Relative survival: observed survival divided by the "survival if they had not had cancer" (expected survival) of the general population of the same sex, age, and year of diagnosis.
- Net survival: survival calculated by assuming "a setting in which cancer is the only cause of death", without computing expected survival (Pohar-Perme method).
- There is also cause-specific survival (which treats deaths from causes other than cancer as censored). It is not in this paper's data.
Question: Which number does a published "5-year survival" refer to? How much does it differ for the same patients?
Observation 1.1: The three numbers differ only in how people who died of causes other than cancer are treated. Observed survival counts them. Relative survival divides by the deaths of the general population. Net survival assumes a world in which cancer is the only cause of death. One phrase refers to three different treatments.
2. Preliminary look and design
Stated honestly: the design of this paper was decided after looking at the values in the report and the tables.
| Content | |
|---|---|
| A | Hospital-based cancer registry, 5-year survival for 2014–2015 (March 2023): the overall columns (observed, net, 95% interval) of the "5-year survival by attribute" table for each site; rows are overall, age groups, and stages I–IV. 24 tables (all cancers + 23 sites) |
| B | Tables of 5-year relative survival for cases diagnosed in 2016–2018 in the National Cancer Registry: by site for cases diagnosed in 2018 (both sexes and by sex) and by stage at diagnosis (localized, regional, distant) |
| Comparisons | The gap within A (net minus observed), the ceiling rows, and the three numbers under the same disease name in A and B (only the 13 sites with a one-to-one correspondence) |
3. Data and their verification
Calculation 3.1 The report PDF, the correction notice, the tables, the extracted JSON, and the extraction tool were fixed by SHA-256.
| What was checked | Result |
|---|---|
| Number of tables in A and sites in B | A 24 tables (all cancers + 23 sites); B 26 by site and 22 by stage |
| Whether each value used from A (net in the overall column) lies within its own 95% interval | All lie within (the extraction stops otherwise) |
| Rows in A where net is smaller than observed | None |
| Cells not used because they are subject to the correction and it is unclear whether the correction was applied | Net for hepatocellular carcinoma in the 60s, observed for non-small cell lung cancer in the 70s, observed for papillary/follicular thyroid cancer in the 40s |
Observation 3.2: The correction notice (as of 3 July 2024) states "where it was corrected" but does not give the corrected values. Five dates appear in the correction notice, and only 3 July 2024 is later than the main PDF (created 27 June 2024, last updated 28 June 2024). Of the corrections with that date, the three cells that fall in the overall columns used here are not used, because it is unclear whether they have been applied to the main document. The remaining four dates (April to October 2023) are earlier than the creation of the main PDF, so those corrections are treated as included in it (this was not checked one by one). In addition, the male columns of the tables contain a row in which the net value lies outside its own 95% interval (all cancers, men, 80 and over). This paper uses only the overall columns.
Observation 3.3: For all cancers combined overall, there are 942,717 patients in the analysis, the mean age is 68.3 years, observed survival is 60.3%, and net survival is 66.2% (a gap of 5.9 points).
4. Core — for the same patients, the two numbers differ by a few points to more than ten points depending on the site
Calculation 4.1 Observed and net survival by site (A, overall row, in order of gap)
| Site | Observed | Net | Gap (points) | Gap ÷ (100 − observed) | Mean age | Patients |
|---|---|---|---|---|---|---|
| Prostate | 83.3 | 95.1 | 11.8 | 0.707 | 71.7 | 78,332 |
| Larynx | 69.3 | 78.4 | 9.1 | 0.296 | 70.6 | 7,354 |
| Bladder | 54.1 | 62.6 | 8.5 | 0.185 | 74.0 | 18,108 |
| Stomach | 62.3 | 70.2 | 7.9 | 0.210 | 71.3 | 126,675 |
| Colon | 62.9 | 70.7 | 7.8 | 0.210 | 71.3 | 76,813 |
| Colorectum | 63.8 | 70.9 | 7.1 | 0.196 | 70.1 | 116,826 |
| Kidney | 75.1 | 81.6 | 6.5 | 0.261 | 66.2 | 19,960 |
| Rectum | 65.3 | 71.3 | 6.0 | 0.173 | 67.7 | 40,013 |
| Renal pelvis and ureter | 38.7 | 44.2 | 5.5 | 0.090 | 74.4 | 7,948 |
| Hepatocellular carcinoma | 40.3 | 45.1 | 4.8 | 0.080 | 71.9 | 30,699 |
| Esophagus | 43.4 | 47.8 | 4.4 | 0.078 | 69.4 | 29,513 |
| Non-small cell lung | 43.2 | 47.5 | 4.3 | 0.076 | 71.1 | 106,783 |
| Thyroid, papillary/follicular | 92.7 | 96.4 | 3.7 | 0.507 | 57.9 | 15,078 |
| Breast (women) | 88.1 | 91.6 | 3.5 | 0.294 | 60.3 | 85,403 |
| Thyroid, medullary | 90.1 | 93.2 | 3.1 | 0.313 | 55.9 | 130 |
| Gallbladder | 24.1 | 27.2 | 3.1 | 0.041 | 74.2 | 6,591 |
| Corpus uteri | 80.6 | 83.0 | 2.4 | 0.124 | 60.2 | 18,312 |
| Intrahepatic bile duct | 19.2 | 21.1 | 1.9 | 0.024 | 71.0 | 4,286 |
| Cervix uteri | 72.7 | 74.4 | 1.7 | 0.062 | 54.7 | 14,454 |
| Ovary (women) | 63.1 | 64.5 | 1.4 | 0.038 | 58.0 | 11,683 |
| Small cell lung | 10.6 | 11.5 | 0.9 | 0.010 | 71.0 | 9,937 |
| Pancreas | 11.8 | 12.7 | 0.9 | 0.010 | 71.1 | 33,557 |
| Thyroid, anaplastic | 6.0 | 6.3 | 0.3 | 0.003 | 73.6 | 321 |
Observation 4.2: Even for the same patients, the gap between the two numbers ranges from 0.3 to 11.8 points by site. The median is 4.3 points.
Observation 4.3: "Gap ÷ (100 − observed)" is the share of what observed survival loses over 5 years that does not appear as a loss in net survival (this paper's calculation; a rough guide). For prostate cancer it is 0.707: seven tenths of what is lost in observed survival does not appear in net survival. For pancreatic cancer and small cell lung cancer it is 0.010: almost all of what is lost in observed survival also appears in net survival.
Observation 4.4: Across the 23 sites, the correlation of the gap with mean age is 0.350, and with observed survival 0.445 (a rough guide that also depends on how sites are counted). Age alone does not determine the gap. Prostate cancer (71.7 years) and pancreatic cancer (71.1 years) have nearly the same mean age, and their gaps are 11.8 and 0.9 points. For pancreatic, small cell lung, and anaplastic thyroid cancer, where net survival is low (many people die within 5 years even in a world where cancer is the only cause of death), the gap does not reach 1 point even though the mean age is above 70.
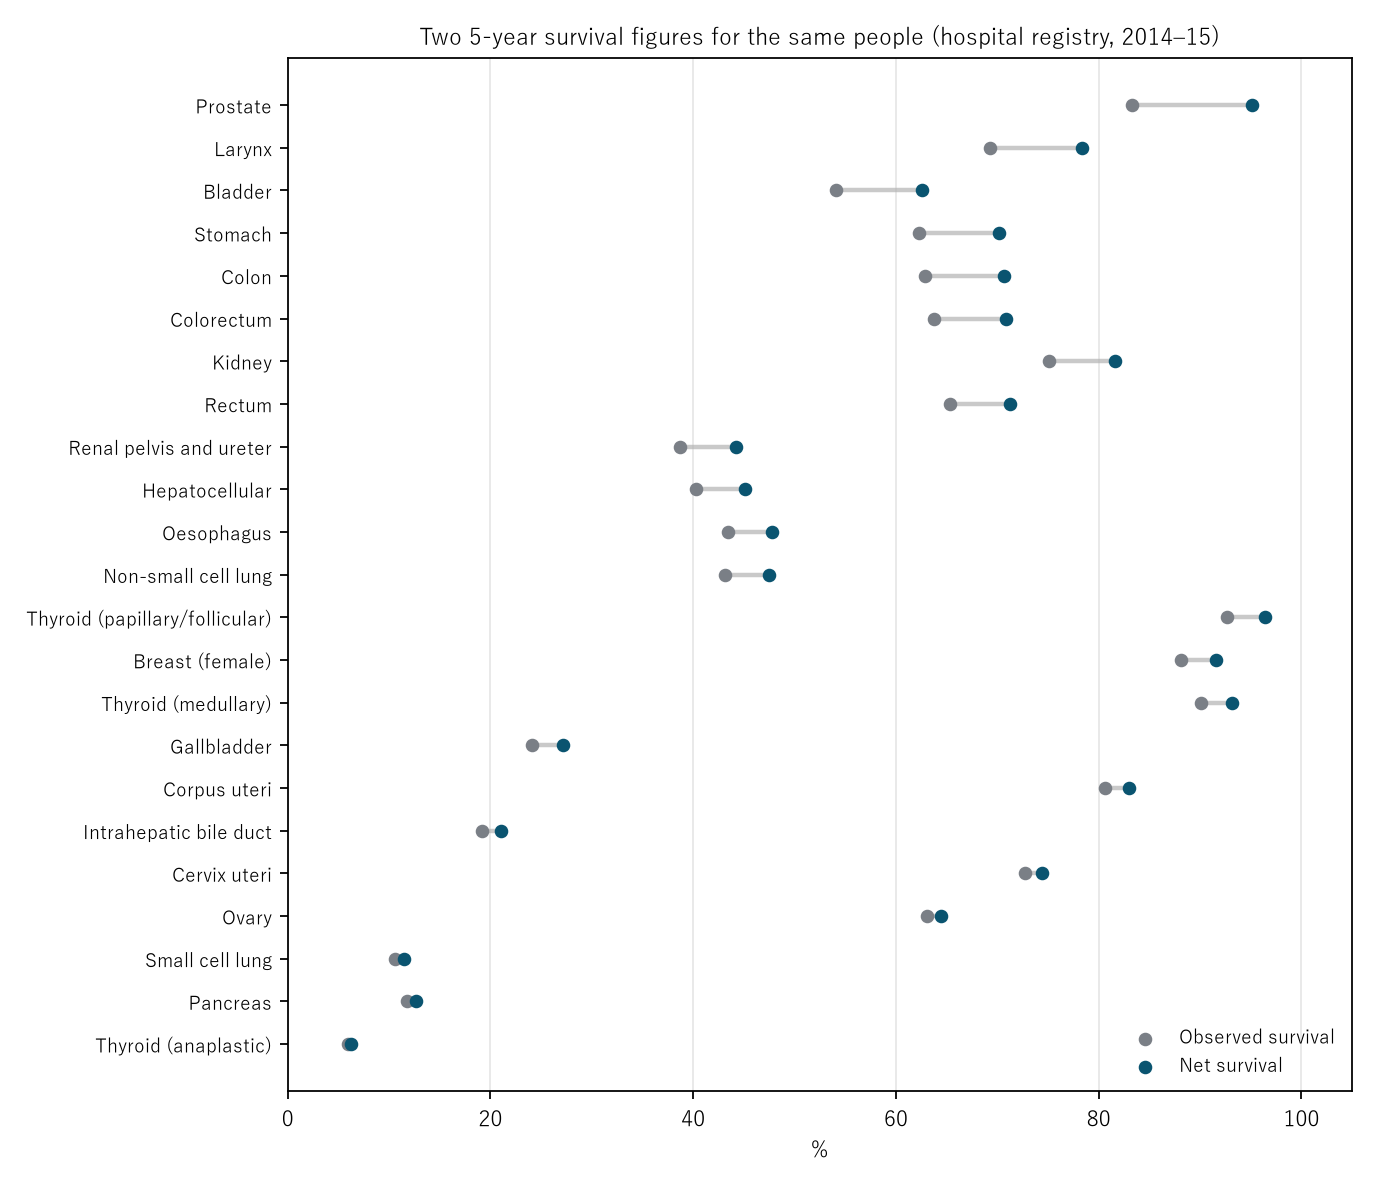
Figure 1: For each site, grey is observed survival and navy is net survival. Sites higher up have larger gaps.
5. The gap widens with age
Calculation 5.1 The two numbers by age group for all cancers combined (A)
| Age group | Observed | Net | Gap |
|---|---|---|---|
| 0–14 | 84.6 | 84.7 | 0.1 |
| 15–39 | 84.6 | 84.8 | 0.2 |
| 40s | 82.7 | 83.2 | 0.5 |
| 50s | 74.2 | 75.4 | 1.2 |
| 60s | 66.6 | 69.6 | 3.0 |
| 70s | 57.9 | 64.6 | 6.7 |
| 80 and over | 35.9 | 49.8 | 13.9 |
Observation 5.2: For all cancers combined, the gap grows at every step up the age groups (0.1 → 0.2 → 0.5 → 1.2 → 3.0 → 6.7 → 13.9 points). In all 21 sites with four or more age groups available, the gap is largest at 80 and over.
Observation 5.3: For prostate cancer, the gap opens from observed 89.9% and net 90.9% in the 40s to observed 56.8% and net 83.2% at 80 and over. The older the age group, the more the "5-year survival" depends on which number is meant.
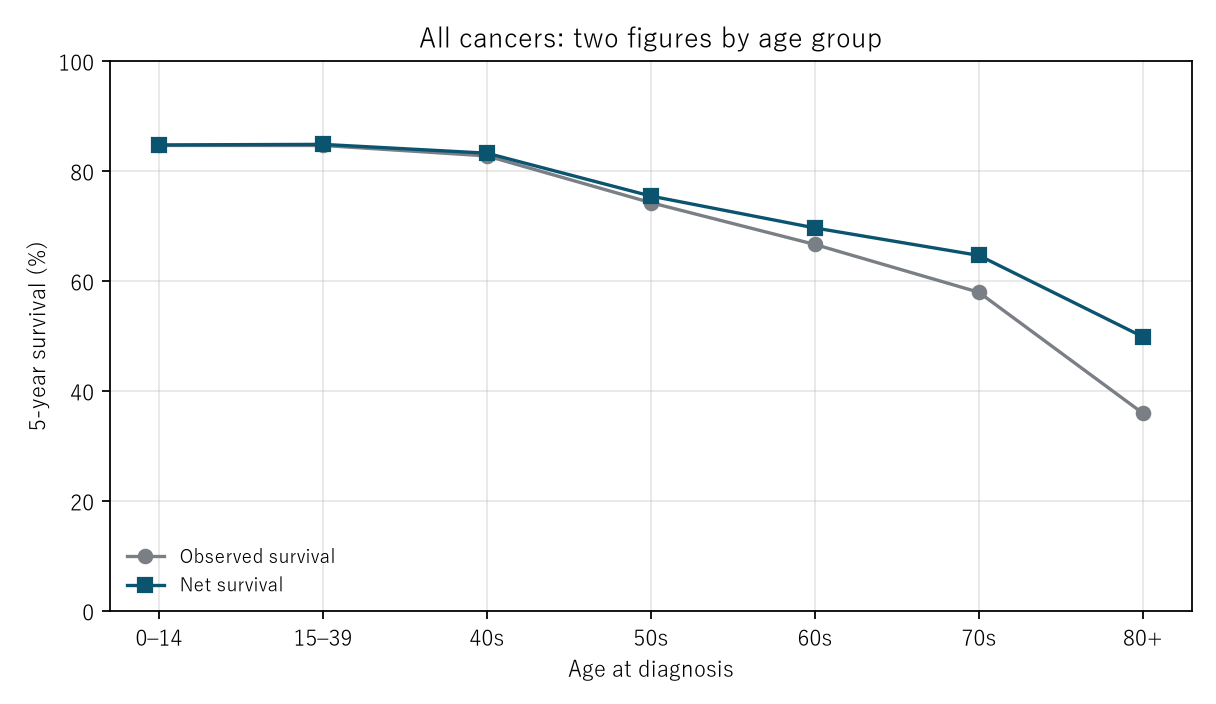
Figure 2: Observed survival (grey) and net survival (navy) by age group for all cancers combined. The two lines move apart as age increases.
6. The ceiling of 100
Observation 6.1: In the hospital-based report, net survival reaches 100.0 only for stage I and stage II prostate cancer, and the 95% interval is also 100.0 to 100.0. Observed survival for the same patients is 89.6% and 91.1%.
Observation 6.2: In the population-based relative survival, the highest "localized" values are prostate 100.000, thyroid 99.808, breast (women only) 99.149, and skin 98.190. Only prostate "localized" is stored in the file as the integer 100 (all other relative survival values are decimals).
Observation 6.3: The report gives the fact that relative survival "can theoretically reach 100% or more for cancer types with high survival" as one reason for switching to net survival. In this paper's data, net survival also has rows that stop at the ceiling of 100.0. A value at the ceiling should be read not as "no one dies of cancer" but as a place where the number cannot express any further gap (this paper has not checked how the value came to be 100).
7. Three numbers under the same disease name
Calculation 7.1 The three numbers for the 13 sites with a one-to-one correspondence (A is hospital-based, diagnosed 2014–2015; B is population-based, diagnosed 2018; breast cancer uses the women's column of B)
| Site (A / B) | A observed | A net | B relative | B − A net | Patients in B |
|---|---|---|---|---|---|
| Stomach / Stomach | 62.3 | 70.2 | 66.1 | -4.1 | 111,572 |
| Colorectum / Colon and rectum | 63.8 | 70.9 | 69.9 | -1.0 | 136,734 |
| Colon / Colon | 62.9 | 70.7 | 69.5 | -1.2 | 91,065 |
| Rectum / Rectum | 65.3 | 71.3 | 70.6 | -0.7 | 45,669 |
| Esophagus / Esophagus | 43.4 | 47.8 | 48.8 | +1.0 | 20,961 |
| Pancreas / Pancreas | 11.8 | 12.7 | 13.2 | +0.5 | 37,714 |
| Breast (women) / Breast (women only) | 88.1 | 91.6 | 89.7 | -1.9 | 89,092 |
| Cervix uteri / Cervix uteri | 72.7 | 74.4 | 73.1 | -1.3 | 10,423 |
| Corpus uteri / Corpus uteri | 80.6 | 83.0 | 81.1 | -1.9 | 15,835 |
| Prostate / Prostate | 83.3 | 95.1 | 95.7 | +0.6 | 82,967 |
| Bladder / Bladder | 54.1 | 62.6 | 66.6 | +4.0 | 20,363 |
| Larynx / Larynx | 69.3 | 78.4 | 81.6 | +3.2 | 4,386 |
| Ovary (women) / Ovary | 63.1 | 64.5 | 59.9 | -4.6 | 9,602 |
Observation 7.2: The range of the three numbers (maximum minus minimum) has a median of 6.0 points across the 13 sites, with a maximum of 12.5 points for bladder cancer. Hospital-based observed survival is the smallest of the three in 12 sites; the exception is ovarian cancer in women (population-based relative 59.9% is lower than hospital-based observed 63.1%).
Observation 7.3: Population-based relative minus hospital-based net has a median of −1.0 points, a minimum of −4.6 points (ovarian cancer in women), and a maximum of +4.0 points (bladder cancer); it is lower in 8 sites and higher in 5. This difference mixes, in addition to the difference in calculation (relative versus net), the difference in population (patients of designated cancer hospitals and others versus the whole population) and the difference in year of diagnosis. This paper does not separate them.
Observation 7.4: For pancreatic cancer the three numbers are close (11.8%, 12.7%, 13.2%). For prostate cancer they are far apart (83.3%, 95.1%, 95.7%).
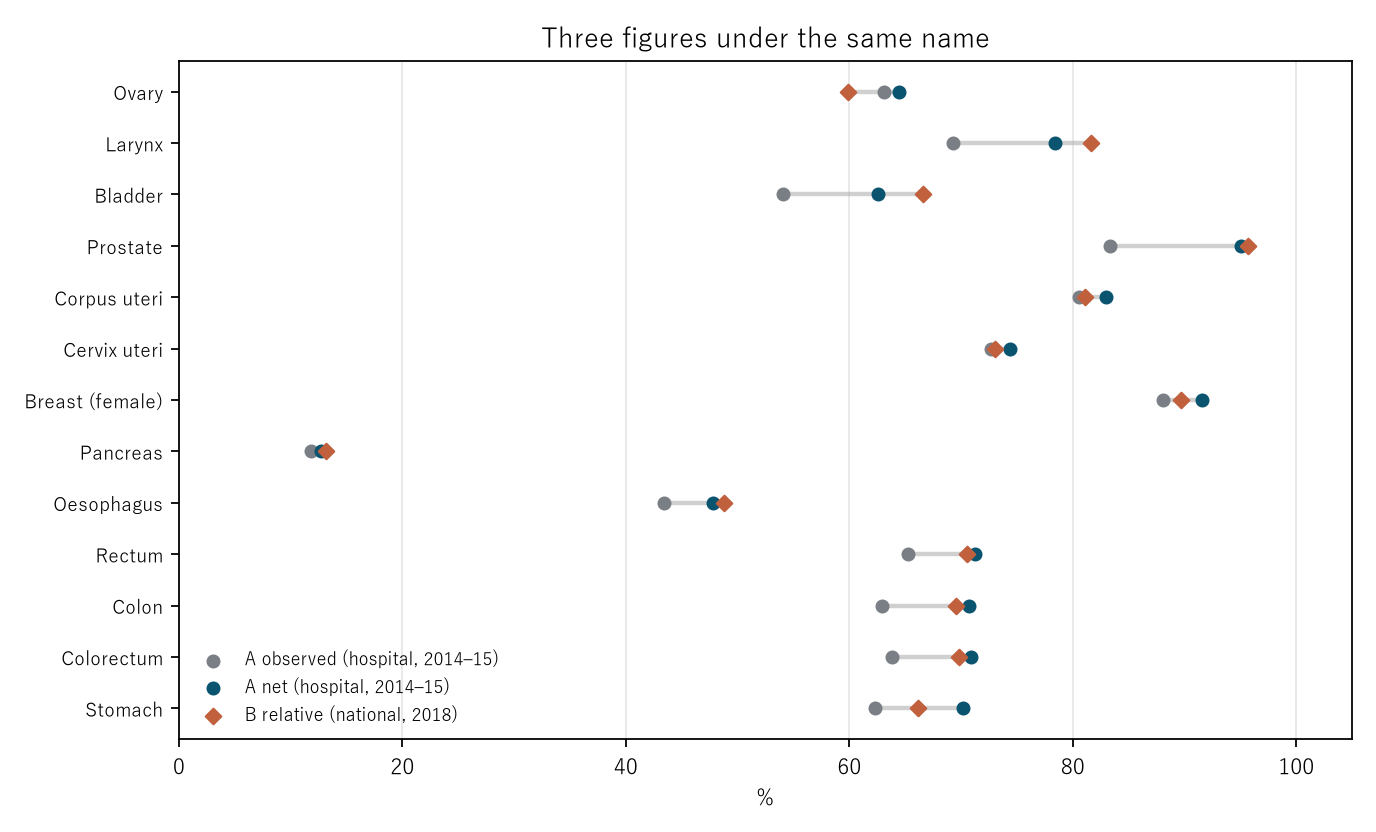
Figure 3: For each of the 13 sites, grey is hospital-based observed, navy is hospital-based net, and the vermilion diamond is population-based relative. The shorter the grey line, the closer the numbers are whichever "5-year survival" one looks at.
8. Limitations
- No survival rate is recalculated. Only published numbers are laid out.
- The hospital-based and population-based data are different populations. The differences in Section 7 mix population and year as well as the method of calculation.
- Cause-specific survival is not counted. It is not in the data.
- How the ceiling value of 100 was treated has not been checked.
- The three cells subject to the correction notice are not used, because it is unclear whether the correction was applied to the main document.
- "Gap ÷ (100 − observed)" is a rough guide. It is not itself the proportion of people who died of causes other than cancer.
- It is not one person's outlook. It does not compare facilities, regions, or treatments.
Conclusion
For the same patients, "5-year survival" becomes a different number depending on whether deaths from causes other than cancer are counted. The gap was a median of 4.3 points across 23 sites and 11.8 points for prostate cancer. For all cancers combined, the gap widened at every step of the age groups (from 0.1 to 13.9 points), and it was largest at 80 and over in all 21 sites. Both numbers that look only at the effect of cancer have places where they reach the ceiling of 100. And under the same disease name, hospital-based observed, net, and population-based relative survival stand with a median range of 6.0 points.
One thing separates them — whether people who die of causes other than cancer are counted, divided back out, or assumed not to exist.
The difference matters most for cancers in which age is high and net survival is also high. When someone says "5-year survival is so many percent", ask which 5-year survival it is.
Data and reproduction
| Data | A: Hospital-based cancer registry, 5-year survival for 2014–2015 (March 2023; National Cancer Center Japan, Institute for Cancer Control, Center for Cancer Registries) and its correction notice. B: Table of 5-year relative survival for cases diagnosed in 2016–2018 in the National Cancer Registry (cancer_survivalNCR(2016-2018).xlsx). Both: Source: National Cancer Center Japan, Cancer Information Service (retrieved 25 September 2026) |
| Terms of use | The Cancer Information Service copyright page and the "rules for use" of the tables (in original articles, cite the English source). As the English sources for B, the two given on the page (Center for Cancer Control and Information Services 2020; Matsuda et al. 2011) are listed in the references (within the file, the two sheets used here cite the former). Numbers are shown without alteration and kept separate from this paper's calculations |
| Scope | A: the overall columns of 24 tables (overall, age groups, stages). B: by site and by stage for cases diagnosed in 2018 |
| Verification | 検算/M007.py (--zu also writes the figures). Every number in the text is taken from 検算/M007_output.txt |
| Raw data | data/hosp_c_reg_surv_2014-2015.pdf, data/hosp_c_reg_surv_2014-2015_syusei.pdf, data/cancer_survivalNCR(2016-2018).xlsx, the extraction tool data/extract_m007.py, the extracted values data/m007_values.json, and data/SOURCES.md (terms of use, original text of the definitions, SHA-256) |
| Figures | 図/M007_zu1, 図/M007_zu2, 図/M007_zu3 (png, svg, English versions) |
References
- Center for Cancer Control and Information Services, National Cancer Center (2020). Monitoring of Cancer Incidence in Japan - Survival 2009-2011 Report.
- Matsuda, T., Ajiki, W., Marugame, T., Ioka, A., Tsukuma, H., & Sobue, T. (2011). Population-based Survival of Cancer Patients Diagnosed Between 1993 and 1999 in Japan: A Chronological and International Comparative Study. Japanese Journal of Clinical Oncology. 10.1093/jjco/hyq167
- National Cancer Center Japan, Institute for Cancer Control, Center for Cancer Registries (2023). Hospital-based cancer registry: 5-year survival for 2014-2015 (in Japanese). Source: National Cancer Center Japan, Cancer Information Service (accessed 25 September 2026). https://ganjoho.jp/public/qa_links/report/hosp_c/hosp_c_reg_surv/pdf/hosp_c_reg_surv_2014-2015.pdf
- National Cancer Center Japan, Cancer Information Service. Cancer survival data from the National Cancer Registry (cases diagnosed in 2016-2018), 5-year relative survival, cancer_survivalNCR(2016-2018).xlsx (in Japanese; accessed 25 September 2026). https://ganjoho.jp/reg_stat/statistics/data/dl/excel/cancer_survivalNCR%282016-2018%29.xlsx
- Yamagishi, Y. (2026). Life Expectancy Is Not the Number of Years Anyone Actually Lives [M003]. Zenodo. https://doi.org/10.5281/zenodo.22963485
- Yamagishi, Y. (2026). The "5-Year Survival" You Once Heard Is Rewritten by the Years You Have Lived [M006]. Zenodo. https://doi.org/10.5281/zenodo.22964113
Reference
Yamagishi, Y. (2026). "5-Year Survival" Is One Phrase for Three Different Numbers [M007]. Zenodo.
DOI: 10.5281/zenodo.22964570
YOI: https://www.yamagishiyuuki.com/yoi/M007
ORCID: 0009-0006-8587-3450
PDF (English) · PDF (Japanese) · Date proof of the English PDF (OpenTimestamps .ots) · SHA256SUMS
The record page for this paper (in Japanese, with the PDFs in each language and the date proof): YOI M007. This paper is a preprint and has not been peer reviewed.