Abstract
This paper asks what the phrase "one in two Japanese people will get cancer" counts — the answer is the share of people who are diagnosed at some point in their life, counted from birth. It does not mean that half of the people alive now will be diagnosed from now on. With the same 2023 rates, the figure moves from under 1% to over 20% depending on from what age, and over how many years, one counts. No new mathematical theorem or new law is claimed.
First, the published lifetime cumulative incidence risk (based on 2023 data) is 61.1% for men and 50.1% for women, and both are written as "one in two". 1 ÷ 0.611 is 1.637 people and 1 ÷ 0.501 is 1.996 people; rounded, both become the same "two" (Section 5).
Second, the "cumulative incidence rate (ages 0–74)" in Table 1-A of the National Cancer Registry (35.1724% for men, 28.4131% for women) is a rate obtained by adding the age-specific incidence rates from 0 to 74. It is reproduced without error from the rates in Table 3-1-A. Converted to a probability it becomes 29.7% for men and 24.7% for women, smaller than the table's figure (Section 4).
Third, this is the core of the paper. Calculating "the share diagnosed in the next 10 years" from the same 2023 incidence rates and the 2023 abridged life tables gives 1.5% for men and 4.1% for women starting at 40, 13.8% and 9.1% starting at 60, and 26.4% and 13.3% starting at 70. It is largest starting at 75 for men (28.3%) and at 78 for women (14.5%). For starting ages between 11 and 53, it is larger for women than for men (2.76 times starting at 40) (Section 6).
Fourth, lifetime diagnoses lean toward older ages. Of the lifetime diagnoses counted from birth, the share occurring at 75 or older is 0.511 for men and 0.464 for women. The cumulative figure reaches half of the lifetime figure at age 75 for men and 73 for women (Section 7).
Fifth, the calculation of the lifetime share changes with who is placed in the denominator. The calculation that multiplies the incidence rates by the stationary population of the life table and adds them up (Calculation A) gives 62.5% for men and 50.3% for women, close to the published figures. The calculation that removes diagnosed people from the group not yet diagnosed (Calculation B) falls to 43.3% and 38.6%, because the denominator of the rates remains the total population (Section 5). Both are calculations set up by this paper; it does not claim that either is how the published figures were computed.
Sixth, "one in two" is a figure that runs one year's rates from birth to the end of life. Even for young people the lifetime figure hardly changes (counted from 40 it is still 62.4% for men and 48.6% for women), but most of it occurs at ages far ahead. Counting the next 10 years from one's current age, the figure is below one in ten at most ages.
Scope note: No new mathematical theorem or new law is claimed — the definitions of the cumulative incidence rate and the cumulative incidence risk are known, and the Cancer Information Service glossary also explains the procedure for calculating the latter. This paper only calculates shares from published rates and life tables and shows how the figure changes with "from what age, and over how many years" one counts. This paper is a structural interpretation describing the shape of numbers in public aggregate data; it is not medical advice, diagnosis, or a recommendation of treatment or screening. The author is not a physician. For decisions about individual health, consult a physician or medical institution. It is a preprint that has not been peer reviewed. It is not one person's outlook — every share is a figure for an imaginary group aged under the assumption that the 2023 incidence and death rates never change over a lifetime (the same idea as a period life table; M003). Family history, lifestyle, screening, and whether a person has already been diagnosed are not included. It does not claim to reproduce the method of the published figures — the glossary refers the exact method to two papers, which this paper has not read. It does not decide whether the incidence counts are of persons or of tumors — neither the table nor the file states this. About the data: the e-Stat tables and life tables were processed under the Public Data License (Version 2.0) of the Government of Japan. The Cancer Information Service figures are shown without alteration and kept separate from this paper's calculations. Source: Cancer Statistics, Cancer Information Service, National Cancer Center, Japan (National Cancer Registry). What this paper adds is laying out "one in two" converted into "the next 10 years" for each starting age (women exceed men for starting ages 11 to 53); showing, by reproducing it from the tables, that the table's "cumulative incidence rate" is a sum of rates and not a probability; and showing that the lifetime share moves by more than 10 points depending on how the denominator is set.
1. Notation and question
- Incidence rate: the number diagnosed in a year divided by the population of that year (per 100,000). Published for each 5-year age group.
- Cumulative incidence rate: the age-specific incidence rates added up to a given age. Its unit is a rate, not a probability.
- Cumulative incidence risk (lifetime cumulative incidence risk): the probability of being diagnosed by a given age (within a lifetime). According to the Cancer Information Service glossary, it is calculated with the life-table method from age-specific incidence and death rates: "assume a group of 100 people aged 0, age the group, subtract the people newly diagnosed with cancer and the people who die, and when the group reaches 0, add up the number diagnosed up to that point."
Question: Whose figure, and over how many years, is "one in two people will get cancer"? Counted from one's current age, what is it?
Observation 1.1: The cumulative incidence risk is a figure that applies one year's rates (here, 2023) throughout life, from birth to the end. Like life expectancy, it is a period figure, not the share actually experienced by people born in a particular year (M003).
2. Preliminary look and design
Stated honestly: the design of this paper was decided after looking at the tables and the published figures.
| Content | |
|---|---|
| Rates | National Cancer Registry 2023, Table 3-1-A: age-specific incidence rates for all sites (21 groups from 0–4 to 100 and over), by sex |
| Table cumulative | Likewise Table 1-A: cumulative incidence rate (ages 0–74) |
| Deaths | Abridged life tables for 2023 (men, women): death probability, survivors, stationary population, and life expectancy by single year of age |
| Published | The lifetime cumulative incidence risk (based on 2023 data) in the Cancer Information Service "latest cancer statistics" |
| Calculation | For each single year of age, the rate of the 5-year group containing that age is used. Two versions, Calculation A and Calculation B (Section 5) |
3. Data and their verification
Calculation 3.1 The retrieved files were fixed by SHA-256, and the following were checked.
| What was checked | Result |
|---|---|
| e-Stat Table 3-1-A against the Cancer Information Service table (national cancer incidence data 2016–2023), rates for all sites in 2023 | Identical in all 21 groups for both sexes (largest difference 0) |
| Case counts in the cells used (2023, all sites, by sex, 5-year groups) | The smallest is 267 for men and 210 for women (both ages 5–9); none is below 10 |
| Internal consistency of the life tables (survivors × (1 − death probability) against the next age's survivors; sum of the stationary population against T0) | The largest differences are 1.2 people and 3 people, within rounding |
| The tool for Calculation B | Agrees with the closed-form expression for an imaginary life table with constant rates and deaths |
4. The table's "cumulative incidence rate (ages 0–74)" is a sum of rates
Calculation 4.1 The cumulative incidence rate (ages 0–74) in Table 1-A, and its reproduction from Table 3-1-A
| Men | Women | |
|---|---|---|
| Table 1-A cumulative incidence rate (ages 0–74) | 35.1724% | 28.4131% |
| Sum of Table 3-1-A rates (15 groups, ages 0–74) × 5 years | 35.1724% | 28.4131% |
| 1 − exp(−cumulative rate) (converted to a probability) | 29.7% | 24.7% |
| Calculation A (ages 0–74) | 30.6% | 27.0% |
| Calculation B (ages 0–74) | 26.0% | 23.5% |
Observation 4.2: The cumulative incidence rate in Table 1-A equals the Table 3-1-A rates multiplied by 5 and added (differences 5.68e-14 for men and 2.49e-14 for women). Although its unit is %, it is a sum of rates, not a probability. Converted to a probability, 35.17% becomes 29.7% for men, and 28.41% becomes 24.7% for women.
5. The figure from birth over a lifetime, and "one in two"
Calculation 5.1 The share diagnosed at some point in life, counted from birth
| Men | Women | |
|---|---|---|
| Published (lifetime cumulative incidence risk based on 2023 data) | 61.1% (one in two) | 50.1% (one in two) |
| 1 ÷ published | one in 1.637 | one in 1.996 |
| Calculation A | 62.5% | 50.3% |
| Calculation B | 43.3% | 38.6% |
Observation 5.2: The published figures are 61.1% for men and 50.1% for women, and both are written as "one in two". 1 ÷ 0.611 is 1.637 people and 1 ÷ 0.501 is 1.996 people; rounded to "one in N", a difference of 11.0 points disappears.
Observation 5.3: Calculation A multiplies each age's incidence rate by the life table's stationary population (the person-years lived at that age), adds them up, and divides by the survivors at the starting age. The denominator of the incidence rate is "the total population of that year", and Calculation A matches that denominator. Read with the idea of a stationary population, Calculation A is "the number of diagnoses over a lifetime per person born". If each person is counted once, this is directly the probability of being diagnosed within a lifetime. Calculation A differs from the published figures by +1.4 points for men and +0.2 points for women.
Observation 5.4: Calculation B follows the glossary's description literally, subtracting year by year the people newly diagnosed and the people who die from the group not yet diagnosed. But the denominator of the rates remains the total population (including people already diagnosed), so it underestimates diagnoses among people not yet diagnosed. It also applies the all-cause death rates of the life table. As a result, Calculation B is 17.8 points lower than the published figure for men and 11.5 points lower for women. Even with the same rates and the same life table, the lifetime share moves by more than 10 points depending on who is placed in the denominator. Calculation B never exceeds Calculation A at any starting age.
Observation 5.5: The glossary refers the exact method for the published figures to two papers. This paper has not read them, so it does not say which calculation the published figures correspond to. All it can say is that the figures are close to Calculation A.
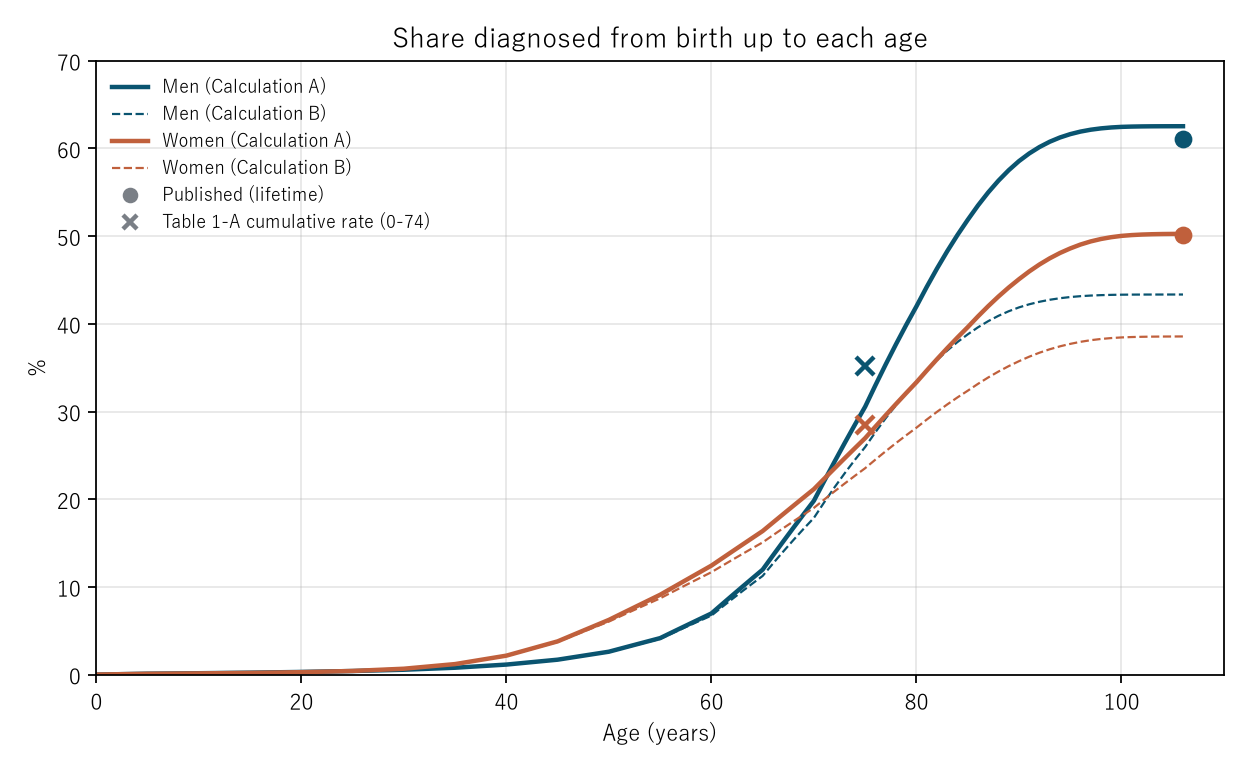
Figure 1: Solid lines are Calculation A and dashed lines Calculation B (navy for men, vermilion for women). The dots at the right end are the published figures, and the crosses are the Table 1-A cumulative incidence rates (ages 0–74). The crosses lie above the solid lines at the same age (a sum of rates is larger than a probability).
6. Core — from what age, and over how many years, one counts
Calculation 6.1 Shares by starting age (alive at that age and counted from there; Calculation A / Calculation B; %)
| Starting age | Men: next 10 years | Men: lifetime | Women: next 10 years | Women: lifetime |
|---|---|---|---|---|
| 0 | 0.2/0.2 | 62.5/43.3 | 0.1/0.1 | 50.3/38.6 |
| 20 | 0.3/0.3 | 62.5/43.4 | 0.4/0.4 | 50.2/38.6 |
| 30 | 0.6/0.6 | 62.6/43.5 | 1.5/1.5 | 49.9/38.4 |
| 40 | 1.5/1.5 | 62.4/43.4 | 4.1/4.0 | 48.6/37.6 |
| 50 | 4.5/4.4 | 61.9/43.2 | 6.3/6.1 | 44.9/35.3 |
| 60 | 13.8/12.9 | 59.7/42.3 | 9.1/8.7 | 39.4/31.8 |
| 70 | 26.4/23.0 | 50.9/37.7 | 13.3/12.4 | 31.7/26.5 |
| 80 | 26.3/22.6 | 32.6/26.5 | 14.5/13.4 | 20.8/18.3 |
| 90 | 15.0/13.4 | 15.3/13.6 | 9.9/9.2 | 10.3/9.6 |
Observation 6.2: "The next 10 years" moves from under 1% to over 20% with the starting age. With Calculation A, it is 1.5% for men and 4.1% for women starting at 40, 13.8% and 9.1% starting at 60, and 26.4% and 13.3% starting at 70. The difference between Calculation A and Calculation B is within 0.2 points for starting ages up to 50 and widens at older ages.
Observation 6.3: The next 10 years are largest starting at 75 for men (28.3%) and at 78 for women (14.5%). At older ages the figure falls, because more people die within the 10 years.
Observation 6.4: For starting ages between 11 and 53, the next 10 years are larger for women than for men (a continuous run of 43 ages). Women ÷ men is 2.52 starting at 30 and 2.76 starting at 40. Because the lifetime figure is larger for men (62.5% versus 50.3%), there are ages at which the order of men and women reverses between the lifetime comparison and the comparison from one's current age.
Observation 6.5: On the other hand, the lifetime figure hardly moves while one is young (with Calculation A, 62.4 to 62.6% for men for starting ages 0 to 40, and 49.9% for women starting at 30). Because most lifetime diagnoses occur at ages far ahead, living to 40 does not reduce the lifetime share. It is in this sense that "one in two" applies to young people too.
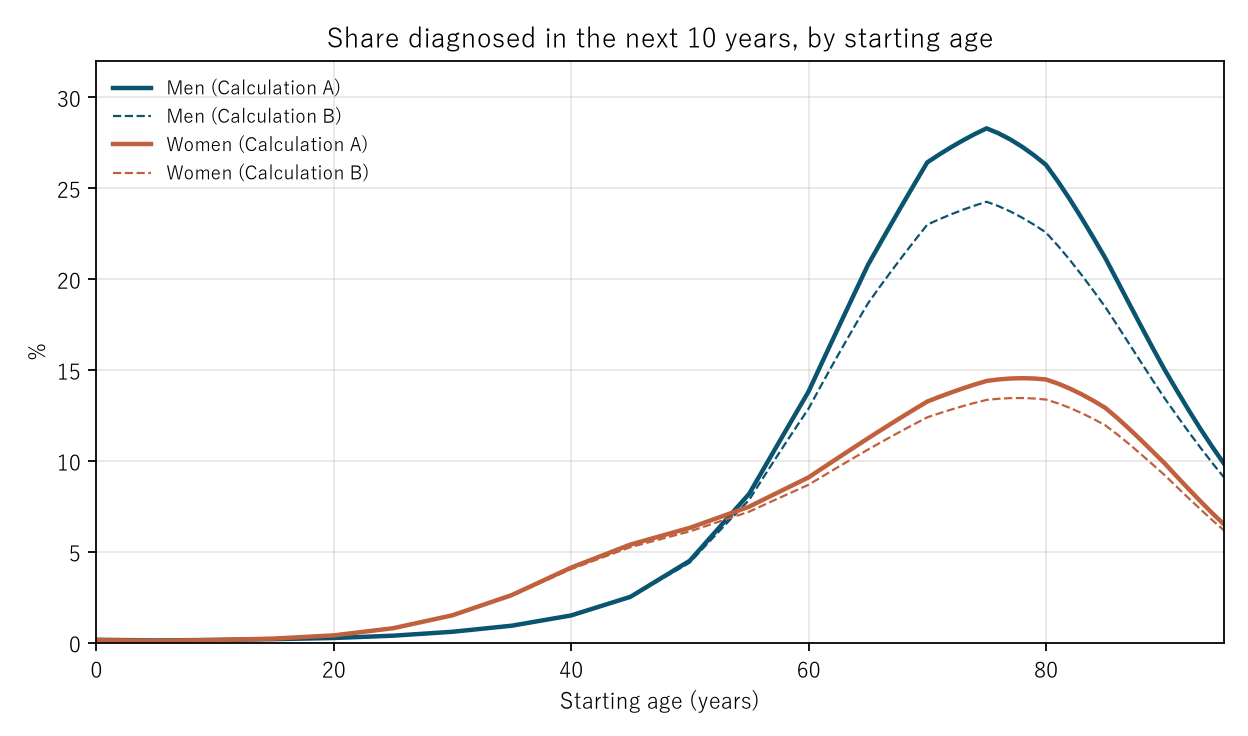
Figure 2: Solid lines are Calculation A and dashed lines Calculation B (navy for men, vermilion for women). For starting ages 11 to 53 the vermilion solid line lies above the navy solid line; above that, navy is on top.
7. At what ages lifetime diagnoses occur
Calculation 7.1 Of the lifetime diagnoses counted from birth (Calculation A), the share occurring at or above each age
| Men (lifetime 62.5%) | Women (lifetime 50.3%) | |
|---|---|---|
| 50 or older | 0.958 | 0.876 |
| 65 or older | 0.809 | 0.674 |
| 75 or older | 0.511 | 0.464 |
| 85 or older | 0.171 | 0.212 |
| Age at which the cumulative figure reaches half of the lifetime figure | 75 | 73 |
Observation 7.2: Half of lifetime diagnoses occur after age 75 for men and after 73 for women. The share occurring before age 50 is 0.042 (1 − 0.958) for men and 0.124 (1 − 0.876) for women. That women's diagnoses lean toward younger ages is the same thing as Observation 6.4 seen from another direction.
8. Limitations
- These are period figures. They assume the 2023 rates and deaths never change over a lifetime. They are not the shares of actual generations (M003).
- Single-year rates are replaced by the rates of 5-year groups. Differences by age within a group are not included.
- Both Calculation A and Calculation B were set up by this paper and are not the method of the published figures. The exact method is in papers this paper has not read.
- Whether the incidence counts are of persons or of tumors is not decided. If one person is counted twice, Calculation A becomes the number of diagnoses per person rather than a probability.
- Deaths come from the all-cause life table. They differ from the death rates of people not yet diagnosed.
- Only all sites combined are treated. Figures by site are not treated.
- It is not one person's outlook. Family history, lifestyle, screening, and chronic illness are not included. It does not discuss the effect of screening or what one should do.
Conclusion
"One in two people will get cancer" is a figure that runs the 2023 rates from birth through a whole life, and both 61.1% for men and 50.1% for women are called that. The "cumulative incidence rate (ages 0–74)" in the table is a sum of rates and becomes smaller when converted to a probability. Counting the next 10 years from the same rates and life tables gives 1.5% for men and 4.1% for women starting at 40, and 26.4% and 13.3% starting at 70, and for starting ages 11 to 53 the figure is larger for women. Half of lifetime diagnoses occur after age 75 (men) and 73 (women).
Two things separate them — from what age one counts, and over how many years.
When you hear "one in two", remember that it is a figure for a whole life counted from birth, and look at the figure for the next few years from your current age alongside it.
Data and reproduction
| Data | Ministry of Health, Labour and Welfare, "National Cancer Registry", cancer incidence 2023, Table 1-A and Table 3-1-A; "Abridged Life Tables for 2023", Tables 1 and 2 (retrieved from e-Stat; accessed 25 September 2026). The Cancer Information Service table of national cancer incidence data (2016–2023), the "latest cancer statistics" page, and the glossary entry "cumulative incidence risk" (Source: Cancer Statistics, Cancer Information Service, National Cancer Center, Japan (National Cancer Registry); accessed 25 September 2026) |
| Terms of use | e-Stat content follows the Public Data License (Version 2.0) of the Government of Japan (compatible with CC BY 4.0). The shares in this paper were produced by processing these and are not figures produced by the government. The Cancer Information Service figures are shown without alteration and kept separate from this paper's calculations |
| Scope | Japan, all sites (excluding in situ), by sex, 2023 |
| Verification | 検算/M008.py (--zu also writes the figures). Every number in the text is taken from 検算/M008_output.txt |
| Raw data | The 7 retrieved files as they are and SOURCES.md (URLs, retrieval date, SHA-256, a copy of the glossary text) in data/. The verification checks the SHA-256 every time it runs |
| Figures | 図/M008_zu1, 図/M008_zu2 (png, svg, English versions) |
References
- Ministry of Health, Labour and Welfare. National Cancer Registry: Cancer Incidence 2023, Table 1-A and Table 3-1-A (in Japanese). e-Stat (accessed 25 September 2026). https://www.e-stat.go.jp/
- Ministry of Health, Labour and Welfare. Abridged Life Tables for 2023, Tables 1 and 2 (in Japanese). e-Stat (accessed 25 September 2026). https://www.e-stat.go.jp/
- Cancer Statistics. Cancer Information Service, National Cancer Center, Japan (National Cancer Registry). National cancer incidence data (2016-2023), cancer_incidenceNCR(2016-2023).xls (in Japanese; accessed 25 September 2026). https://ganjoho.jp/reg_stat/statistics/data/dl/excel/cancer_incidenceNCR%282016-2023%29.xls
- National Cancer Center Japan, Cancer Information Service. Latest cancer statistics (in Japanese; accessed 25 September 2026). https://ganjoho.jp/reg_stat/statistics/stat/summary.html
- National Cancer Center Japan, Cancer Information Service. Glossary: cumulative incidence risk (in Japanese; accessed 25 September 2026). https://ganjoho.jp/reg_stat/statistics/qa_words/word/ruisekirikanrisuku.html
- Yamagishi, Y. (2026). Life Expectancy Is Not the Number of Years Anyone Actually Lives [M003]. Zenodo. https://doi.org/10.5281/zenodo.22963485
Reference
Yamagishi, Y. (2026). "One in Two People Will Get Cancer" Counts a Whole Life from Birth [M008]. Zenodo.
DOI: 10.5281/zenodo.22964905
YOI: https://www.yamagishiyuuki.com/yoi/M008
ORCID: 0009-0006-8587-3450
PDF (English) · PDF (Japanese) · Date proof of the English PDF (OpenTimestamps .ots) · SHA256SUMS
The record page for this paper (in Japanese, with the PDFs in each language and the date proof): YOI M008. This paper is a preprint and has not been peer reviewed.