Abstract
This paper asks what "average length of stay" counts — the answer is the average over the flow of people admitted and discharged. It is not how long the people on a ward on a given day have been there. The two count the same stays from opposite directions, and the longer a stay, the more often it appears on any one day. No new mathematical theorem or new law is claimed.
First, the Hospital Report's average length of stay (2023, all beds, 26.3 days) is patient-days divided by the mean of new admissions and discharges; the formula reproduces it within 0.048 days for all 15 years in the table. The Patient Survey gives 28.4 days for discharged patients, and inpatients on one day divided by daily discharges gives 25.4 days; all three are flow averages (Section 4).
Second, for people discharged in September the middle stay was 7 days, and 51.8% stayed 7 days or less. The mean of 28.4 days is 4.06 times the middle. Stays of a year or more were 0.66% of discharges (Section 5).
Third, this is the core of the paper. Of the 1175.3 thousand people in hospital on a day in October, the middle had been there 1 to 2 months; 23.4% a year or more, 9.6% five years or more, and 5.1% ten years or more. The share at a year or more is 35.6 times that among discharges. The mean time since admission is at least 395.6 days (Section 6).
Fourth, the discharge distribution alone predicts this. With balanced turnover, the number on day a of a stay equals daily discharges times the share of stays longer than a days. Built from the September discharges, the prediction falls within 0.77 to 1.14 times the October cross-section in all 11 categories under 5 years; from 6 months up, the actual figure is always the smaller (Section 7).
Fifth, the separator is counting the flow versus counting one day's cross-section. On any given day, a longer stay is more likely to be on the ward — the same shape as a bus rider landing in a long gap (Paper 308 of the mathematical physics series).
Sixth, "an average stay of 26 days" describes neither how long a typical patient stays nor who is on the ward on a given day. Half of discharged people go home within a week, while on any one day nearly one in four has been in hospital a year or more.
Scope note: No new mathematical theorem or new law is claimed — the Hospital Report defines the formula, and length-biased sampling is known in probability theory. This paper lays out published tables, measures the gap between the two ways of counting, and shows that the discharge distribution predicts it. This paper is a structural interpretation describing the shape of numbers in public aggregate data; it is not medical advice, diagnosis, or a treatment recommendation. The author is not a physician. For decisions about individual health, consult a physician or medical institution. It is a preprint that has not been peer reviewed. It is not one person's outlook — every figure is a national aggregate. It does not compare hospitals, facilities, regions, or bed types — only national totals are used, and the reasons for long stays are not discussed. The reasons the prediction deviates have not been checked. About the data: the e-Stat tables were processed under the Public Data License (Version 2.0) of the Government of Japan. Source: Ministry of Health, Labour and Welfare, "Patient Survey" and "Hospital Report". What this paper adds is setting one year's stays side by side as the discharge flow and as one day's cross-section — middles of 7 days and 1 to 2 months, and a 35.6-fold difference at a year or more; predicting the cross-section from discharges alone, within 0.77 to 1.14 times; and reproducing the Hospital Report's figure from its formula for every year, showing it is a flow average.
1. Notation and question
- Average length of stay (Hospital Report): patient-days in hospital ÷ {(new admissions + discharges) ÷ 2}. The total inpatient days of a year divided by the number of people who came in and went out during the year.
- Average length of stay of discharged patients (Patient Survey): the average length of stay of people discharged in one month (September).
- Length-of-stay distribution (Patient Survey, Table 104): people discharged in September divided into 32 categories by length of stay.
- Time-since-admission distribution (Patient Survey, Table 53): people in hospital on the survey day in October divided into 13 categories by the time since admission up to that day.
Question: Whose average, and in which direction, is "average length of stay"? From the viewpoint of the people on a ward on one day, how does the figure change?
Observation 1.1: A discharged person has a stay from beginning to end. A person in hospital on a given day has only the beginning up to that day. And the chance of being on the ward on a given day is greater the longer the stay. The two distributions count the same stays from different directions.
2. Preliminary look and design
Stated honestly: the design of this paper was decided after looking at the tables.
| Content | |
|---|---|
| Flow (year) | Hospital Report, time series: patient-days, new admissions, discharges, and average length of stay (totals) |
| Flow (month) | Patient Survey 2023: length of stay of people discharged in September (32 categories) and its average |
| Cross-section | Patient Survey 2023: time since admission of people in hospital on the survey day in October (13 categories) |
| Prediction | From the discharge distribution, build the cross-section that holds when turnover is balanced. Within a category each day is taken as equally likely; 1 month = 30 days and 1 year = 365 days |
3. Data and their verification
Calculation 3.1 The retrieved files were fixed by SHA-256, and the following were checked.
| What was checked | Result |
|---|---|
| Table 53: sum of the 13 categories and unknown against the total; recomputed composition against the table's composition | The sum equals the total of 1175.3 thousand; the composition differs by at most 0.045 points (rounding) |
| Table 104: sum of the 32 categories and unknown against the total | 1388.0 and 1388.2 thousand (within the rounding of numbers rounded to 0.1 thousand) |
| Table 104: whether the categories run in order of days without gaps | They do (from 0 days to 5 years or more) |
| Hospital Report: whether the average length of stay can be reproduced from the formula | For all 15 years, the largest difference is 0.048 days |
4. Average length of stay is an average over the flow
Calculation 4.1 Reproducing the Hospital Report's average length of stay (totals)
| Patient-days | New admissions | Discharges | Formula | Table | |
|---|---|---|---|---|---|
| 2023 | 410,133,669 | 15,585,034 | 15,570,198 | 26.33 days | 26.3 days |
| 2024 | 414,749,912 | 16,180,867 | 16,161,099 | 25.65 days | 25.6 days |
Observation 4.2: The Hospital Report's figure divides a year's inpatient days by the people who came in and went out; the formula reproduces it within 0.048 days for all 15 years. It is days per person in the flow, not the average stay of the people in hospital during the year.
Observation 4.3: The Patient Survey's flow averages are the same size: 28.4 days for September discharges, and 25.4 days for October inpatients (1175.3 thousand) divided by September's daily discharges. The three flow averages (26.3, 28.4, 25.4 days) differ in month and method but share an order of magnitude.
5. The middle discharged patient stayed 7 days
Calculation 5.1 Length of stay of people discharged in September (Table 104, the 1387.3 thousand with known length of stay)
| Value | |
|---|---|
| Category containing the middle person | 7 days |
| Share at 7 days or less | 51.8% |
| Share at a year or more | 0.66% (9.1 thousand) |
| Share at 5 years or more | 0.14% (2.0 thousand) |
| Average length of stay of discharged patients (Table 128) | 28.4 days (4.06 times the middle) |
Observation 5.2: Half of discharged people went home within a week. The average of 28.4 days is pulled up by a few long stays and is 4.06 times the middle.
6. Core — the time since admission of people in hospital on one day
Calculation 6.1 People in hospital on the survey day in October (Table 53, total 1175.3 thousand)
| Time since admission | Thousand | Share | Cumulative |
|---|---|---|---|
| 0–7 days | 288.0 | 0.245 | 0.245 |
| 8–14 days | 107.8 | 0.092 | 0.337 |
| 15–30 days | 155.3 | 0.132 | 0.469 |
| 1–2 months | 136.5 | 0.116 | 0.585 |
| 2–3 months | 65.9 | 0.056 | 0.641 |
| 3–6 months | 76.6 | 0.065 | 0.706 |
| 6 months–1 year | 67.4 | 0.057 | 0.764 |
| 1 year–1 year 6 months | 39.2 | 0.033 | 0.797 |
| 1 year 6 months–2 years | 29.4 | 0.025 | 0.822 |
| 2–3 years | 41.3 | 0.035 | 0.857 |
| 3–5 years | 51.5 | 0.044 | 0.901 |
| 5–10 years | 53.7 | 0.046 | 0.947 |
| 10 years or more | 59.7 | 0.051 | 0.997 |
Observation 6.2: The middle person in hospital on a given day falls in the category of 1 to 2 months since admission. Those at 30 days or less are 46.9%, short of half.
Observation 6.3: Those in hospital a year or more number 274.8 thousand (23.4%), five years or more 113.4 thousand (9.6%), and ten years or more 59.7 thousand (5.1%). The share at a year or more is 35.6 times that among discharged people (0.66%).
Observation 6.4: Counting each category at its lower end (10 years or more as 10 years), the mean time since admission is still 395.6 days. On a given day, the ward's average exceeds a year — an order of magnitude above the flow averages of 26.3 to 28.4 days.
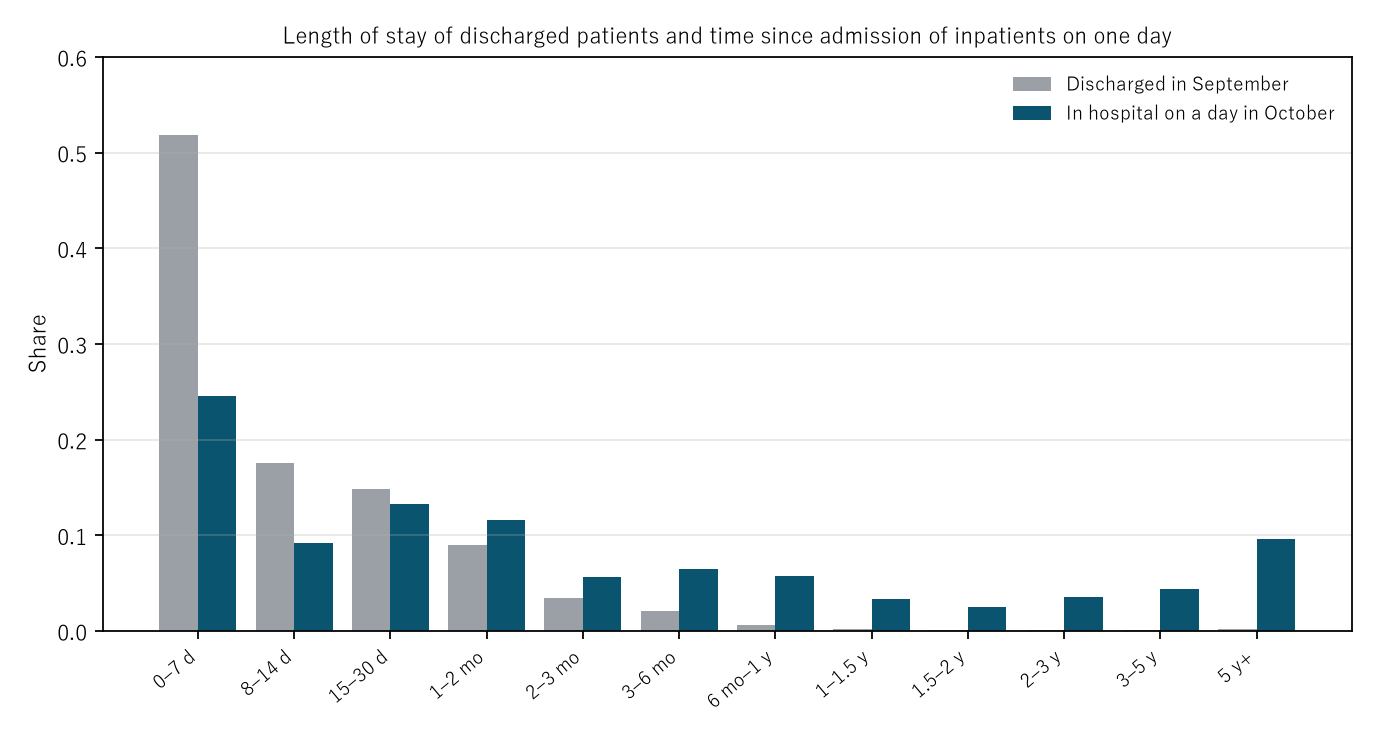
Figure 1: Grey is the length of stay of people discharged in September; navy is the time since admission of people in hospital on a day in October (both as shares by category). Half of discharged people gather at 7 days or less, while inpatients on one day spread into the long categories. When the discharged people are rearranged into the categories of Table 53, each day within a category is taken as equally likely.
7. Predicting the cross-section on one day from the discharge distribution
Calculation 7.1 When turnover is balanced, the number of people on day a of their stay = the daily number of discharges (1388.2 ÷ 30 thousand) × the share whose length of stay exceeds a days. There are two conventions for whether a person is counted on day a (">": a person with length of stay T is counted on days 0 to T−1; "≥": counted on days 0 to T).
| Time since admission | Actual (thousand) | Predicted ">" | Predicted "≥" | Actual ÷ predicted (>, ≥) |
|---|---|---|---|---|
| 0–7 days | 288.0 | 253.1 | 277.0 | 1.14, 1.04 |
| 8–14 days | 107.8 | 119.5 | 127.6 | 0.90, 0.84 |
| 15–30 days | 155.3 | 158.2 | 165.1 | 0.98, 0.94 |
| 1–2 months | 136.5 | 146.1 | 150.3 | 0.93, 0.91 |
| 2–3 months | 65.9 | 69.6 | 71.2 | 0.95, 0.93 |
| 3–6 months | 76.6 | 83.5 | 84.5 | 0.92, 0.91 |
| 6 months–1 year | 67.4 | 80.7 | 81.0 | 0.84, 0.83 |
| 1 year–1 year 6 months | 39.2 | 47.9 | 48.0 | 0.82, 0.82 |
| 1 year 6 months–2 years | 29.4 | 36.3 | 36.3 | 0.81, 0.81 |
| 2–3 years | 41.3 | 53.5 | 53.6 | 0.77, 0.77 |
| 3–5 years | 51.5 | 65.7 | 65.8 | 0.78, 0.78 |
Observation 7.2: Built from discharges alone, the prediction falls within 0.77 to 1.14 times the actual figure in all 11 categories under 5 years. Half of discharges go home within a week, yet one day's inpatients spread into the long categories; weighting by length alone yields that shape.
Observation 7.3: In the 5 categories from 6 months up, the actual figure is always below the prediction (0.77 to 0.84 times the ">" prediction). September discharges and the October cross-section are different months, and turnover need not balance exactly; the reasons were not checked. Five years or more cannot be predicted, because the discharge table's top category is open.
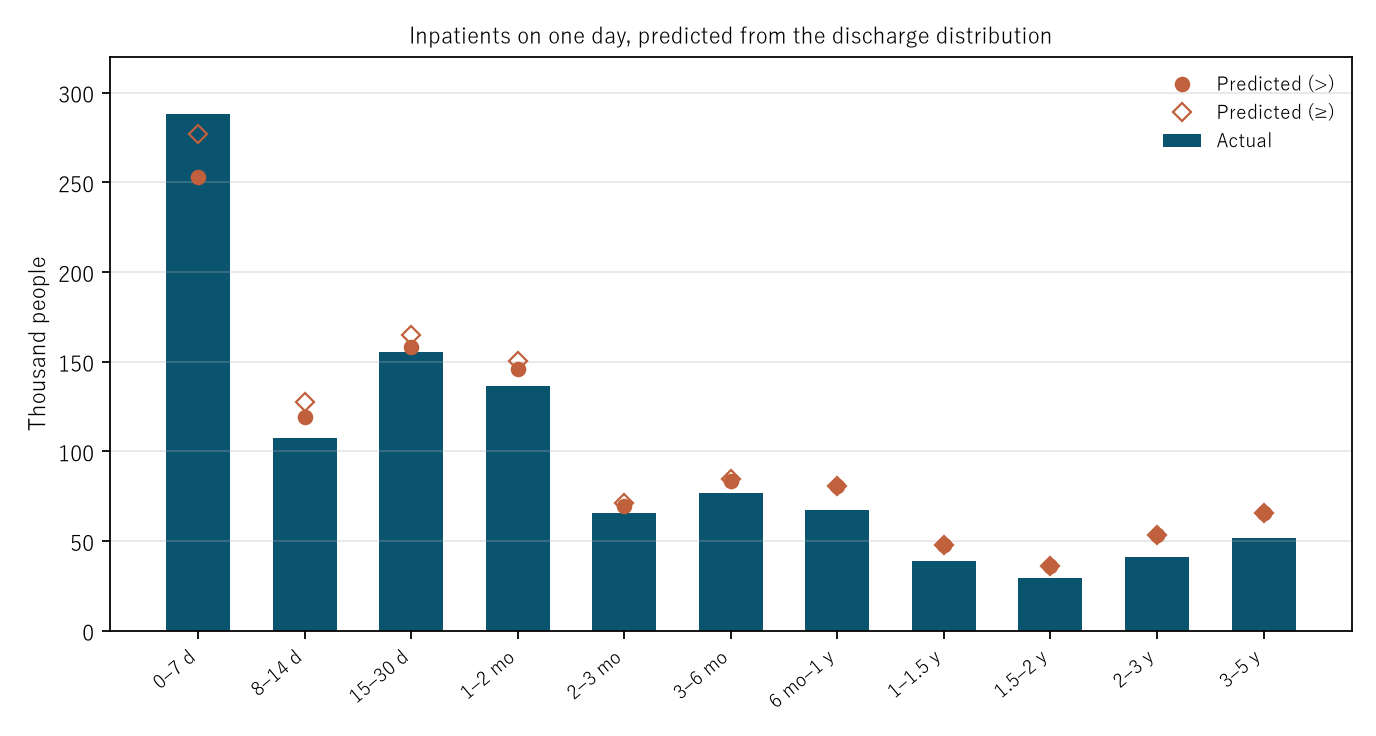
Figure 2: Bars are the actual numbers of people in hospital on a day in October; dots and diamonds are the predictions from the September discharge distribution (conventions ">" and "≥").
Observation 7.4: This is the shape Paper 308 of the mathematical physics series showed as "the gap between the buses you board is twice the average": a bus rider tends to land in a long gap, and a visitor to a ward tends to meet a long stay. What separates them is the sample — the flow, or one day's cross-section.
8. Limitations
- Discharges are for September and the cross-section is for October. The same people are not followed.
- The prediction assumes that turnover is balanced. The reasons it deviates in the categories of 6 months or more have not been checked.
- Each day within a category is taken as equally likely, with 1 month = 30 days and 1 year = 365 days. The prediction moves a little with where the boundaries are placed.
- Five years or more is not predicted, because the discharge table's top category is open.
- Only a lower bound is given for the average time since admission, because the category of 10 years or more is open.
- Only national totals are used. Differences by hospital, facility, bed type, or illness are not treated, nor are the reasons why some people stay long.
- It is not one person's outlook.
Conclusion
The Hospital Report's 26.3 days is a flow average — patient-days over the people coming in and going out — reproduced from its formula for all 15 years. The middle September discharge stayed 7 days; half went home within a week. Yet on a day in October, the middle inpatient had been there 1 to 2 months, 23.4% a year or more (35.6 times the share among discharges), and 5.1% ten years or more. Weighting the discharge distribution by length predicted this within 0.77 to 1.14 times.
One thing separates them — whether stays are counted as the flow of people being discharged or as the cross-section of a ward on one day.
When you hear "average length of stay", remember that it is the average of the people coming in and going out, and that on a ward on any one day, people with long stays appear more often.
Data and reproduction
| Data | Ministry of Health, Labour and Welfare, "Patient Survey 2023", national volume, Tables 53, 104 and 128; "Hospital Report 2024", national volume (time series), Tables 2, 3, 4 and 8. All retrieved from e-Stat (CSV; accessed 25 September 2026) |
| Terms of use | e-Stat content follows the Public Data License (Version 2.0) of the Government of Japan (compatible with CC BY 4.0). The predictions and shares in this paper were produced by processing these and are not figures produced by the government |
| Scope | Japan, national totals. The Patient Survey covers hospitals and general clinics (not dental clinics) in 2023; the Hospital Report is the time series for hospitals |
| Verification | 検算/M009.py (--zu also writes the figures). Every number in the text is taken from 検算/M009_output.txt |
| Raw data | The 7 retrieved files as they are and SOURCES.md (URLs, retrieval date, SHA-256, copies of the table notes, how categories were converted to days) in data/. The verification checks the SHA-256 every time it runs |
| Figures | 図/M009_zu1, 図/M009_zu2 (png, svg, English versions) |
References
- Ministry of Health, Labour and Welfare. Patient Survey 2023, national volume, Table 53, Table 104 and Table 128 (in Japanese). e-Stat (accessed 25 September 2026). https://www.e-stat.go.jp/
- Ministry of Health, Labour and Welfare. Hospital Report 2024, national volume (time series), Table 2, Table 3, Table 4 and Table 8 (in Japanese). e-Stat (accessed 25 September 2026). https://www.e-stat.go.jp/
- Yamagishi, Y. (2026). The Gap between the Buses You Board Is Twice the Average [Paper 308]. Zenodo. 10.5281/zenodo.22172305
Reference
Yamagishi, Y. (2026). "Average Length of Stay" Is the Average of the People Who Are Discharged [M009]. Zenodo.
DOI: 10.5281/zenodo.22965052
YOI: https://www.yamagishiyuuki.com/yoi/M009
ORCID: 0009-0006-8587-3450
PDF (English) · PDF (Japanese) · Date proof of the English PDF (OpenTimestamps .ots) · SHA256SUMS
The record page for this paper (in Japanese, with the PDFs in each language and the date proof): YOI M009. This paper is a preprint and has not been peer reviewed.