Abstract
This paper asks what "head control comes at N months" or "walking comes at N months" leaves out — the answer is the range of ages. In the "pass rates" of the 2023 National Growth Survey on Preschool Children (the share answered "can do" at each age in months), the age at which half of children pass and the age at which 9 in 10 pass lie 1 to 5 months apart, depending on the milestone. No new mathematical theorem or new law is claimed.
First, the pass-rate tables give 22 one-month age groups from 2 to 23 months, for 6 motor milestones and 1 language milestone. All values lie between 0 and 100, and each milestone covers a different range of ages (Section 3).
Second, this is the core of the paper. Joining the midpoints of the age groups with straight lines, the span from 50% to 90% passing is 0.98 months for head control, 1.23 for rolling over, 2.21 for sitting alone, 2.81 for crawling, 2.62 for pulling to stand, 2.90 for walking alone, and 4.82 for saying words (Section 4).
Third, the span is wider for later milestones. The correlation between the 50% age and the 50-to-90% span is 0.903, and the span divided by the 50% age stays between 0.227 (walking alone) and 0.368 (crawling). The span is roughly 2 to 4 tenths of the middle age and grows with it (Section 5).
Fourth, at 1 year 0 months, 47.9% were answered as walking alone and 36.5% as saying words; at 1 year 3 months, 88.4% and 69.6%; at 1 year 6 months, 97.5% and 91.1% (Section 4).
Fifth, the monthly shares dip below the previous month in places (7 dips across the 7 milestones). The general survey covered 1453 children aged 0 and 964 aged 1, about 121 and 80 per month on average, so each group's share wobbles (Section 6).
Sixth, "can do at N months" is not one age but the span between the age at which half can and the age at which almost all can. That span widens by months for later milestones. The table describes a population, not a tool for judging one child's development.
Scope note: No new mathematical theorem or new law is claimed — pass rates are tabulations defined by the survey; this paper reads them and measures the span between the half and 9-in-10 ages. This paper is a structural interpretation describing the shape of numbers in public aggregate data; it is not medical advice, diagnosis, or a treatment recommendation. The author is not a physician. For decisions about individual health, consult a physician or medical institution. It is a preprint that has not been peer reviewed. It does not judge any child's development — these are shares of the population surveyed in 2023, not numbers for calling a child "early" or "late". If a child's development is a concern, please consult a physician or public health nurse. It does not rebuild counts from shares — the tables give no counts per month. Placing each group at its midpoint is an assumption. About the data: the e-Stat tables were processed under the Public Data License (Version 2.0) of the Government of Japan. Source: Children and Families Agency, "National Growth Survey on Preschool Children". What this paper adds is reading the 10%, 50% and 90% ages of all 7 milestones in the same way, showing the 50-to-90% span runs from 0.98 to 4.82 months, and showing that the span stays within 0.227 to 0.368 times the middle age and is wider for later milestones.
1. Notation and question
- Pass rate: among children in an age group (e.g. "0 years 2 to under 3 months"), the share answered "can do". Per the table notes, it is "the share answering 'can do' out of the total at each age", for children under 2.
- 50% age: the age at which the pass rate first exceeds 50%; likewise the 90% age. Each group's value is placed at its midpoint (2.5 months for 2 to 3 months), and neighbours are joined by straight lines.
- 50-to-90% span: the 90% age minus the 50% age.
Question: Can "can do at N months" be stated as one age? If not, how wide is the span?
Observation 1.1: A pass rate asks whether a child can do something now, not the age it first happened. If an ability, once gained, is not lost, the 50% age reads as "the age by which half of children have gained it" (this paper reads it that way).
2. Preliminary look and design
Stated honestly: the design of this paper was decided after looking at the tables.
| Content | |
|---|---|
| Tables | 2023 National Growth Survey on Preschool Children, Table 12 (motor pass rates, 6 milestones) and Table 13 (language pass rate, "saying words") |
| Counts | Likewise Table 19 (number surveyed by age, general survey) |
| Reading | Join group midpoints with straight lines; read the ages first exceeding 10%, 50% and 90% |
| Comparison | The 50-to-90% span, and that span divided by the 50% age, for each milestone |
3. Data and their verification
Calculation 3.1 The retrieved files were fixed by SHA-256, and the following were checked.
| What was checked | Result |
|---|---|
| Milestones in Tables 12 and 13 | 6 motor milestones (head control, rolling over, sitting alone, crawling, pulling to stand, walking alone) and "saying words" |
| Age groups | 22 one-month groups from 2 to 23 months |
| Range of values | All 74 values lie between 0 and 100 |
| Ages with values | Head control 2–5, rolling over 2–7, sitting alone 5–12, crawling 5–14, pulling to stand 5–14, walking alone 8–21, saying words 2–23 months |
| Counts in Table 19 | Ages sum to the total of 6892 (1453 aged 0, 964 aged 1) |
Observation 3.2: Most values carry many digits, but five cells of Table 12 have exactly one decimal (sitting alone at 8–9 and 9–10 months; walking alone at 1 year 3–4, 4–5 and 7–8 months). The table gives no reason. This paper uses the values as they are.
4. Core — the span of ages from half to 9 in 10
Calculation 4.1 Ages at which the pass rate exceeds 10%, 50% and 90% (reading from group midpoints joined by straight lines; months)
| Milestone | 10% | 50% | 90% | 50–90% span | 10–90% span | Span ÷ 50% age |
|---|---|---|---|---|---|---|
| Head control | 2.59 | 3.43 | 4.41 | 0.98 | 1.82 | 0.287 |
| Rolling over | 2.94 | 4.31 | 5.54 | 1.23 | 2.60 | 0.285 |
| Sitting alone | 5.75 | 7.06 | 9.27 | 2.21 | 3.51 | 0.313 |
| Crawling | 5.78 | 7.62 | 10.43 | 2.81 | 4.65 | 0.368 |
| Pulling to stand | 6.61 | 8.12 | 10.73 | 2.62 | 4.12 | 0.322 |
| Walking alone | 10.55 | 12.78 | 15.69 | 2.90 | 5.14 | 0.227 |
| Saying words | 10.44 | 13.41 | 18.23 | 4.82 | 7.79 | 0.359 |
Observation 4.2: From half to 9 in 10 able takes 0.98 months for head control, 2.90 for walking alone, and 4.82 for saying words. From 10% to 90%, it is 1.82 months for head control and 7.79 for saying words.
Observation 4.3: The order of the 50% ages matches the order of the milestones in the tables (head control → rolling over → sitting alone → crawling → pulling to stand → walking alone → saying words).
Observation 4.4: In the table values themselves, at 1 year 0 months 47.9% were answered as walking alone and 36.5% as saying words; at 1 year 3 months, 88.4% and 69.6%; at 1 year 6 months, 97.5% and 91.1%. Around the first birthday, walkers and non-walkers are about half and half.
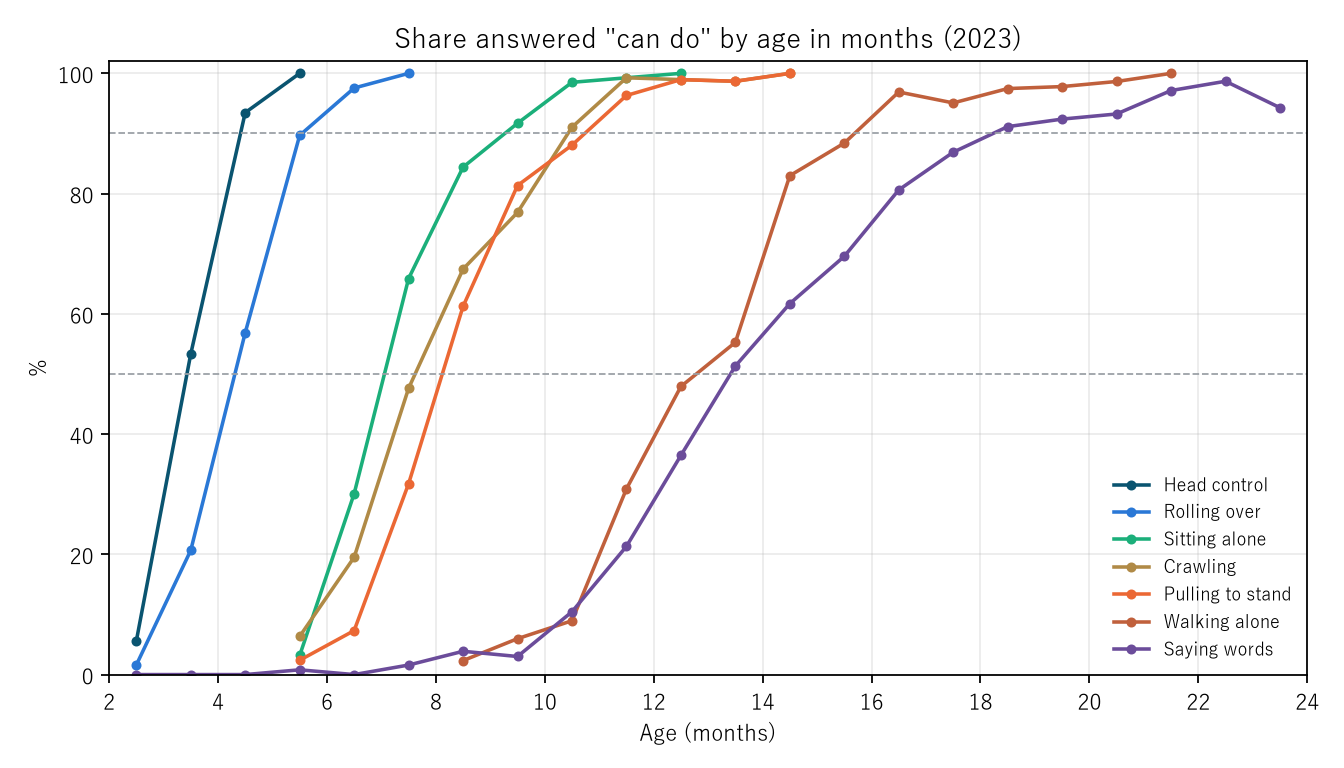
Figure 1: Pass rates of the 7 milestones placed at group midpoints and joined. Dashed lines mark 50% and 90%. Later milestones rise more gently.
5. The span is wider for later milestones
Observation 5.1: Across the 7 milestones, the correlation between the 50% age and the 50-to-90% span is 0.903. The later the milestone, the wider the span from half to 9 in 10.
Observation 5.2: Divided by the 50% age, the span stays between 0.227 (walking alone) and 0.368 (crawling). The span grows with age, but its ratio to the middle age stays at roughly 2 to 4 tenths. Counted in months, later milestones spread more; as a ratio, every milestone spreads about alike.
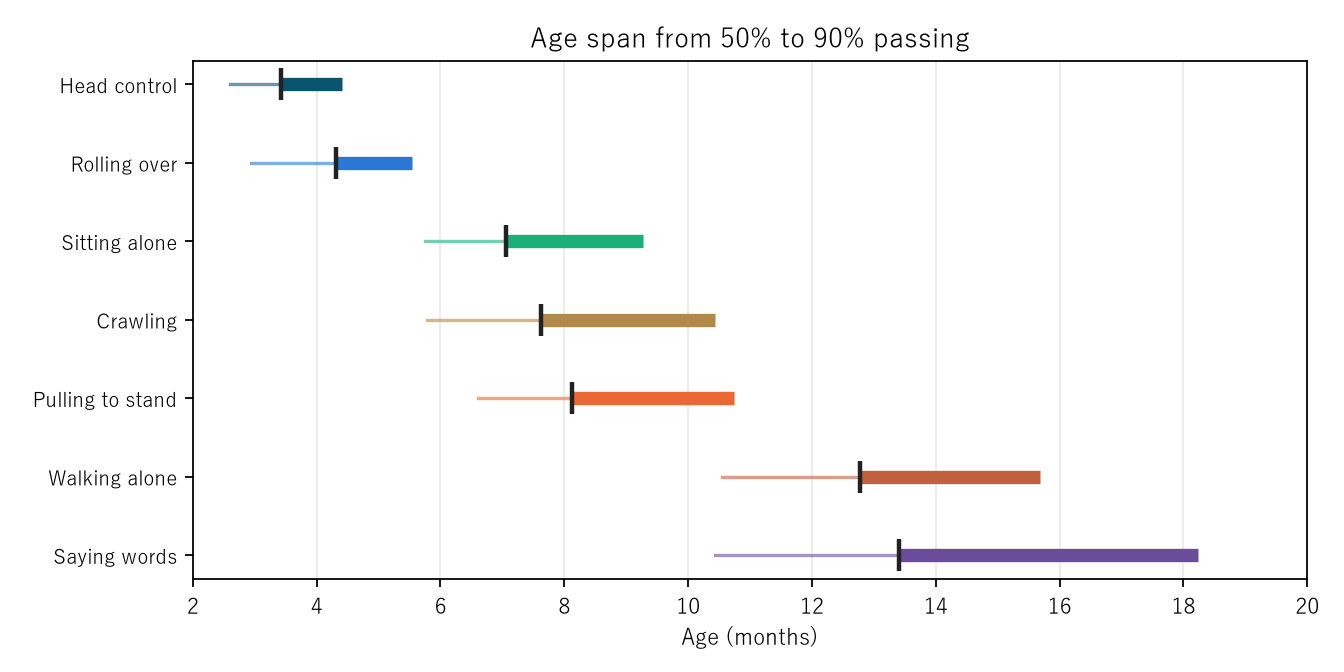
Figure 2: Thick bars run from 50% to 90%, thin lines from 10% to 50%, and the vertical tick marks the 50% age. The bars lengthen from the top milestone to the bottom.
6. Month-to-month wobble
Observation 6.1: Monthly shares dip below the previous month in places: crawling twice, pulling to stand once, walking alone once (96.9 → 95.1 at 17 months), and saying words three times (for example 98.7 → 94.3 at 23 months), 7 in all. Head control, rolling over and sitting alone have no dips.
Observation 6.2: The general survey covered 1453 children aged 0 and 964 aged 1 (Table 19), about 121 and 80 per month on average. Each group's share wobbles by that much. The 50% and 90% ages here are read from one-month groups and are not precise to two decimals.
7. Limitations
- These numbers do not judge one child's development. They are population shares.
- Group values are placed at group midpoints and joined by straight lines. The ages within a group are not in the table.
- A pass rate asks whether a child can do something now, not the age it first happened.
- Counts per month are not in the table. Averages come only from Table 19's counts by age; no counts are rebuilt from shares.
- Why five cells of Table 12 have one decimal was not checked.
- This is a single survey from 2023. No comparison with past surveys is made.
Conclusion
Reading the 2023 pass rates the same way, going from half to 9 in 10 able took 0.98 months for head control, 2.90 for walking alone, and 4.82 for saying words. The span was wider for later milestones (correlation 0.903 with the 50% age) and stayed within 0.227 to 0.368 times the middle age. At 1 year 0 months, 47.9% were answered as walking; at 1 year 6 months, 91.1% as saying words.
One thing separates them — whether "can do at N months" is stated as the middle age or as the width of the distribution.
When you hear "can do at N months", remember that it is the age for half of children, and that months more pass before almost all can. If something is a concern, consult a physician or public health nurse rather than the table.
Data and reproduction
| Data | Children and Families Agency, "National Growth Survey on Preschool Children 2023", Tables 12, 13 and 19 (retrieved from e-Stat; accessed 25 September 2026) |
| Terms of use | e-Stat content follows the Public Data License (Version 2.0) of the Government of Japan (compatible with CC BY 4.0). The ages and spans read in this paper were produced by processing these and are not figures produced by the government |
| Scope | Japan, general survey, children under 2, 6 motor milestones and 1 language milestone |
| Verification | 検算/M010.py (--zu also writes the figures). Every number in the text is taken from 検算/M010_output.txt |
| Raw data | The 3 retrieved files (only renamed) and SOURCES.md (URLs, retrieval date, SHA-256, copies of the table notes) in data/ |
| Figures | 図/M010_zu1, 図/M010_zu2 (png, svg, English versions) |
References
- Children and Families Agency. National Growth Survey on Preschool Children 2023, Table 12, Table 13 and Table 19 (in Japanese). e-Stat (accessed 25 September 2026). https://www.e-stat.go.jp/
Reference
Yamagishi, Y. (2026). A Child's "Can Do" Has a Range of Ages Built In [M010]. Zenodo.
DOI: 10.5281/zenodo.22965712
YOI: https://www.yamagishiyuuki.com/yoi/M010
ORCID: 0009-0006-8587-3450
PDF (English) · PDF (Japanese) · Date proof of the English PDF (OpenTimestamps .ots) · SHA256SUMS
The record page for this paper (in Japanese, with the PDFs in each language and the date proof): YOI M010. This paper is a preprint and has not been peer reviewed.