Abstract
This paper asks how "how many years would life expectancy grow without cancer" relates to how many people die of cancer — the answer is that the count alone does not settle it; the age at death matters. The 2024 abridged life tables give, for each cause, "the probability of eventually dying of it" and "the gain in life expectancy if it were removed". These are two different yardsticks, and their orders disagree. No new mathematical theorem or new law is claimed.
First, for men the probability of dying of cancer is 25.59%, and removing cancer adds 3.11 years (3.84% of life expectancy, 81.09 years). For women it is 19.06% and 2.68 years (3.08% of 87.13 years). Cancer's share of that year's deaths is 27.06% for men and 20.66% for women, a little different from the probability (Section 4).
Second, women's old age has a larger probability (20.75%) than cancer (19.06%), yet removing it adds 1.19 years, less than half of cancer's 2.68. Men's suicide has a probability of 1.69% but adds 0.56 years (Section 4).
Third, probabilities add across causes; years gained do not. The three probabilities for cancer, heart disease and cerebrovascular disease sum to the table's combined row (45.41% for men, 40.29% for women). The three gains sum to 5.12 and 4.35 years, 0.78 and 0.51 years less than removing all three at once (5.90 and 4.86) (Section 5).
Fourth, this is the core of the paper. Years gained per 1% of probability are larger the younger people die of the cause. Over 14 pairs (7 causes × 2 sexes), the correlation between mean age at death and "gain ÷ probability" is −0.971. Suicide (mean ages 53.7 and 52.8) gives 0.331 and 0.410 years per 1%; old age (89.7 and 93.2) gives 0.050 and 0.057 (Section 6).
Fifth, the gains can be rebuilt from vital-statistics deaths by cause and age plus the life table. Treating causes as independent and each cause's share as constant within a 5-year group, this paper's approximation reproduces the 7 causes × 2 sexes within 0.006 years and the three-cause row within 0.014 (Section 7).
Sixth, "how many die of a cause" and "how many years its absence would add" count different things — people versus years. Those spared one cause still die later of another, which is why the gains look small.
Scope note: No new mathematical theorem or new law is claimed — cause-specific death probabilities and gains from removing a cause are published with the life tables, as is their method. This paper lays them side by side and measures how far age at death explains the gap. This paper is a structural interpretation describing the shape of numbers in public aggregate data; it is not medical advice, diagnosis, or a treatment recommendation. The author is not a physician. For decisions about individual health, consult a physician or medical institution. It is a preprint that has not been peer reviewed. It is not one person's outlook — all figures are period figures assuming 2024 mortality stays fixed (M003). "Removing a cause" is a computational assumption — causes are taken as independent; it does not show the effect of any treatment or prevention. It does not rank causes by importance — it only shows that there are two yardsticks. About the data: the e-Stat tables were processed under the Public Data License (Version 2.0) of the Government of Japan. The gains table is the version corrected on 12 September 2025 (only women's tuberculosis row changed). Source: Ministry of Health, Labour and Welfare, "Abridged Life Tables" and "Vital Statistics". What this paper adds is laying out probabilities and gains for 7 causes × 2 sexes and showing that women's old age and cancer swap order; showing from the combined row that probabilities add and gains do not; showing a −0.971 correlation between gain per 1% and mean age at death; and rebuilding the gains from deaths by cause within 0.006 years.
1. Notation and question
- Cause-specific death probability: assuming 2024 mortality stays fixed, the probability that a person of a given age eventually dies of the cause (here, at age 0).
- Gain in life expectancy from removing a cause: the increase in life expectancy if the cause were eliminated; the published method assumes causes are independent (here, at age 0).
- Share of deaths: among people who died in 2024, the share dying of the cause (vital statistics).
Question: Does the number of people dying of cancer tell how many years life expectancy would grow without it?
Observation 1.1: The probability counts how many people die of a cause; the gain counts how many years, on average, are lost to it. Remove a cause, and those who would have died of it still die later of another cause. The gain is the average length of that "later".
2. Preliminary look and design
Stated honestly: the design of this paper was decided after looking at the tables.
| Content | |
|---|---|
| Probability and gain | Age-0 values from the reference tables of the 2024 abridged life tables |
| Share | Deaths by cause from Vital Statistics 2024, Volume 2, Table 2 |
| Causes | Cancer, heart disease (excluding hypertensive), cerebrovascular disease, pneumonia, accidents, suicide, old age, and the table's combined row of three causes |
| Rebuild | Remove, from each single-year death probability, the force of mortality in proportion to the cause's share in the same 5-year group |
3. Data and their verification
Calculation 3.1 The retrieved files were fixed by SHA-256, and the following were checked.
| What was checked | Result |
|---|---|
| Age columns of the reference tables | Every 5 years from 0 to 105 (22 columns) |
| Whether the gains table is the corrected one | Women's tuberculosis at age 0 is 0.00, not the pneumonia row's 0.29 — corrected |
| Volume 2, Table 2: age groups plus unknown in the rows used | Equal the total for the total row and all 7 causes, both sexes |
| Life expectancy (life table) | 81.09 years for men, 87.13 for women |
4. Three numbers side by side
Calculation 4.1 Share of deaths (2024), death probability (age 0), and gain (age 0) for 7 causes
| Sex | Cause | Share of deaths | Probability | Gain | Gain ÷ life expectancy |
|---|---|---|---|---|---|
| Men | Cancer | 27.06% | 25.59% | 3.11 y | 3.84% |
| Men | Heart disease | 13.59% | 13.70% | 1.37 y | 1.69% |
| Men | Cerebrovascular | 6.24% | 6.12% | 0.64 y | 0.79% |
| Men | Pneumonia | 5.68% | 5.89% | 0.42 y | 0.52% |
| Men | Accidents | 3.17% | 3.18% | 0.39 y | 0.48% |
| Men | Suicide | 1.63% | 1.69% | 0.56 y | 0.69% |
| Men | Old age | 7.17% | 8.39% | 0.42 y | 0.52% |
| Women | Cancer | 20.66% | 19.06% | 2.68 y | 3.08% |
| Women | Heart disease | 14.63% | 14.77% | 1.12 y | 1.29% |
| Women | Cerebrovascular | 6.57% | 6.46% | 0.55 y | 0.63% |
| Women | Pneumonia | 4.28% | 4.35% | 0.29 y | 0.33% |
| Women | Accidents | 2.51% | 2.45% | 0.26 y | 0.30% |
| Women | Suicide | 0.80% | 0.83% | 0.34 y | 0.39% |
| Women | Old age | 18.85% | 20.75% | 1.19 y | 1.37% |
Observation 4.2: Removing cancer adds 3.11 years for men and 2.68 for women, 3.84% and 3.08% of life expectancy — small next to probabilities of 25.59% and 19.06%.
Observation 4.3: Women's old age has a larger probability than cancer (20.75% vs 19.06%), yet its gain of 1.19 years is less than half of cancer's 2.68. Men's suicide has a smaller probability than old age (1.69% vs 8.39%) but a larger gain (0.56 vs 0.42 years). The order by probability and the order by gain disagree.
Observation 4.4: The share of that year's deaths is close to, but not the same as, the life-table probability (18.85% and 20.75% for women's old age). The former reflects that year's population age structure; the latter is a period figure for the life-table population (M003).
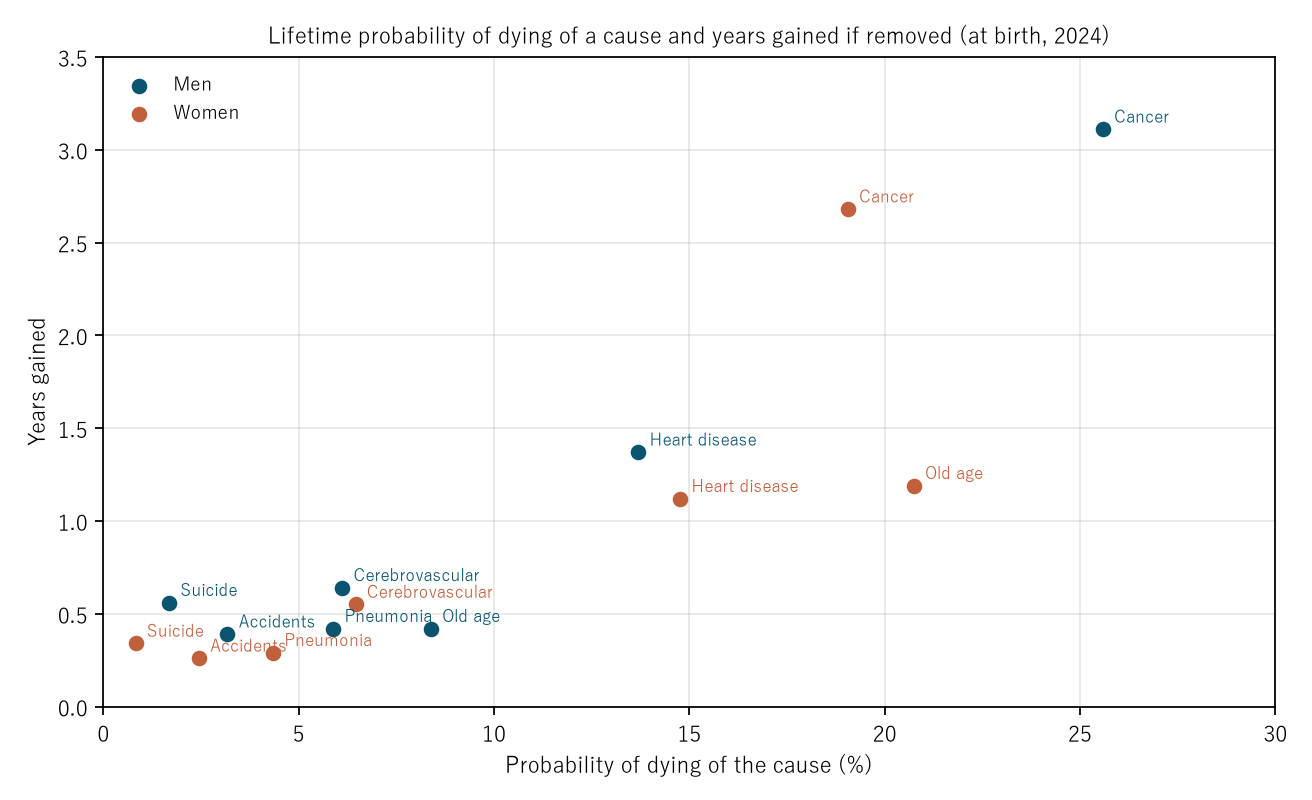
Figure 1: Probability (horizontal) against gain (vertical), both at age 0 in 2024; navy for men, vermilion for women. At the same probability, the height differs by cause.
5. Probabilities add; gains do not
Calculation 5.1 Cancer, heart disease and cerebrovascular disease
| Probability: sum of three | Probability: combined row | Gain: sum of three | Gain: combined row (removed together) | |
|---|---|---|---|---|
| Men | 45.41% | 45.41% | 5.12 y | 5.90 y (1.152 times) |
| Women | 40.29% | 40.29% | 4.35 y | 4.86 y (1.117 times) |
Observation 5.2: The three probabilities sum exactly to the combined row. The gains, removed together, exceed their sum by 0.78 years for men and 0.51 for women. Removed one at a time, the people spared are taken by the other two; removed together, they are not. Gains cannot be added across causes.
6. Core — age at death sets the size of the gain
Calculation 6.1 Mean age at death from each cause (vital statistics, 5-year midpoints, 100 and over as 102.5) and gain per 1% of probability
| Cause | Men: mean age at death | Men: gain ÷ probability | Women: mean age at death | Women: gain ÷ probability |
|---|---|---|---|---|
| Suicide | 53.7 | 0.331 y | 52.8 | 0.410 y |
| Accidents | 77.8 | 0.123 y | 83.9 | 0.106 y |
| Cancer | 78.1 | 0.122 y | 79.5 | 0.141 y |
| Cerebrovascular | 79.3 | 0.105 y | 86.1 | 0.085 y |
| Heart disease | 80.6 | 0.100 y | 88.2 | 0.076 y |
| Pneumonia | 84.7 | 0.071 y | 89.1 | 0.067 y |
| Old age | 89.7 | 0.050 y | 93.2 | 0.057 y |
Observation 6.2: Over the 14 pairs, the correlation between mean age at death and "gain ÷ probability" is −0.971. The younger the deaths, the larger the gain per 1%. Suicide gives 0.331 and 0.410 years per 1%, old age 0.050 and 0.057 — 6.62 times for men and 7.14 times for women.
Observation 6.3: Women die of cancer 13.7 years younger than of old age (79.5 vs 93.2). So although its probability is smaller, cancer's gain is 2.25 times old age's. The gain reads roughly as how many die times how early they die.
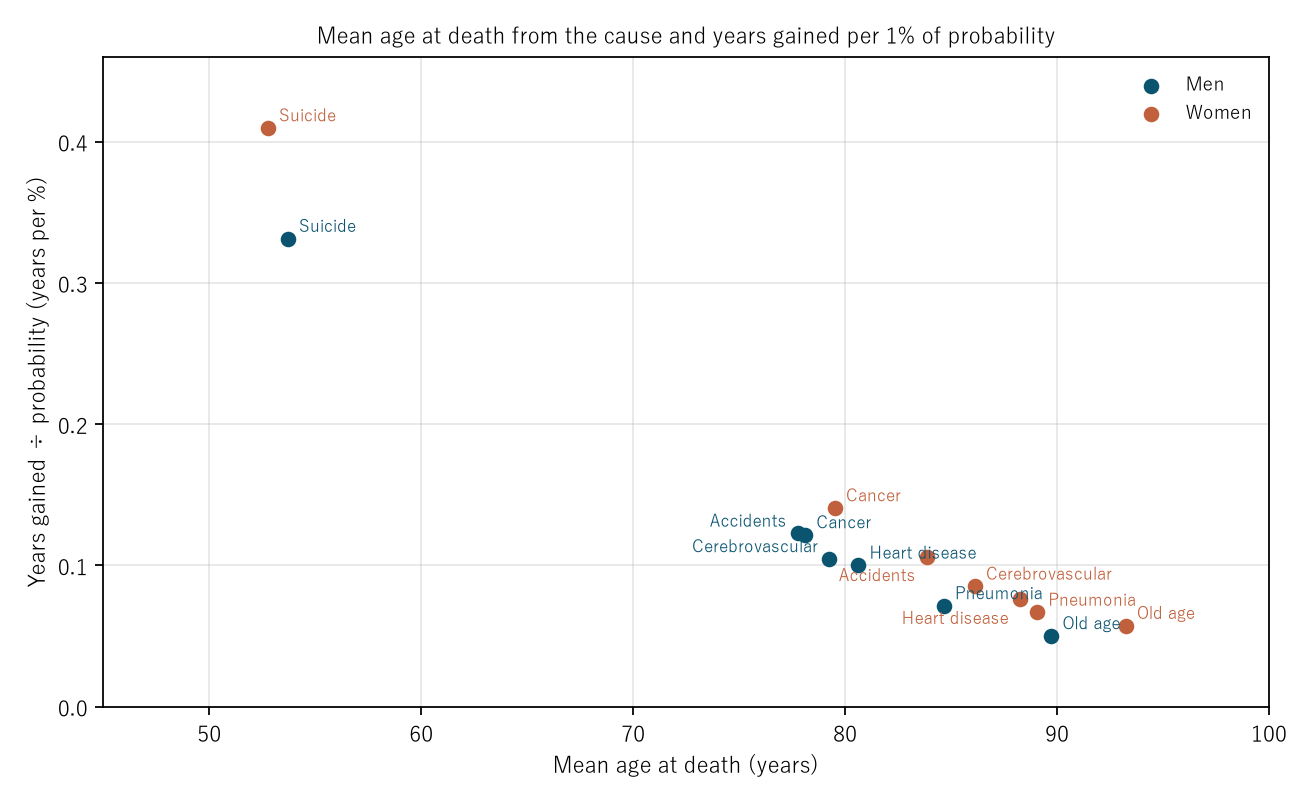
Figure 2: Mean age at death (horizontal) against gain per 1% of probability (vertical). The further right (causes of death at older ages), the lower.
7. Rebuilding the gains from deaths by cause
Calculation 7.1 This paper's approximation: for each single-year death probability q, take the cause's share f of deaths in the same 5-year group and set the cause-removed probability to 1 − (1 − q)^(1 − f). The stationary population is approximated by trapezoids, and the same approximation is used before removal before taking the difference.
| Cause | Men: rebuilt | Men: table | Women: rebuilt | Women: table |
|---|---|---|---|---|
| Cancer | 3.113 y | 3.11 y | 2.678 y | 2.68 y |
| Heart disease | 1.371 y | 1.37 y | 1.121 y | 1.12 y |
| Cerebrovascular | 0.639 y | 0.64 y | 0.553 y | 0.55 y |
| Pneumonia | 0.417 y | 0.42 y | 0.287 y | 0.29 y |
| Accidents | 0.392 y | 0.39 y | 0.262 y | 0.26 y |
| Suicide | 0.558 y | 0.56 y | 0.337 y | 0.34 y |
| Old age | 0.422 y | 0.42 y | 1.184 y | 1.19 y |
| Three causes | 5.914 y | 5.90 y | 4.856 y | 4.86 y |
Observation 7.2: The rebuilt gains differ from the table by at most 0.006 years for 7 causes × 2 sexes and 0.014 for the three-cause row. One idea — remove, at each age, the cause's share of the force of mortality — reaches the published values.
8. Limitations
- These are period figures, assuming 2024 mortality stays fixed (M003).
- "Removing a cause" is a computational assumption of independent causes; it does not show the effect of treatment or prevention.
- Mean age at death was counted from that year's deaths at 5-year midpoints; it is descriptive and affected by the population age structure.
- The rebuild is this paper's approximation, not a copy of the published method's details.
- Cells with fewer than 10 deaths were used in the rebuild but are not shown.
- Only age-0 values were treated.
Conclusion
In the 2024 life tables, men's probability of dying of cancer was 25.59%, and removing cancer added 3.11 years. Women's old age had a larger probability (20.75%) than cancer but added 1.19 years, less than half of cancer's gain. Probabilities added across three causes; gains, removed together, exceeded their sum by 0.78 and 0.51 years. The gain per 1% of probability correlated −0.971 with mean age at death.
One thing separates them — the age at which people die of the cause.
When you hear "how many years life expectancy would grow without cancer", remember that it counts years lost, not people lost, and that its size depends on how old people are when they die of it.
Data and reproduction
| Data | Ministry of Health, Labour and Welfare, "Abridged Life Tables for 2024", Tables 1 and 2 and the reference tables (cause-specific death probability; gains from removing a cause, corrected 12 September 2025), the overview and method, and the correction notice; "Vital Statistics 2024 (final data)", Volume 2, Table 2. All retrieved from e-Stat (accessed 25 September 2026) |
| Terms of use | e-Stat content follows the Public Data License (Version 2.0) of the Government of Japan (compatible with CC BY 4.0). The rebuilt gains, ratios and mean ages at death were produced by processing these and are not figures produced by the government |
| Scope | Japan, by sex, 2024, 7 causes and the three-cause row, age 0 |
| Verification | 検算/M011.py (--zu also writes the figures). Every number in the text is taken from 検算/M011_output.txt |
| Raw data | The 7 retrieved files and SOURCES.md (URLs, retrieval date, SHA-256, key points of the correction and method, how the rebuild was set up) in data/ |
| Figures | 図/M011_zu1, 図/M011_zu2 (png, svg, English versions) |
References
- Ministry of Health, Labour and Welfare. Abridged Life Tables for 2024, Table 1 and Table 2; reference tables: cause-specific death probability, gains in life expectancy from removing a cause (in Japanese). e-Stat (accessed 25 September 2026). https://www.e-stat.go.jp/
- Ministry of Health, Labour and Welfare. Vital Statistics 2024 (final data), Volume 2, Table 2 (in Japanese). e-Stat (accessed 25 September 2026). https://www.e-stat.go.jp/
- Yamagishi, Y. (2026). Life Expectancy Is Not the Number of Years Anyone Actually Lives [M003]. Zenodo. https://doi.org/10.5281/zenodo.22963485
Reference
Yamagishi, Y. (2026). Years Gained "Without Cancer" Are Not Set by the Probability of Dying of It Alone [M011]. Zenodo.
DOI: 10.5281/zenodo.22966052
YOI: https://www.yamagishiyuuki.com/yoi/M011
ORCID: 0009-0006-8587-3450
PDF (English) · PDF (Japanese) · Date proof of the English PDF (OpenTimestamps .ots) · SHA256SUMS
The record page for this paper (in Japanese, with the PDFs in each language and the date proof): YOI M011. This paper is a preprint and has not been peer reviewed.